Project 2 Thermal modeling of battery pack
PROJECT 2:- Thermal modeling of battery pack
AIM:- Create a 10 cell series lithium ion battery model, simulate the thermal effects and compare life cycle performance at various temperatures, charge & discharge rates using MATLAB.
ABSTRACT:-
Now a bay Lithium-ion cells are widely used for Electric Vehicle because of their high voltage and high energy density.Many of the commercial lithium-ion cells have lithium cobalt oxide (LiCoO2) positive electrodes, carbon negative electrodes, and nonaqueous electrolyte solutions. These cells should be safe because the various types of electronic protection devices such as overcharge protection circuit and fuse are installed in the commercial battery pack even if the battery pack employs only one cells.The thermal management and heat prediction are essential to improve the Li-ion battery operation life and performance, especially in Energy Storage System (ESS) for electric vehicles. Variation of cells temperatures of a battery pack can cause damage if not managed. In this project, an electrochemical-thermal battery pack of 10 Series-connected cylindrical Li-ion cells is modelled using model.The battery pack is cooled using air cooling approach with different inlet velocity to investigate its impact on the model temperature evolution , and the developed thermal model was then, charged/discharge at different temperatures to generate the essential data needed to model an electric-thermal model and identify its parameters in Matlab/Simulink software.
INRODUCTION:-
Battery packs are extensively used in electrical vehicles (EV) to avoid environmental pollution. The safety, aging and life of battery pack are significantly related to its thermal behavior. This work concerns with thermal analysis and optimization of an EV battery pack for real engineering applications. The Bernardi's heat generation model with the consideration of reversible heat is used and validated by tests and numerical simulation on battery cells.Li-ion battery consists of cathode, anode, electrolyte, separator. The electrochemical performance and the cost of a battery are determined by the active material of the cathode. LiCoO2, LiMn2O4, LiNi1-x-yCoxMnyO2, LiFePO4 etc. are included in the mainstream of the commercialized positive electrodes. LiCoO2 is recognized to be the earliest commercialized material, giving the advantages of simple preparation process, stable material properties and high energy density but it is disadvantageous in the cases of poor thermal stability and security risks. LiMn2O4has abundant resources, is priced low and performs well, but it has the disadvantages of low energy density, poor in terms of thermal stability and its crystalline structure can be distorted very easily. Therefore, it has poor high temperature storage performance and poor cycle performance. LiNi1-x- yCoxMnyO2 sums up the advantages of three elements, which has the advantages of large specific capacity, outstanding cycle performance and moderate price of cost, while it has the disadvantages of poor material surface stability due to property of hard oxidation of divalent Ni. LiFePO4 gives better cycle performance, the security is good enough, but it has low mix conductivity, low energy density and performance rate is poor.
Battery:-
- Battery consist of two or more voltaic cells that are connected in series to provide a steady DC voltage at the battery output terminals.The voltage is produced by a chemicl reaction inside the cell. Electrodes are immersed in an electrolyte, which forces the electric charge to separate in an the form of ions and free elctrodes.
Connecting Battery in Series:-
- Connecting a battery in series is when we connect two or more batteries together to increase the battery systems overall voltage, connecting batteries in series does not increase the capacity only the voltage.
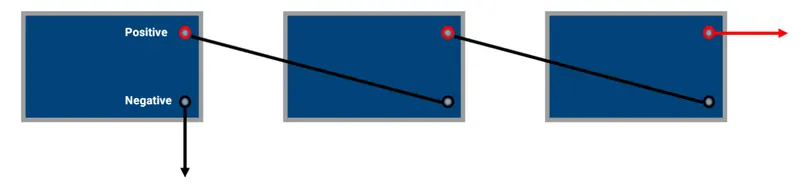
- To configure batteries with a series connection each battery must have the same voltage and capacity rating of the batteries.
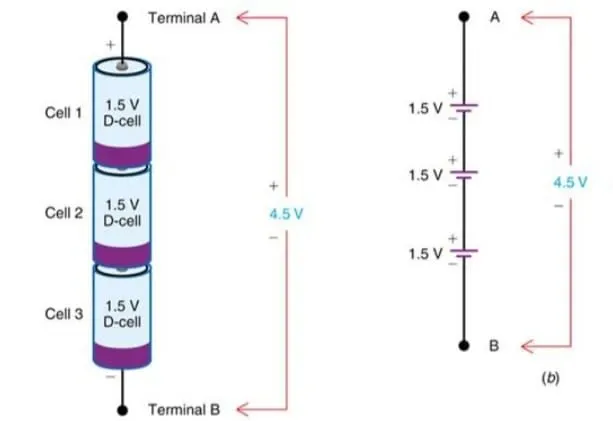
- To connect a group of batteries in series we connect the negative terminal of one battery to the positive terminal of another and so on until all batteries are connected by the cable to the negative terminal of the first battery in your string of batteries to yo application, then another cable to the positive terminal of the last battery in your string to your application.
- The overall emf of the battery is the algebric sum of all individual cells connected in series.If E is the overall emf of the battery combined by n number of cells, Then
`E=E1+E2+E3+E4......+En`
- Similarly. if r1,r2,r3 are the internal resistances of individual cells, then the internal resistance of the battery will be equal to the sum of the internal resistance of the individual cells.
`r=r1+r2+r3+...............rn`
Advantages:-
- Wiring batteries in series provides a higher system voltage resulting in a lower system current. Low current indicates that you can use thinner wiring and suffer less voltage drop in the system.
Disadvantages:-
- In a series-connected battery system, a converter is needed to achieve low voltages.
Charge curve of Lithium-ion cell | CC-CV method charging:-
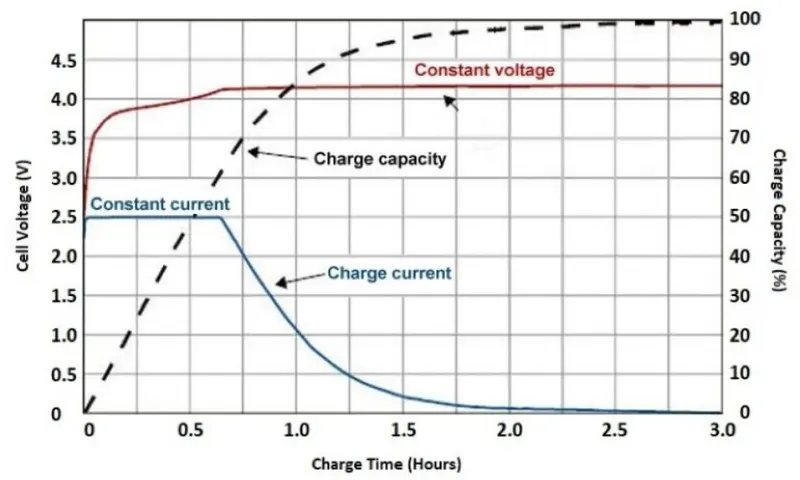
This charge curve of lithium-ion cell plots various parameters such as voltage, charging time, charging current and charge capacity. When the cell are assembled as a battery pack for an application, thery must be charged using a constant current and constant voltage (CC-CV) methode. Hence, a CC-CV charger is hightly recommended for Lithium-ion batterys.
- The CC-CV method starts with constant charging while the battery pack voltage rises.
- When the battery reaches its full charge cut-off voltage, constant voltage mode takes over, and there is a drop in the charging current.
- The charging current keeps coming down unit it reaches below 0.05C.
- The battery reaching its full charge voltage at this stage does not mean that it is 100% charged. Thrickle charge mode kicks in immediately after this stage, where a reducing charging current charge the remaining battery capacity while balancing the cells at the same time.
- When every cell has been balanced and has reached its full charge voltage, at this point, the battery pack is really 100% charged.One way to know this it when the charging current has reached closed to 0.05C.
Discharge Curve of Lithium-ion cell at Various C-Rate of discharge:-
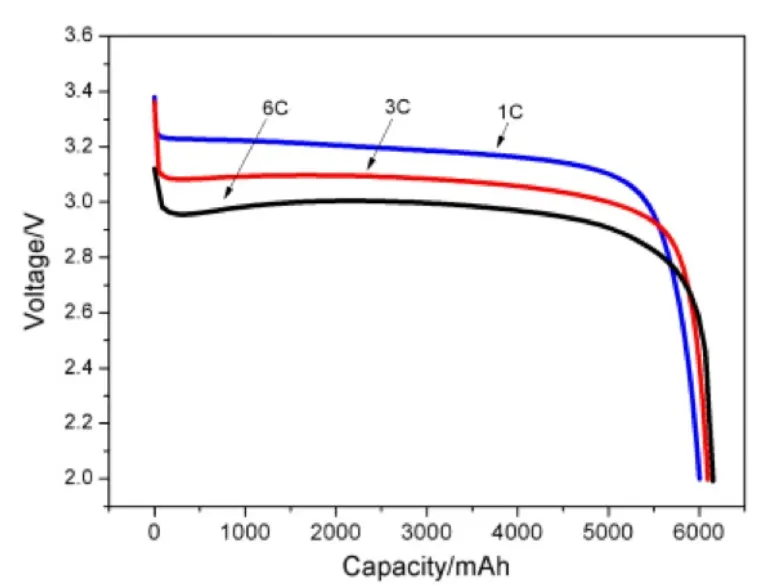
- This discharge curve of a Lithium-ion cell plots voltage vs discharged capacity. A flat discharge curve is better because it means the voltage is constant throughout the course of battery discharge. But a flat discharge curve also menas the battery might not deliver close to 100% DOD (depth of discharge) because the battery cuts off if one of the cells reaches its lower cut-off voltage.
- C-Rating- C-Rating is associated with charging or discharging a battery. C-Rating of discharge is a measure of the rate at which the battery is being discharge when compared to its rated capacity.A 0.5 rate means that this particular discharge current will discharge the battery in 2 hours.For example, a 50 Ah battery will discharge at 25A for 2 hours. A similar analogy applies to the C-rate of charge.
Discharge curve of Lithium-ion cell at various temperatures:-
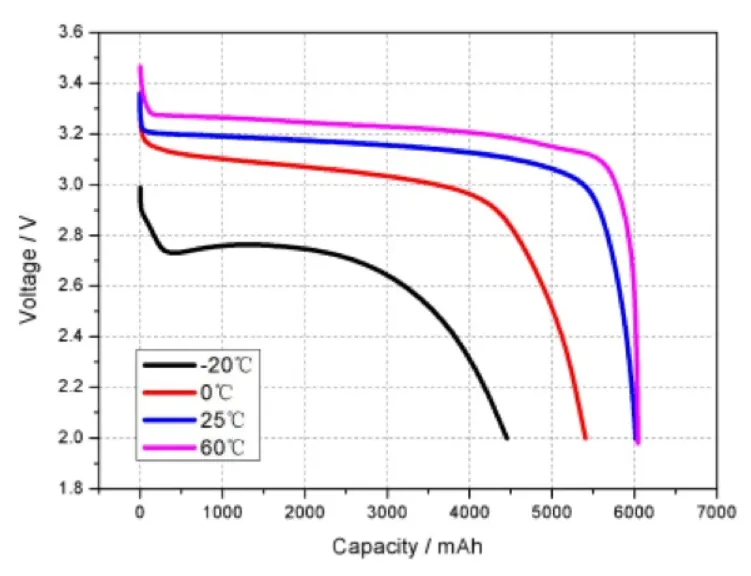
- Lithium-ion cells can charge between 0 deg C and 60 deg C and can discharge between -20 deg C and 60 deg C. A stadard operating temperature of 25+2 deg C or 25-2 deg C during charge and discharge allows for the performance of the cell as per its datasheet.
- Cells discharging at a temperature lower than 25 deg C deliver lower voltage and lower capacity resulting in lower energy delivered. On the other hand, cells discharging at a temperature higher than 25 deg C deliver higher voltage and higher capacity. Higher operation temperature allows for better flow of electrons resulting in higher energy delivered. But there is a drawback, i.e reduction in cell cycle life when operating at higher temperatures.
Cycle life of Lithium-ion cell:-
- According to the industry standard, the cycle life of a Lithium-ion cell is defined as the number of charge-discharge cycles of the cell by the time it reaches 80% retention capacity of its original capacity. The recommended Depth of Discharge taken for the cycle life testing is 80 %. The cycle life of a Lithium-ion cell increases as its DoD decreses.
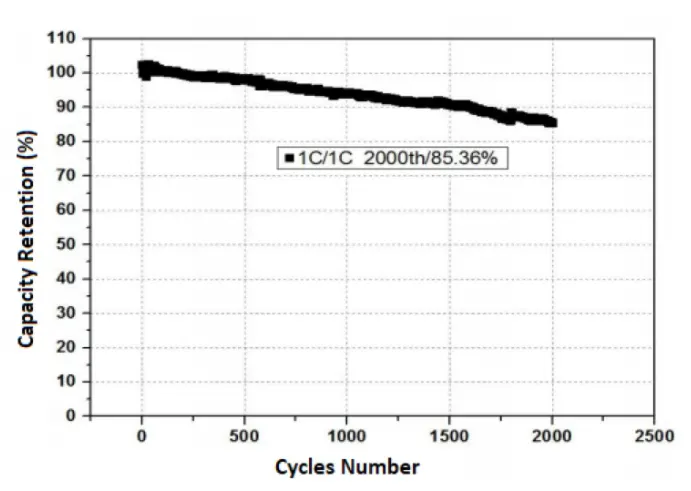
- This curve of a Lithium-ion cell plots capacity retention vs cycle number.It is defined at 1C charge rate and 1C discharge rate.
- NMC cells have a cycle life of 500-2000 cycles, while lithium iron phosphate battery (LiFePO) or LFP cells have a cycle of 2000-5000 cycles depending on the cell from factor, charge-discharge C- Rating and operation temperature. The lithium-titanate or lithium-titanium-oxide (LTO) cells have the highest cycle life of up to 25000 cycles at 100% DoD.LTO cells are the safest in the industry as they do not catch fire, can operate in water and can even operate when punctured. LTO cells support upto 10C fast charging and can charge upto 80% in 6 minutes.
- Standard operation temperature of 25+2 deg C or 25-2 deg C is assumed in the cycle life graph if it does not mention the operation temperature Higher operation temperature leads to a reduction in battery cycle life.
Model - 1] Model of 10 Cells are connected in Series without Fault cell :-
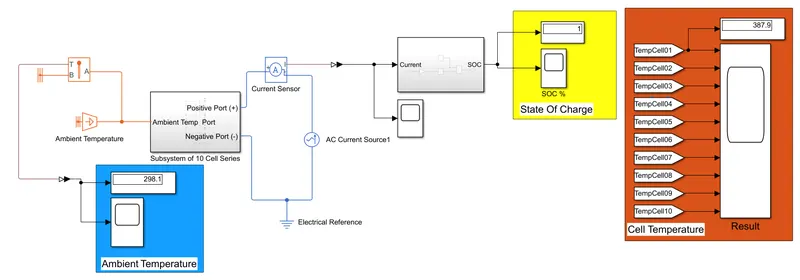
Subsystem in Subsystem of 10 Cell Series Block:-
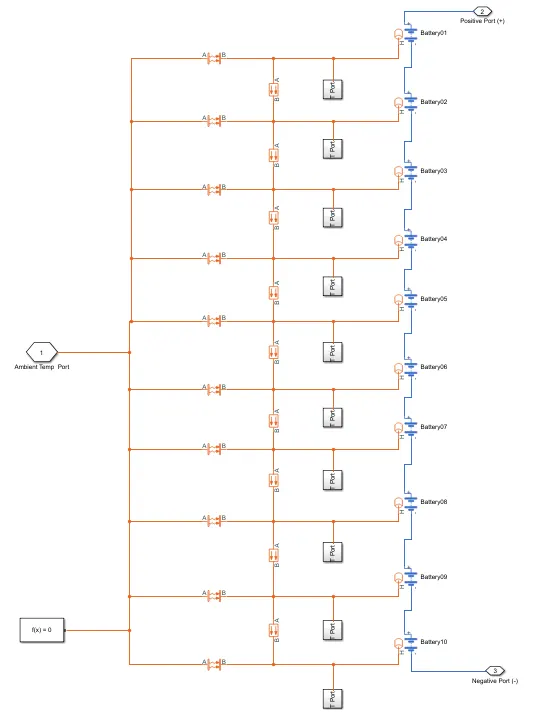
- In this subsystem I have Connected 10 cell are parallel.I have give all thermal port give ambient temperature.Series connected convection heat transfer block and parallel connected conduction heat transfer of battery block.
Subsystem:-
Block name and their explanation:-
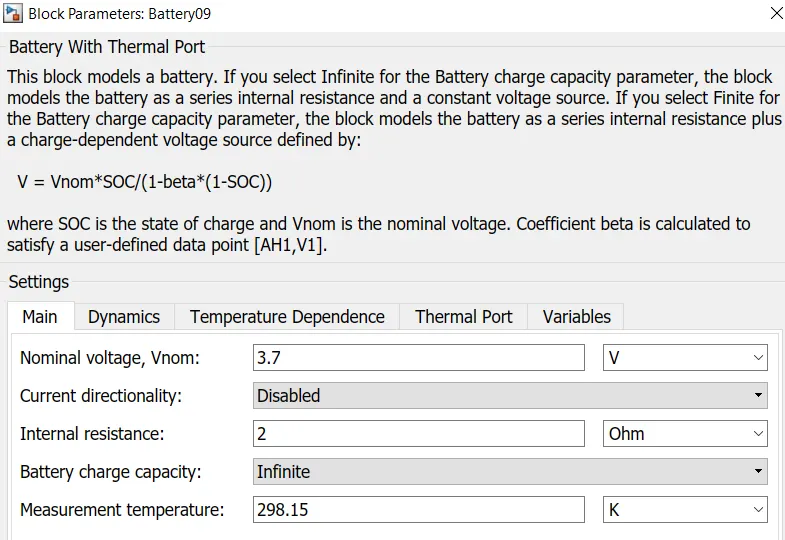
1] Battery:-
- The Battery block represents a simple battery model.there are two terminal of this battery one is positive (+) and second is negative(-) terminal.
- This block models a battery. If you select Infinite for the Battery charge capacity parameter, the block models the battery as a series internal resistance and a constant voltage source. If you select Finite for the Battery charge capacity parameter, the block models the battery as a series internal resistance plus a charge-dependent voltage source defined by:
V = Vnom*SOC/(1-beta*(1-SOC))
where ,
SOC is the state of charge and Vnom is the nominal voltage. Coefficient beta is calculated to satisfy a user-defined data point [AH1,V1].
The block has four modeling options, accessible by setting the Modeling option parameter to either:-
i) Uninstrumented | No show thermal port :- Basic model that does not output battery charge level or simulate thermal effects.
ii) Uninstrumented | show thermal port :- Model with exposed thermal port. This model does not measure internal charge level of the battery.
iii) Instrumented | No show Thermal Port :- Model with exposed charge output port. This model does not simulate thermal effects.
iv) Instrumented | show Thermal Port :- Model that lets you measure internal charge level of the battery and simulate thermal effects. Both the thermal port and the charge output port are exposed.
Block Symbol with thermal port -

Block Parameters:-
2] Convection Heat Transfer:-
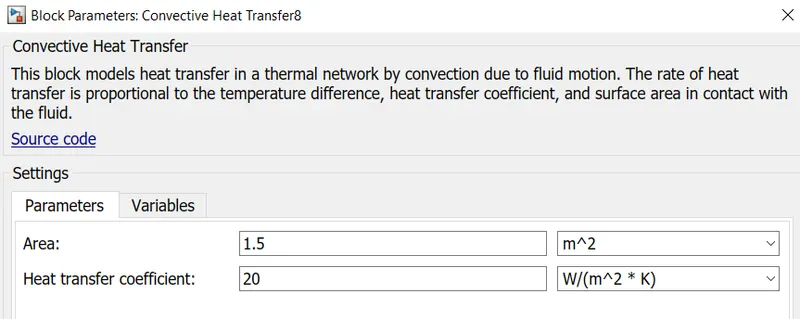
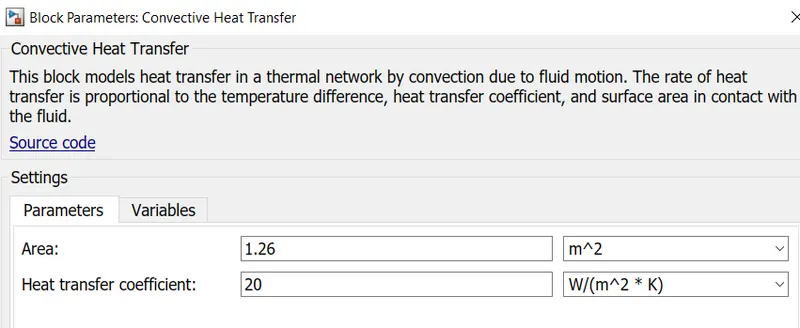
- The Convective Heat Transfer block represents a heat transfer by convection between two bodies by means of fluid motion. The transfer is governed by the Newton law of cooling.Connections A and B are thermal conserving ports associated with the points between which the heat transfer by convection takes place. The block positive direction is from port A to port B. This means that the heat flow is positive if it flows from A to B.
`Q=K.A [Ta-Tb]`
Where,
Q is heat flow.
K is convection heat transfer coefficient.
A is surface area.
D is distance between layers (that is, thickness of material).
Ta and Tb are temperatures of the two bodies.
Block Symbol:-
Block Parameters:-
3] Conduction Heat Transfer:-
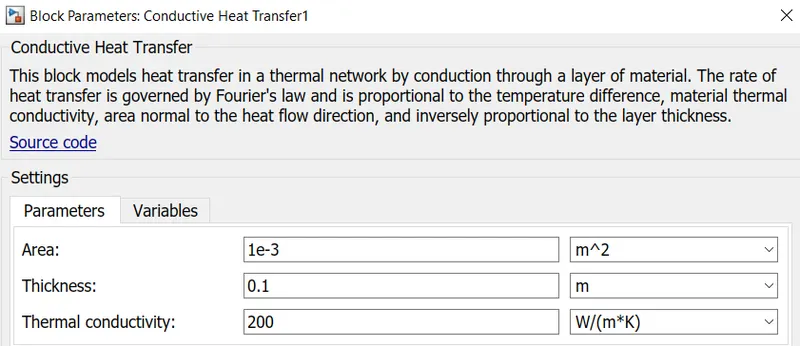
- The Conductive Heat Transfer block represents a heat transfer by conduction between two layers of the same material. Connections A and B are thermal conserving ports associated with material layers. The block positive direction is from port A to port B. This means that the heat flow is positive if it flows from A to B.The transfer is governed by the Fourier law:-
`Q= K.(A/D) [Ta-Tb]`
where,
Q is heat flow.
K is thermal conductivity of the material.
A is area normal to the heat flow direction.
D is distance between layers (that is, thickness of material).
Ta is temperature of layer A.
Tb is temperature of layer B.
Block Symbol:-
Block Parameters:-
4] Ambient Temperature Block:-
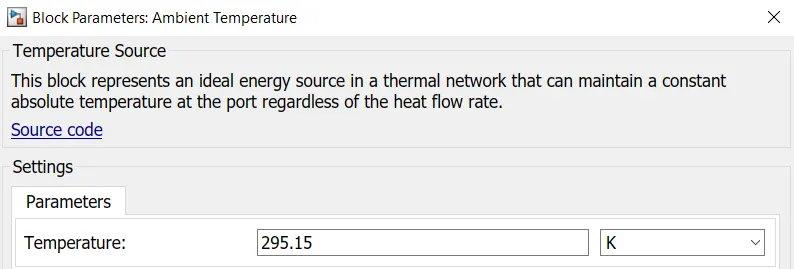
- The Temperature Source block represents an ideal source of thermal energy that is powerful enough to maintain specified temperature at its outlet regardless of the heat flow consumed by the system.
- Ambient temperature is the air Temperature of any object or environment where equipment is stored. The adjective ambient means "relating to the immediate surroundings." Also sometimes referred to as the ordinary temperature or the baseline temperature, this value is important for system design and thermal analysis.
- In general, a safe range is between 60 and 75 degrees Fahrenheit or 15 and 25 degrees Celsius, although the cooler end of that range is better. Ambient temperatures above those ranges make it difficult for a computer's cooling system to keep it at a safe operating temperature.
Inportance of Ambient Temperature:-
Ambient temperature measurements are a crucial component in maximizing the longevity of devices, preventing malfunctions and avoiding damages. A few applications of knowing the ambient temperature of an item includes:-
- Validating that a device’s internal cooling system is working sufficiently, such as a laptop fan.
- Ensuring that materials, such as food or chemicals, are stored safely.
- Determining the energy efficiency of a heating or cooling system.
- Analyzing components to make sure maximum and minimum temperatures do not affect functionality or use.
- Controlling the temperature of an environment within an acceptable range.
- Limiting the power dissipation, or power current, to a safer value.
Block Symbol:-
Block Parameters:-
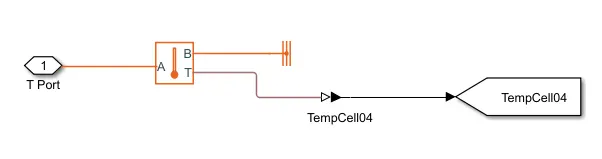
5] Temperature Senser:-
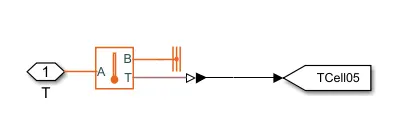
- The Temperature Sensor block represents an ideal temperature sensor, that is, a device that determines the temperature differential measured between two points without drawing any heat.
- Connections A and B are thermal conserving ports that connect to the two points where temperature is being monitored. Port T is a physical signal port that outputs the temperature differential value.
- The block positive direction is from port A to port B. The measured temperature is determined as:-
`T=Ta-Tb`
Block Symbol:-
6] Thermal Reference:-
- The Thermal Reference block represents a thermal reference point, that is, a point with an absolute zero temperature, with respect to which all the temperatures in the system are determined.The block has one thermal conserving port.
Block Symbol:-
7] Electrical Reference:-
- The Electrical Reference block represents an electrical ground. Electrical conserving ports of all the blocks that are directly connected to ground must be connected to an Electrical Reference block. A model with electrical elements must contain at least one Electrical Reference block.The block has one electrical conserving port.
Block Symbol:-
8] Current Sensor:-
- The Current Sensor block represents an ideal current sensor, that is, a device that converts current measured in any electrical branch into a physical signal proportional to the current.
- Use the (+) and (-) ports to connect the sensor in series with the other blocks in the branch where you want to measure the current. Port I outputs the measurement result as a physical signal.
Block Symbol:-
9] AC current Source:-
- The ideal AC current source maintains the sinusoidal current through it, independent of the voltage across its terminals.
- The output current is defined by- `I= I0*sin(2*pi*f*t+ PHI)`
Block Symbol:-

10] Goto block:-
- The Goto block passes its input to its corresponding From blocks. The input can be a real- or complex-valued signal or vector of any data type. From and Goto blocks allow you to pass a signal from one block to another without actually connecting them.
- A Goto block can pass its input signal to more than one From block, although a From block can receive a signal from only one Goto block. The input to that Goto block is passed to the From blocks associated with it as though the blocks were physically connected.
Block Symbol:-

11] From Block:-
- The From block accepts a signal from a corresponding Goto block, then passes it as output. The data type of the output is the same as that of the input from the Goto block. From and Goto blocks allow you to pass a signal from one block to another without actually connecting them.
Block Symbol:-

State Of Charge Estimation:-
Gain Block Parameter:-
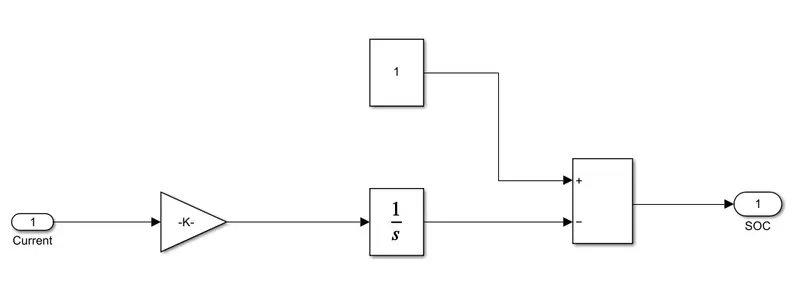
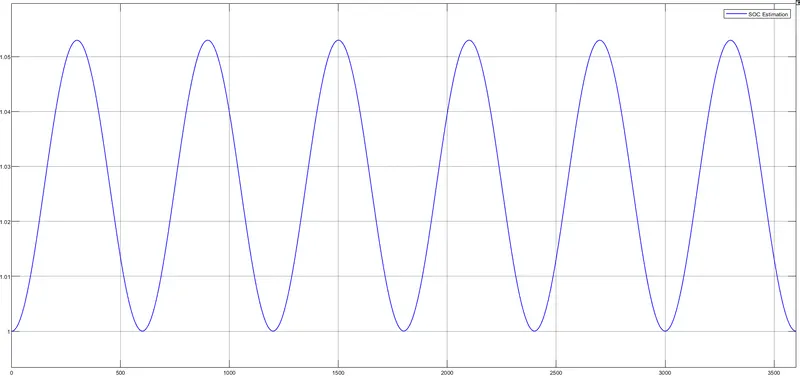
- The Coulomb counting method is one of the most general and simple methods of estimating the SOC. We use it for a baseline comparison for more advanced methods. The Coulomb counting method measures the current of the battery and integrates the current over time to estimate SOC. Limitations of the method, which lead to other projects along these lines, include the fact that inaccurate current measurements accumulate to large errors, whereas accurate current measurement is expensive. Other factors such as temperature, battery history, initial SOC and cycle life also influence the precision of the SOC estimate.
- Above subsyetm takes current form input and give the output in SOC.
RESULTS (1):-
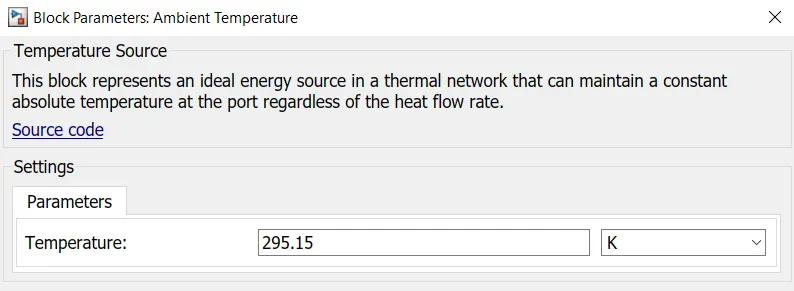
1] Results at 295.15 K ( 22 deg C) and Surface area= 1.26 m^2:-
Block parameter of Ambient Temperature input Source:-
Block parameter of Convective Heat transfer:-

2] Results at 298.15 K ( 25 deg C) and Surface area= 1.26 m^2:-
3] Results at 300.15 K ( 27 deg C) and Surface area= 1.26 m^2:-
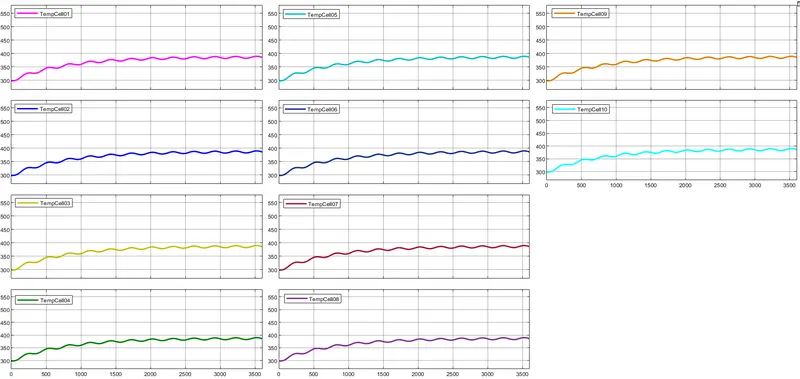
- We have run the model for 3600 sec. We simulate the result for 10 cell are connected in series without fault cell. First result we have give ambiant temperature at 295.15 K. The result temperature at 386 K (112.85 deg C). We have give surface area 1.26 m^2.
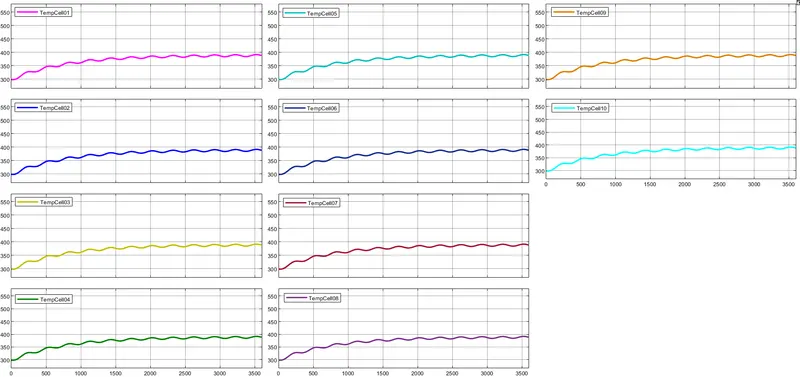
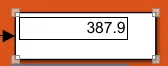
- Second result we have give ambiant temperature at 298.15 K. The result temperature at 387.9 K (114.75 deg C). We have give surface area 1.26 m^2.
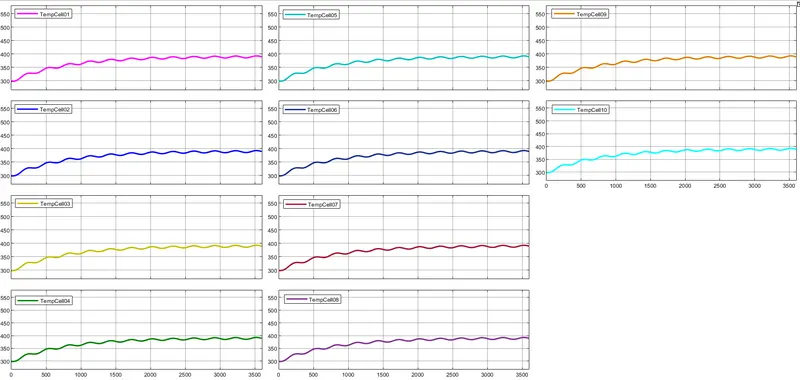
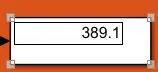
- Third result we have give ambiant temperature at 300.15 K. The result temperature at 389.1 K (115.95 deg C). We have give surface area 1.26 m^2.
- Above graph conclusion from , We have increses the Ambient Temperature the result temperature increases.
RESULTS (2):-
1] Results at 295.15 K ( 22 deg C) and Surface area= 1.5 m^2:-
2] Results at 298.15 K ( 25 deg C) and Surface area= 1.5 m^2:-
3] Results at 300.15 K ( 27 deg C) and Surface area= 1.5 m^2:-
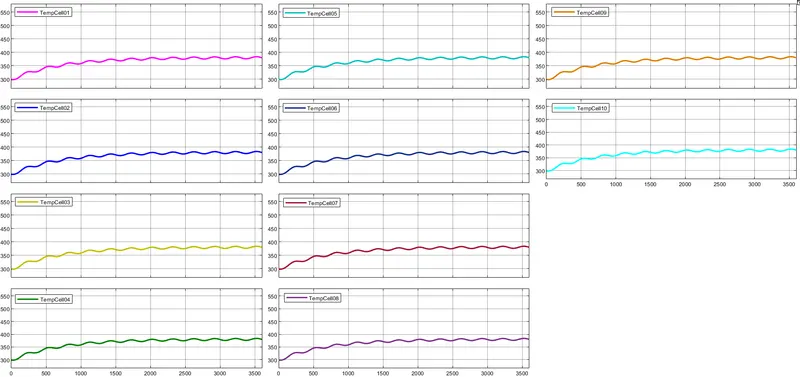
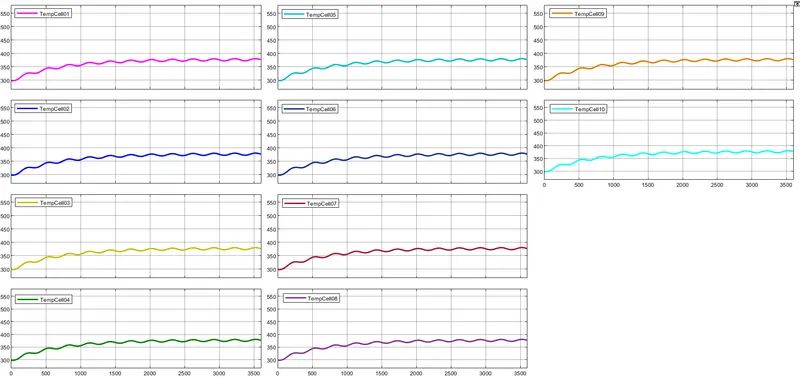
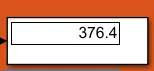
- First result we have give ambiant temperature at 295.15 K. The result temperature at 376.4 K (103.25 deg C). We have give surface area 1.5 m^2.
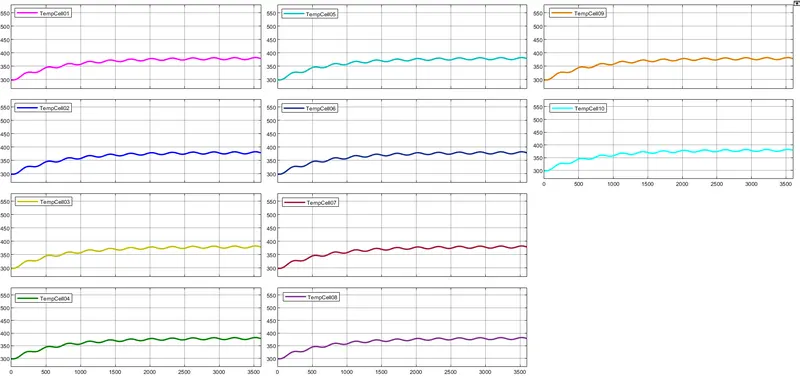
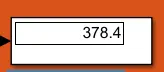
- Second result we have give ambiant temperature at 298.15 K. The result temperature at 378.4 K (105.25 deg C). We have give surface area 1.5 m^2.
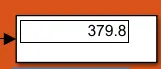
- Third result we have give ambiant temperature at 300.15 K. The result temperature at 379.8 K (106.65 deg C). We have give surface area 1.5 m^2.
- Above graph conclusion from , We have increses the Ambient Temperature the result temperature increases.
Model - 2] Model of 10 Cells are connected in Series with 1 Cell Fault :-
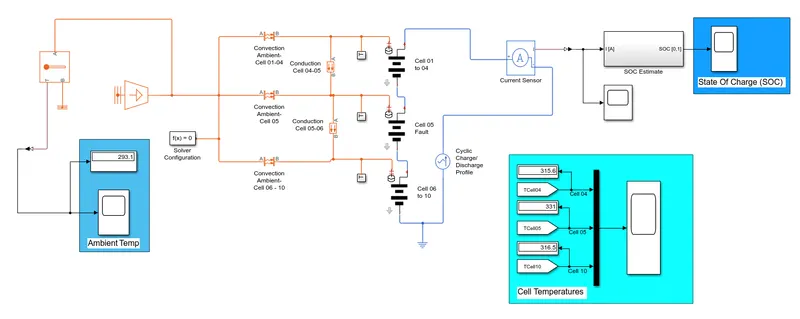
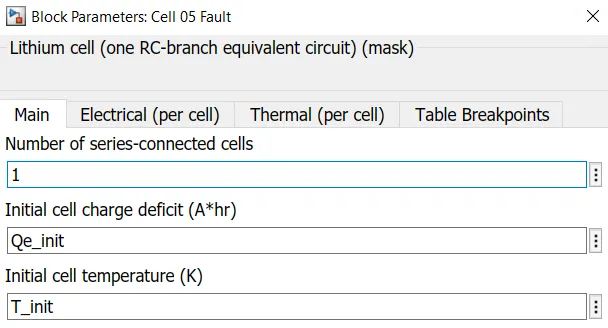
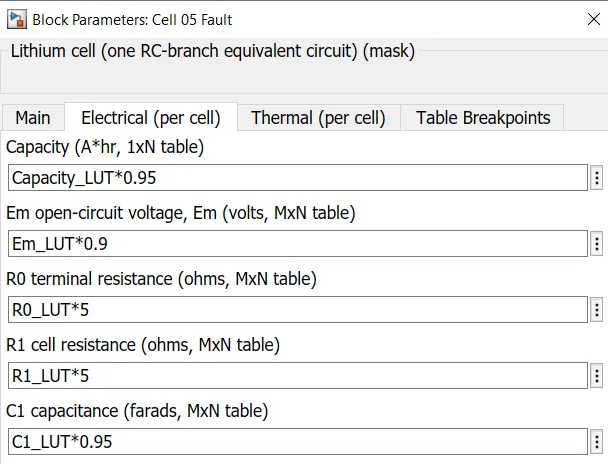
- Above example shows how to simulate a battery pack consisting of multiple series-connected cells in an efficient manner. It also shows how a fault can be introduced into one of the cells to see the impact on battery performance and cell temperatures. For efficiency, identical series-connected cells are not just simply modeled by connecting cell models in series. Instead a single cell is used, and the terminal voltage scaled up by the number of cells. The fault is represented by changing the parameters for the Cell 10 Fault subsystem, reducing both capacity and open-circuit voltage, and increasing the resistance values.
Subststem of Cell 01 to 04 Subsystem:-
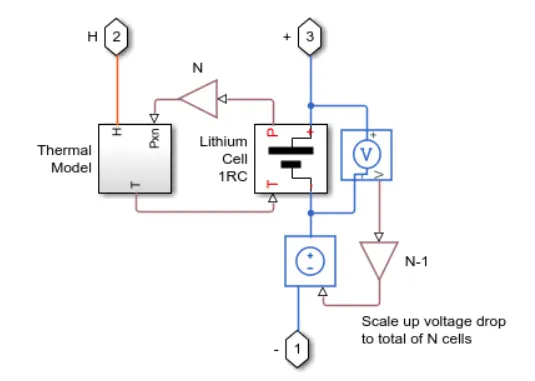
Subsystem of Lithium cell 1RC:-
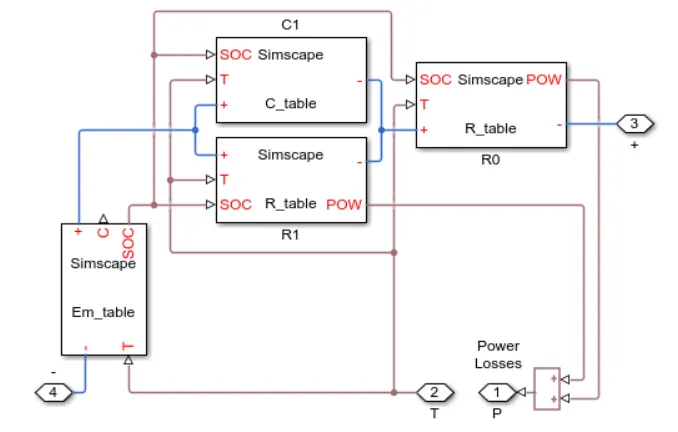
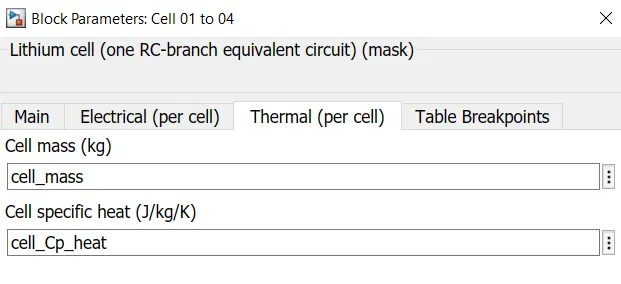
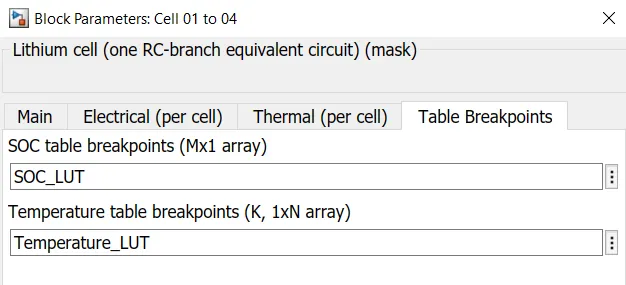
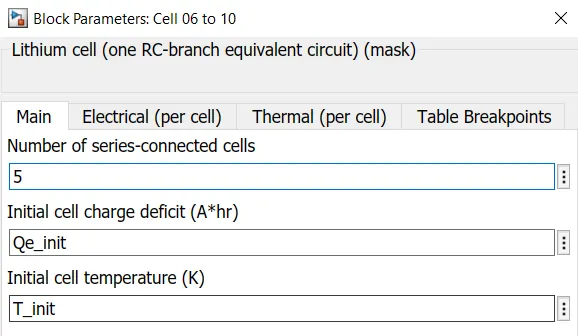
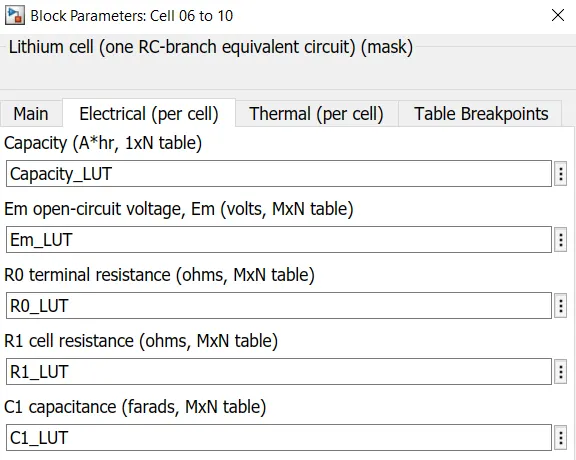
- Above cell subsystem consist of a thermal model and Lithium cell 1RC block which calculate the temperature and thermal effect for cell.
Block Parameters of Cell 01 to 04 :-
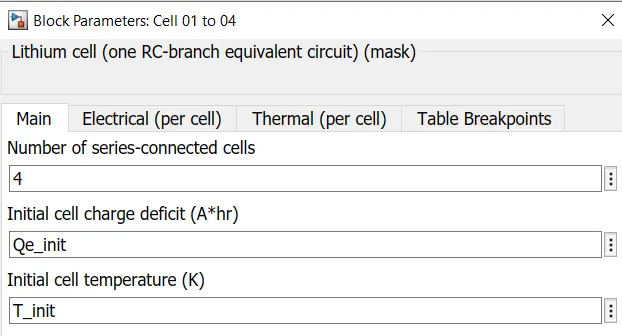
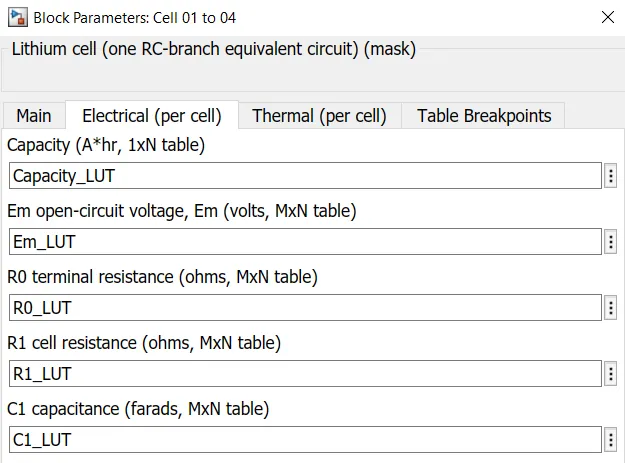
Block Parameters of Cell 5 Fault:-
Block Parameters of Cell 06 to 10 :-
Block Parameters of AC Current Source:-
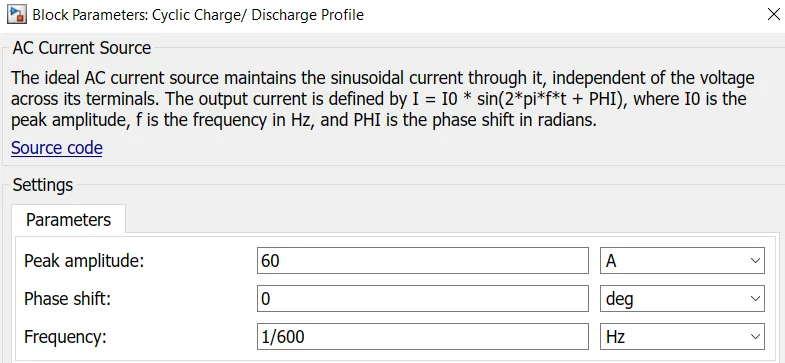
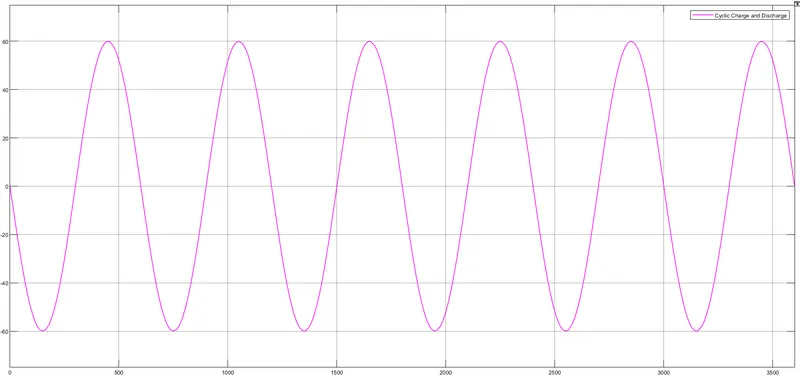
This block for cyclic charge/discharge profile. I have give Peak amplitude set to 60 A for cyclic charge and discharge.
State of charge estimation (SOC):-
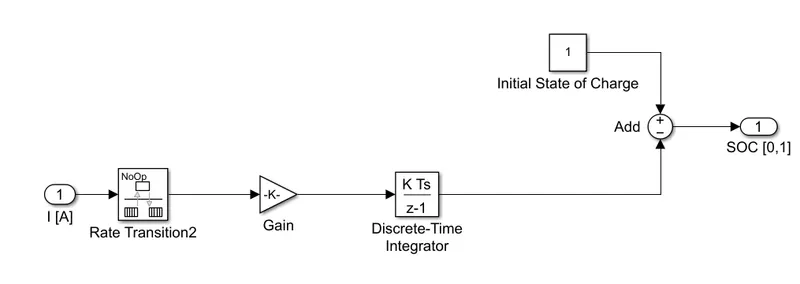
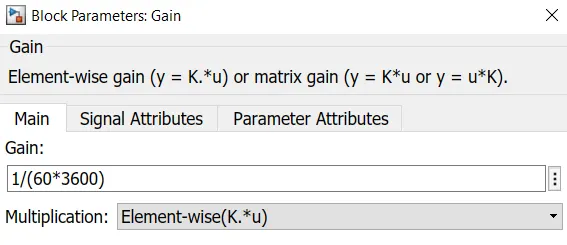
- In this Subsystem was created of various block.To measure the SOC of the battery.The first block name as Rate Transition2. This block transfers data from the output of a block operating at one rate to the input of a block operating at a different rate. Use the block parameters to trade data integrity.We have used second port name as Gain Block.This block is used in order to multiplayer divide the signal coming from Rate Transition2 block.
Block parameters of the Gain block as shown below:-
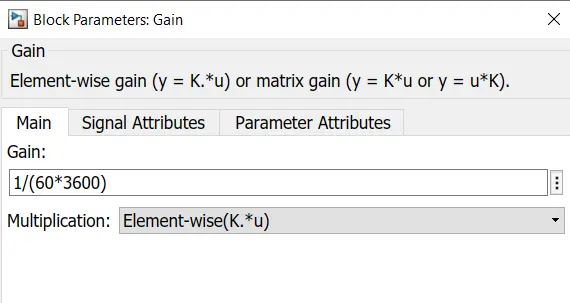
- Next block used name as Discrete time Integrator.This block Use the Discrete-Time Integrator block in place of the Integrator block to create a purely discrete model. With the Discrete-Time Integrator block, you can:- 1] Define initial conditions on the block dialog box or as input to the block.2] Define an input gain (K) value.3]Output the block state.4]Define upper and lower limits on the integral.
- We have used next block name as Sum Block. This block is used to perform addition and substraction operation as these block are made into a subsystem is called SOC Estimate.
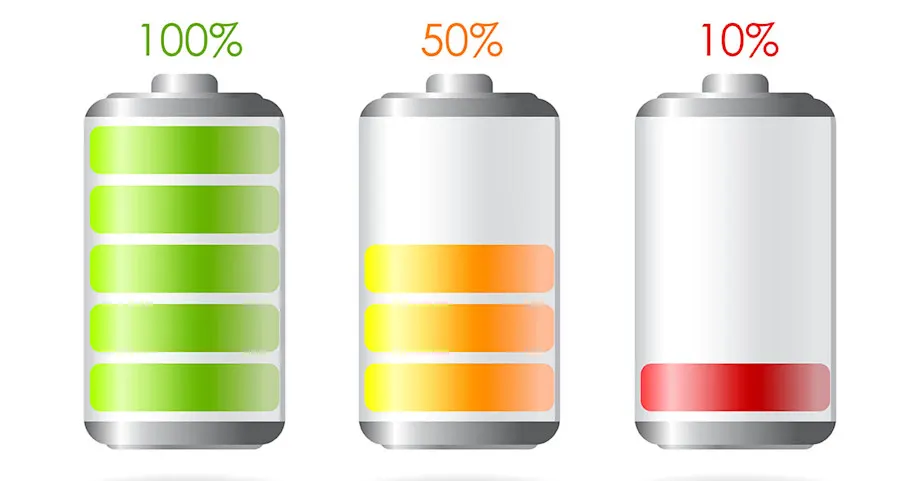
- State of charge (SoC):- It is the level of charge of an electric battery relative to its capacity. The units of SoC are percentage points (0% = empty; 100% = full). An alternative form of the same measure is the depth of discharge (DoD), the inverse of SoC (100% = empty; 0% = full).
- The Coulomb counting method is one of the most general and simple methods of estimating the SOC. We use it for a baseline comparison for more advanced methods. The Coulomb counting method measures the current of the battery and integrates the current over time to estimate SOC.
Limitations of the method:-
- which lead to other projects along these lines, include the fact that inaccurate current measurements accumulate to large errors, whereas accurate current measurement is expensive. Other factors such as temperature, battery history, initial SOC and cycle life also influence the precision of the SOC estimate. Practically speaking, some phenomena, such as decreasing SOC when the battery is resting, and variations with temperature changes, cannot be captured by the Coulomb counting method.
How to Convert temperature Kelvin to Deg C. We have show below formula:-
`D = K-273.15`
RESULTS:-
1] Results at 295.15 K ( 22 deg C):-
Block parameter of Ambient Temperature input Source:-
State of Charge of cell:-
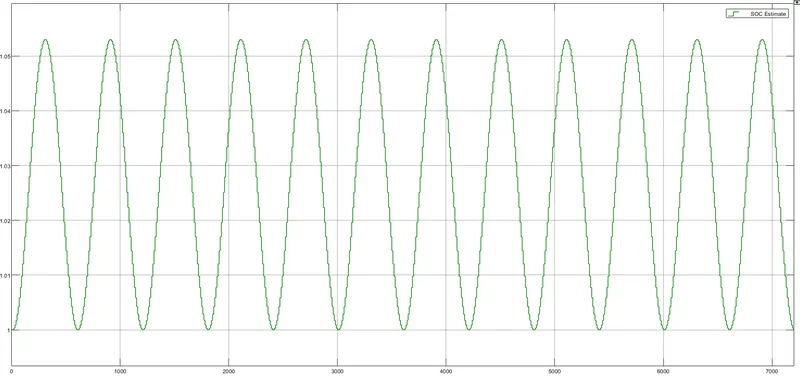
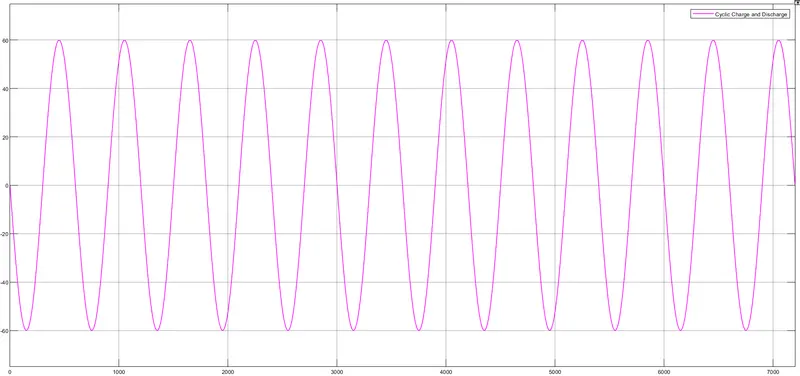
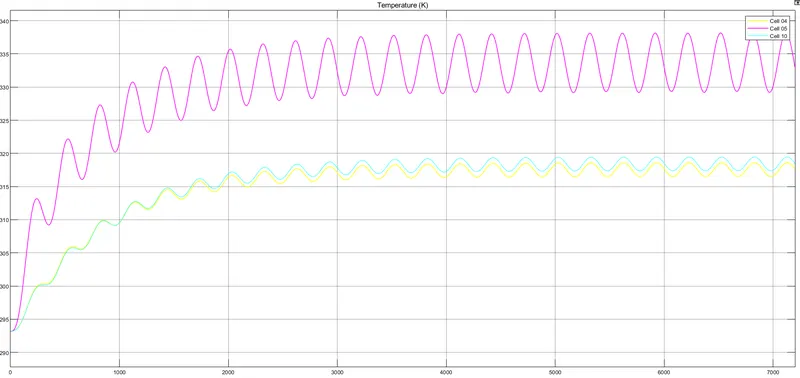
- Above graph shown the an AC source has been connected to analysis the cyclic charge and discharge performance. The positive cycle indicated charge the battery and the Negative cycle indicated discharge the battery.
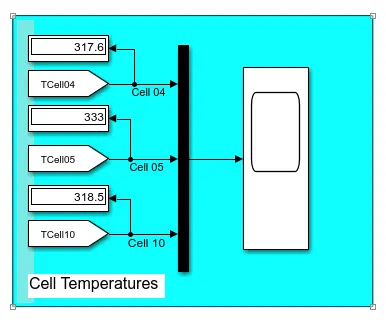
- We have run the model for a 10 cell series with 1 cell fault. We have observation the thermal effects and compare life cycle performance at various temperature, charge and discharge effect show following:-
- We can see in this model 01 to 04 cell are Normal cells. 05 th cell are Fault cell and next 06 to 10 cell Normal cells.We have observation thermal temperature of this Cells.The 05 th cells was faulty It will show temperature rise high than any other cell and this cell the life cycle of cell get reducing and cell even can get damages cell.
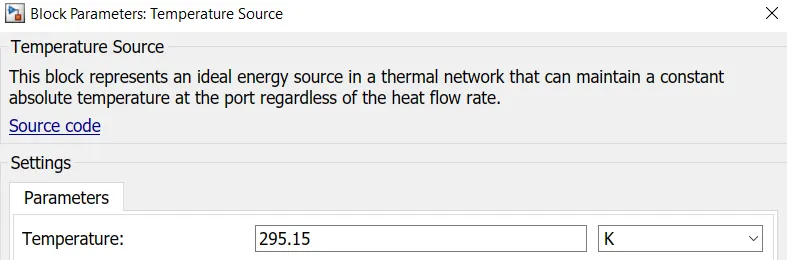
- We have give ambient temperature at 295.15 K (22 deg C). The cell no 01 to 04 normal call result Temperature at 317.6 K (44.45 deg C) and the cell no 06 to 10 normal call result temperature at 318.5 K (45.35 deg C). The 05 th Fault cell result temperature at 333 K (59.85 deg C).
2] Results at 298.15 K ( 25 deg C):-
Block parameter of Ambient Temperature input Source:-
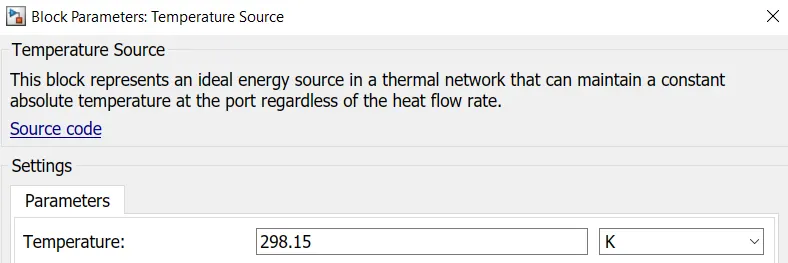
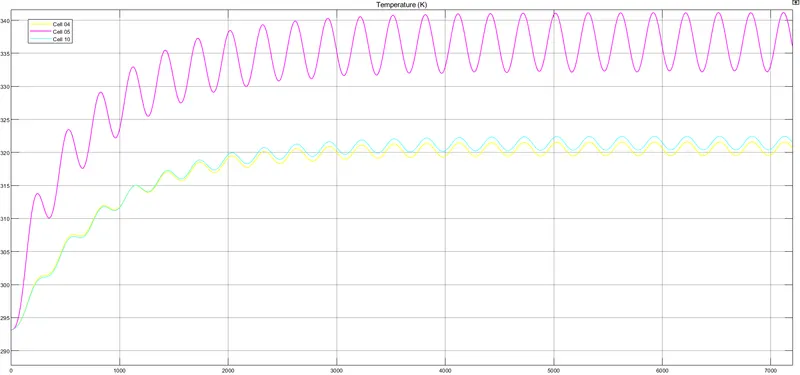
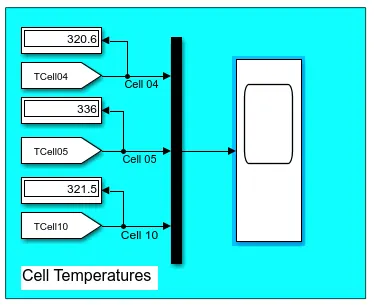
- We have give ambient temperature at 298.15 K (25 deg C). The cell no 01 to 04 normal call result Temperature at 320.6 K (47.45 deg C) and the cell no 06 to 10 normal call result temperature at 321.5 K (48.35 deg C). The 05 th Fault cell result temperature at 336 K (62.85 deg C).
3] Results at 300.15 K ( 27 deg C):-
Block parameter of Ambient Temperature input Source:-
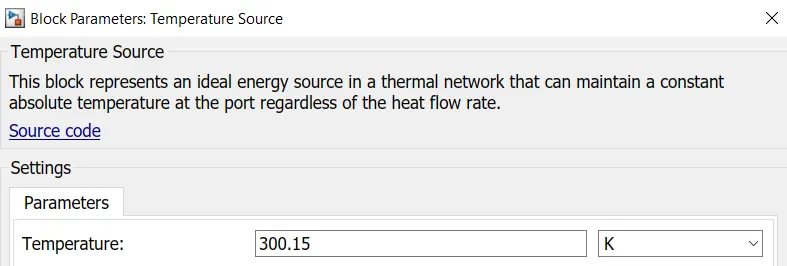
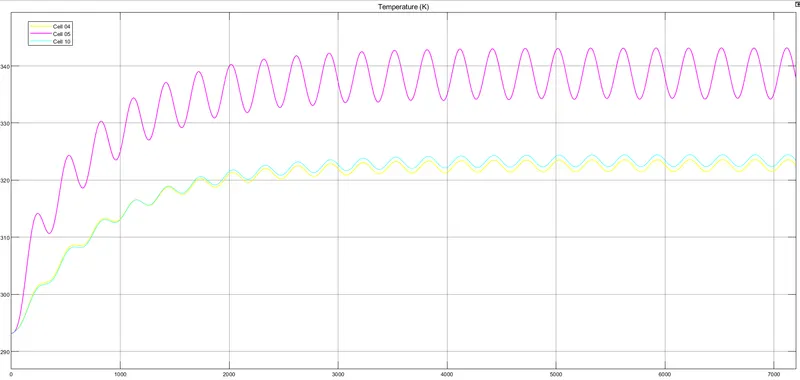
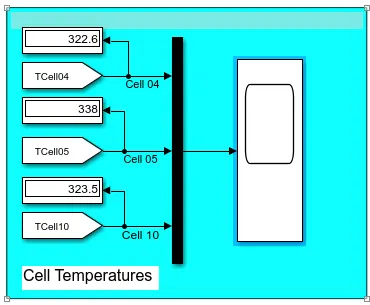
- We have give ambient temperature at 300.15 K (27 deg C). The cell no 01 to 04 normal call result Temperature at 322.6 K (49.45 deg C) and the cell no 06 to 10 normal call result temperature at 323.5 K (50.35 deg C). The 05 th Fault cell result temperature at 338 K (64.85 deg C).
CONCLUSION:-
- We have run the two different model:- 1] 10 Cell are connected in series without fault cell.
2] 10 Cell are connected in series with one fault cell.
- In First model result, We have increases the ambient temperature the result temperature increase and we have same ambient temperature but increses the surface area the result temperature decreases as compared to result (1).
- In Second model result, We have simulated the thermal effect and compared at various temperature, the fault cell temperature increses more than the Normal cell charge and discharge cycle given and due to temperature increses it can dameges the cell and reduce the performance of lithium-ion battery.