Project 2
PROJECT 2
AIM:
To compute flood levels for any major river with the following conditions.
Conditions:
- Consider minimum of 10km river reach
- Consider all inline and lateral structures
- Use RAS mapper
- For flow calculation use any one method as per syllabus
- Consider both steady and unsteady flow condition
- Compare results with existing flood levels for specific river segment
PROCEDURE:
- Download DEM from SRTM Downloader plugin of QGIS
- Using QGIS, find the catchment area
- Using unit hydrograph , find the maximum flood discharges during 25 and 100 years
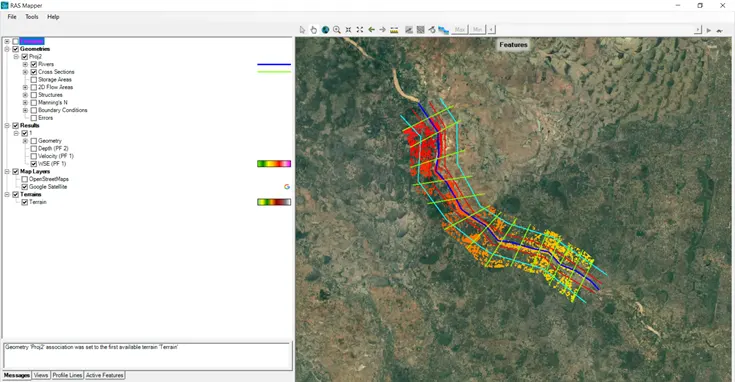
- Launch HECRAS and open RAS Mapper and add terrain
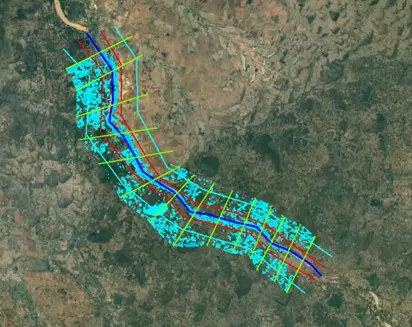
- Draw the river centerline, bank lines and flow paths for the chosen river along with the cross section
- Add bridges, culverts and inline structures for the river stretch considered
- Add the steady flow/unsteady flow data along with the boundary conditions
- Perform a steady flow /unsteady flow analysis
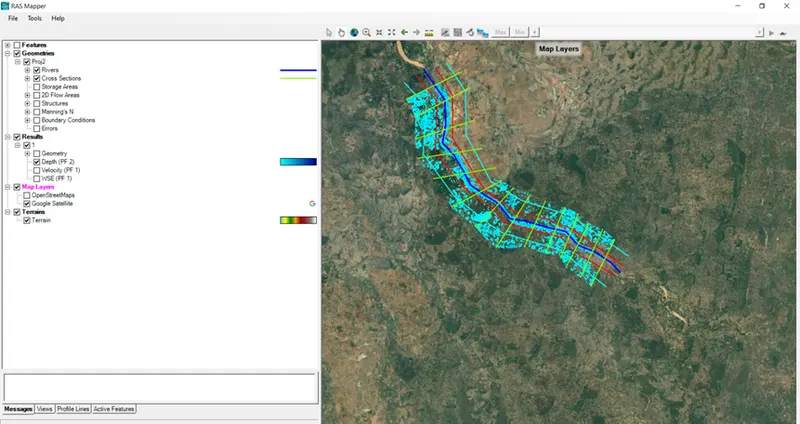
- View the flood inundated areas in RAS Mapper
1) Download DEM from SRTM Downloader plugin of QGIS
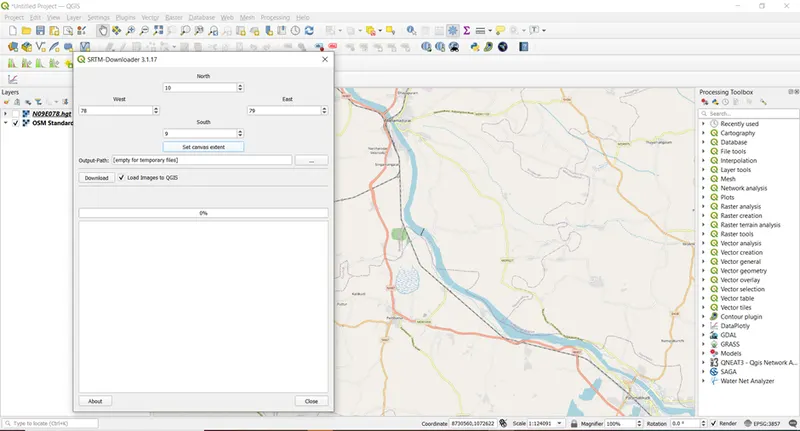
- Download the plugin SRTM Downloaded from Plugins menu
- Set the canvas in the map for which the DEM is required
- Click on Download and Login to the Earthdata to start downloading.
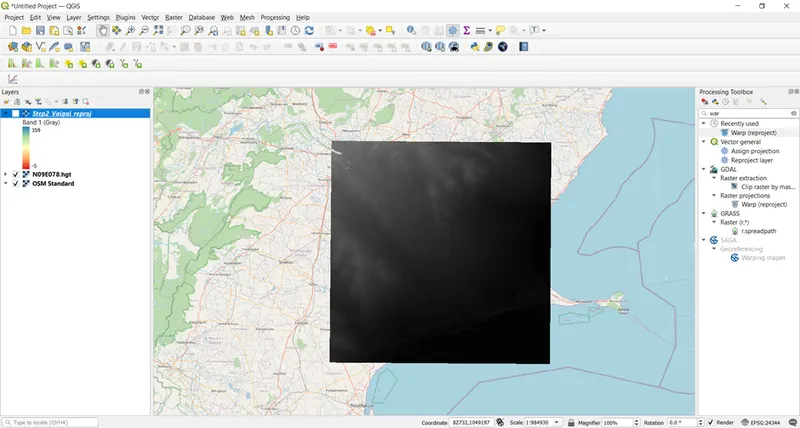
- Change the symbology if needed
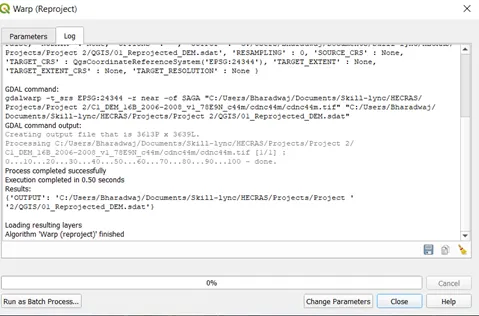
- Using Warp tool in the processing toolbox, reproject the DEM to the appropriate coordinate system
- Using QGIS, find the catchment area
- Launch QGIS
- Add the DEM and reproject it to the correct coordinate system
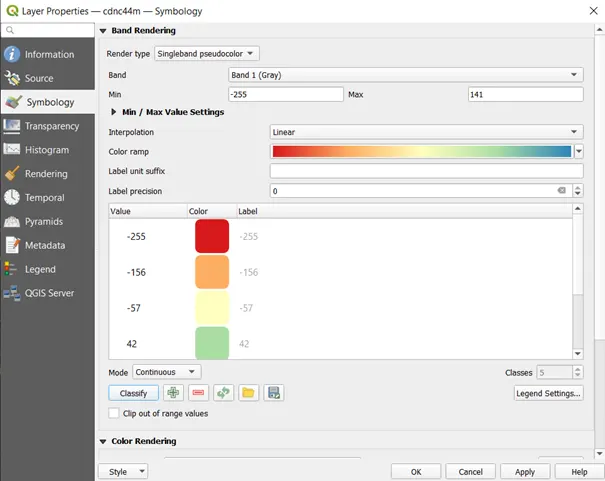
- Change the symbology of the DEM. Singleband pseudocolor is chosen as the render type
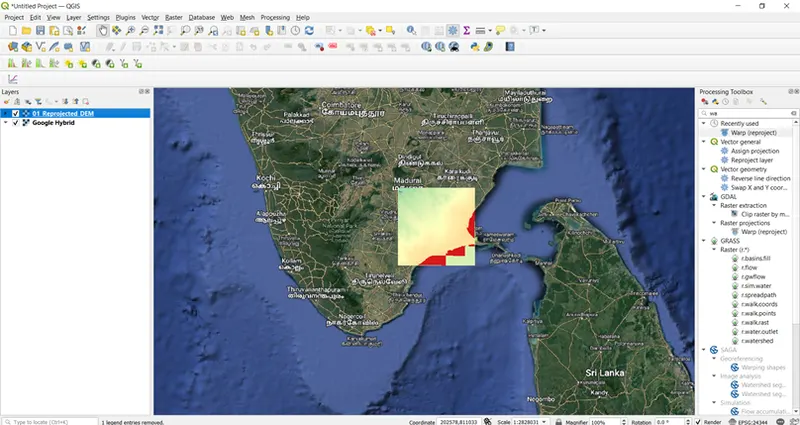
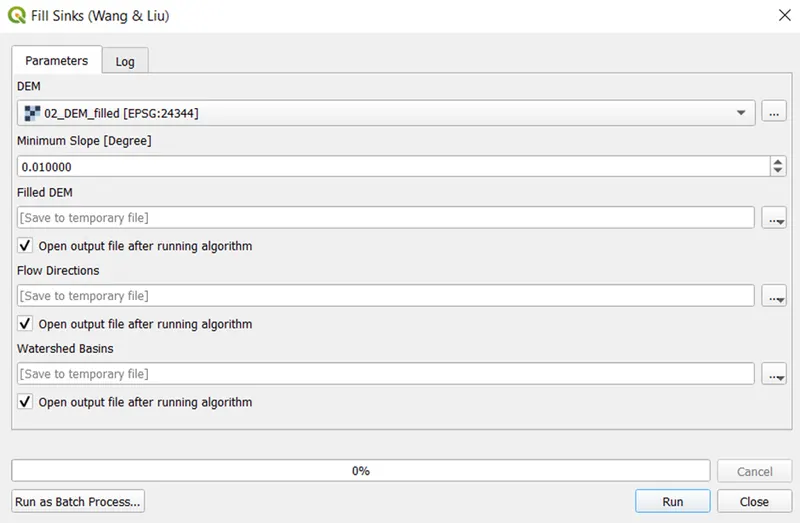
- Fill sinks using Wang and Liu method in Processing Toolbox
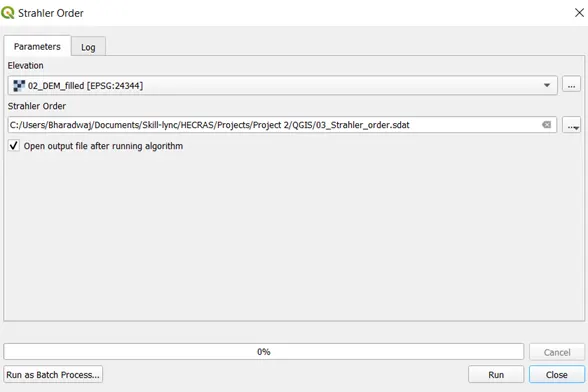
- Use the tool Strahler order to find the order of streams
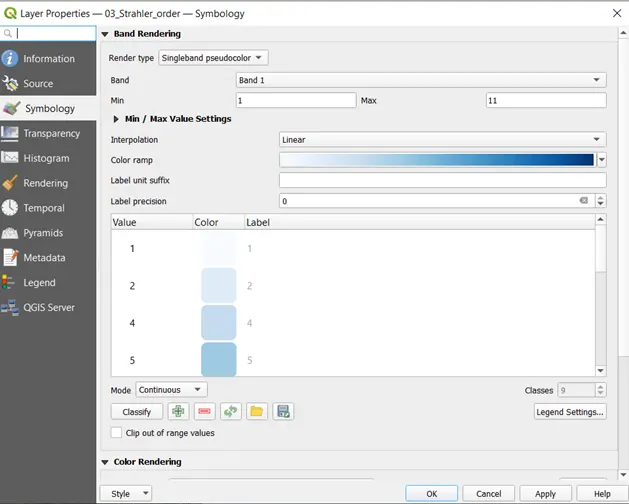
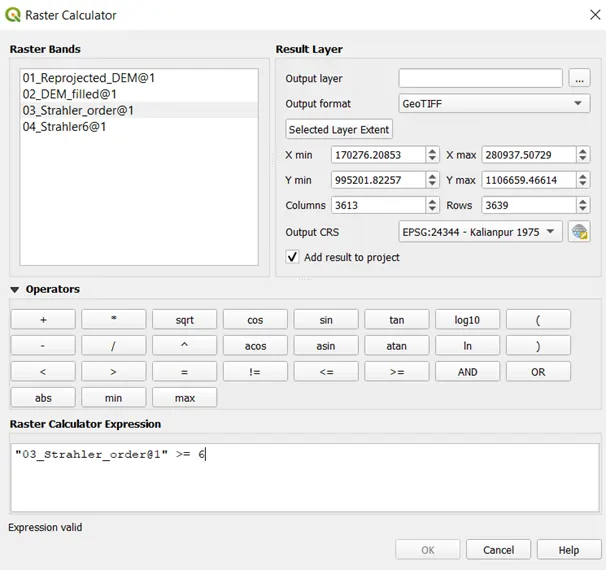
- To choose only the streams of higher orders, Strahler order more than 6 is selected by using Raster calculator from Raster menu
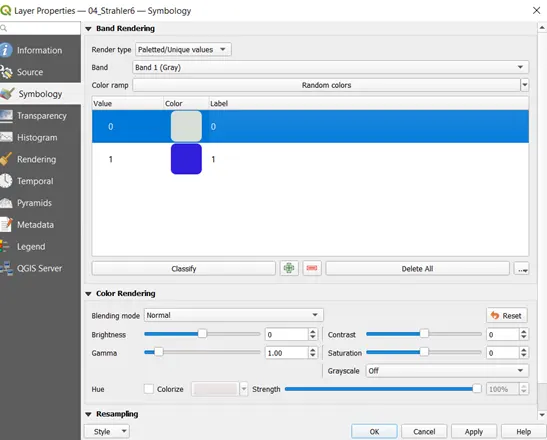
- Change the symbology of the layer generated
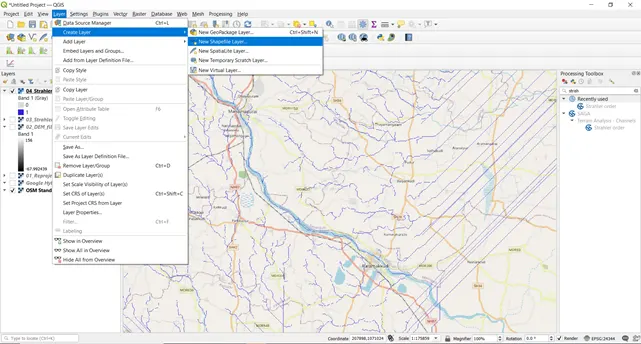
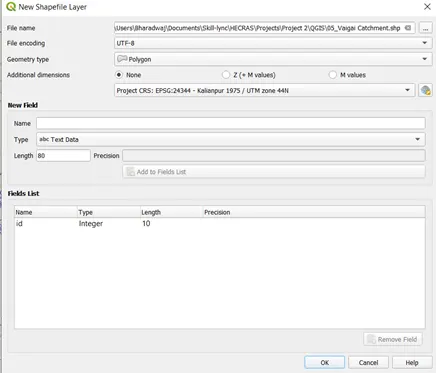
- Create a vector layer of Polygon type and start drawing the catchment area
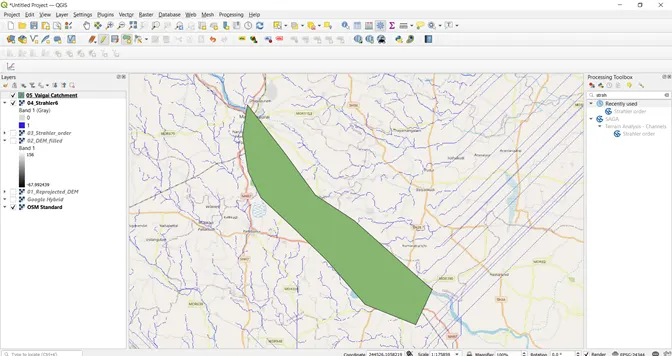
- Open the attribute table and find the area using Field calculator
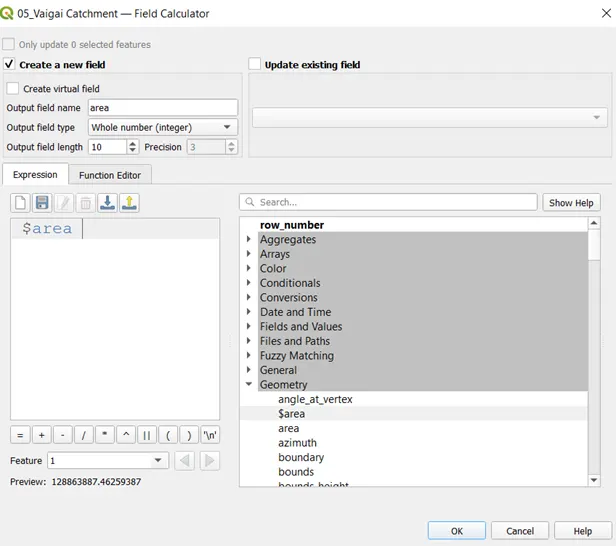
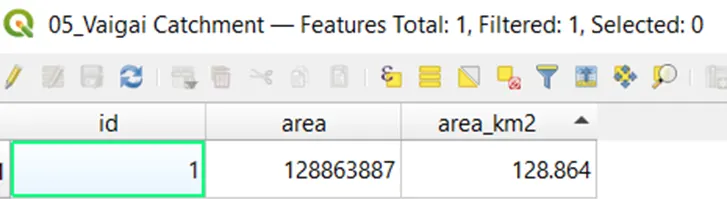
3. Using unit hydrograph , find the maximum flood discharges during 25 and 100 years
- Find the RL at various points of the taken stretch
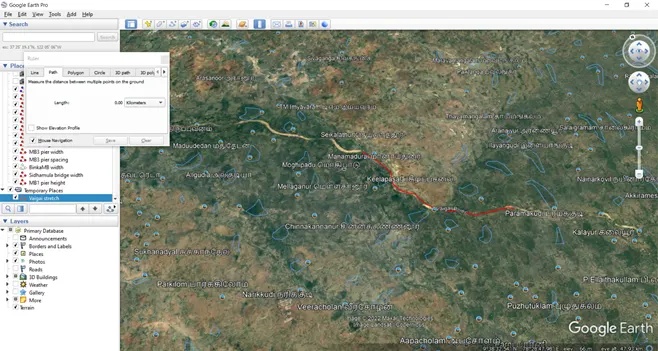
- Find the equivalent slope
- Refer to CWC’s flood estimation report (East Coast Zone 4(a),(b),(c))
- Find the SUG parameters and plot SUG
- From the 25 year isopluvial map, find average rainfall
- Find the actual point rainfall and areal rainfall by applying reduction factor and reduction coefficient
- Find 25 year rainfall excess from distribution coefficient
- Find direct runoff from graph coordinates and rainfall excess
- Find 25 year peak flood by adding direct runoff and base flow
Repeat the above procedure for finding 100 year peak flood
- Launch HECRAS and open RAS Mapper and add terrain
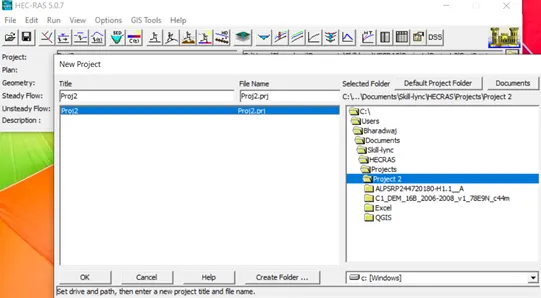
- Save Geometry data
- Open RAS Mapper by clicking on the icon
- Go to Toolsà Browse the ESRI projection file
- Go to Tools -> New terrain
- Browse the terrain and click on create
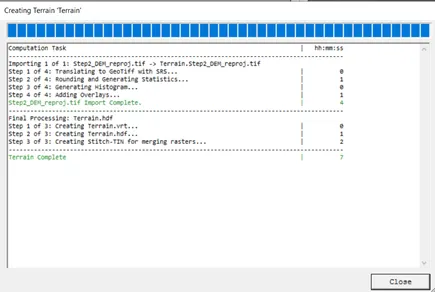
- The terrain is now added to the RAS Mapper
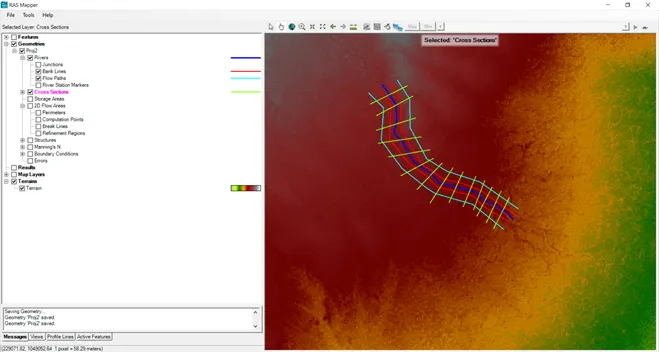
- Draw the river centerline, bank lines and flow paths for the chosen river along with the cross section
- Right click on terrain and select Image Display properties
- Check the plot contours box to view the contours and adjust the interval of contour lines to be 30
- We can also add web imagery by clicking on Map Layers -> Add Web imagery layer
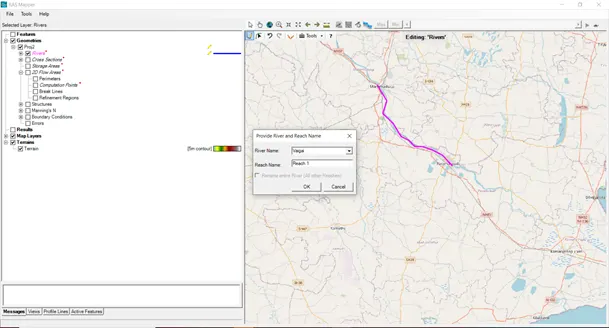
- Also draw the banklines, flowpaths and cross sections and right click to stop editing and save geometry
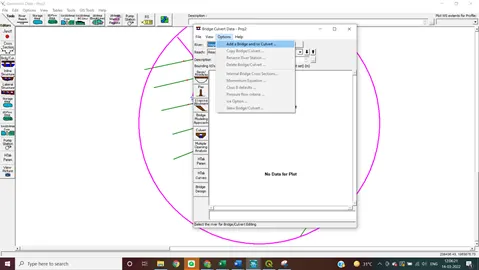
6) Add bridges, culverts and inline structures for the river stretch considered
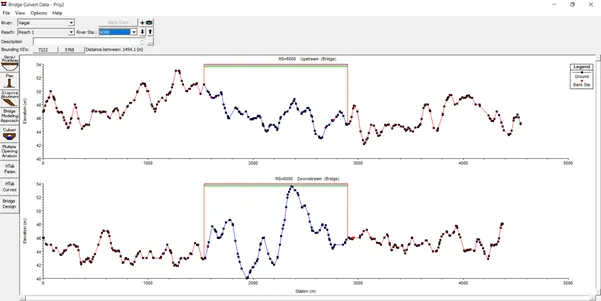
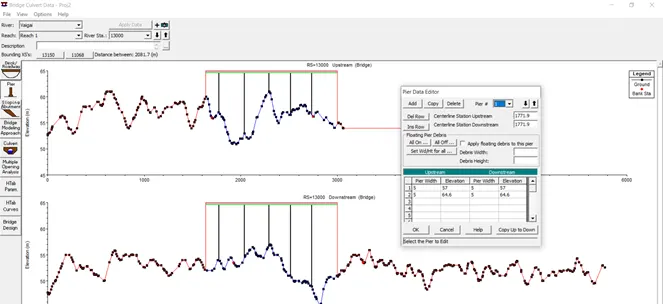
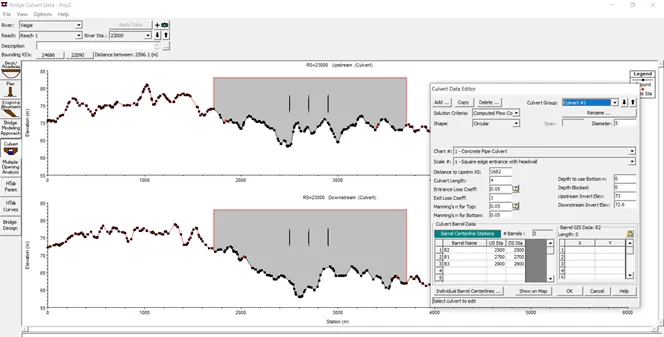
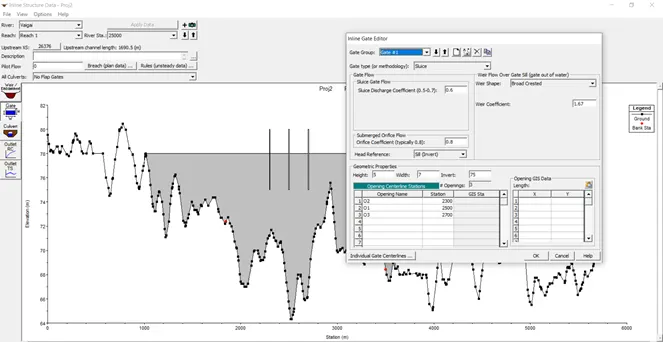
7)Steady flow analysis:
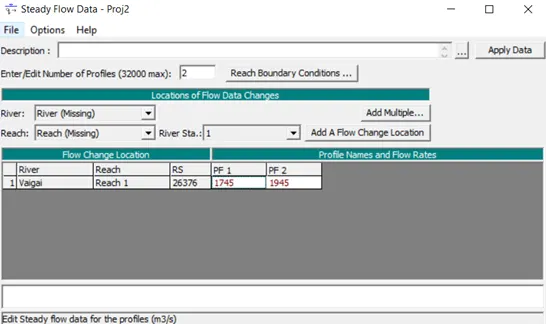
- Click on steady flow data editor
- Enter the no of profiles as 2 for 25 years and 100 years respectively
- Enter the flow data that has been calculated from the unit hydrograph
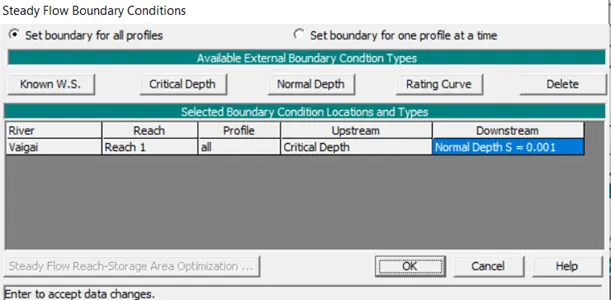
- Click on Reach Boundary conditions
- For u/s, choose critical depth as the boundary condition
- For d/s, choose normal depth as the boundary condition
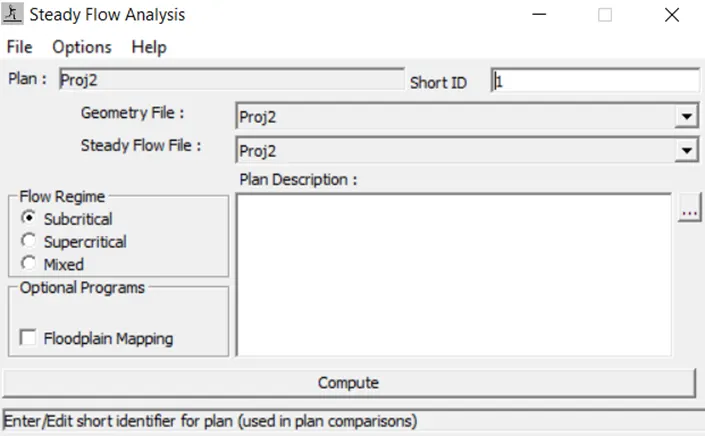
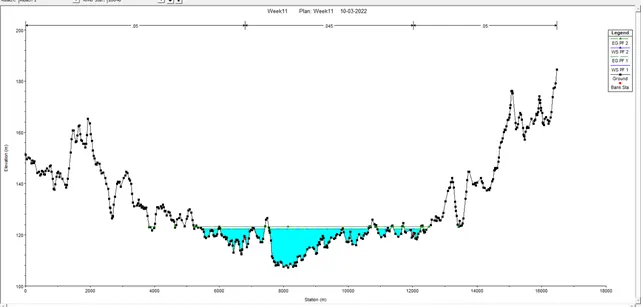
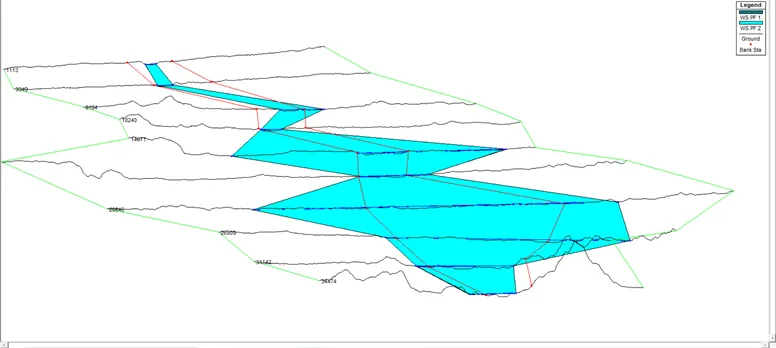
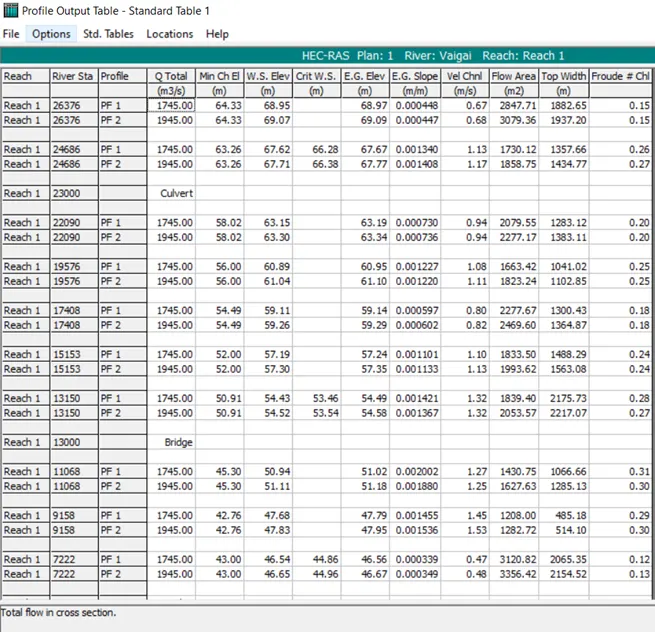
- Click on Steady flow analysis to run the steady flow program
Click on compute
8) Unsteady flow analysis:
- Click on unsteady flow editor
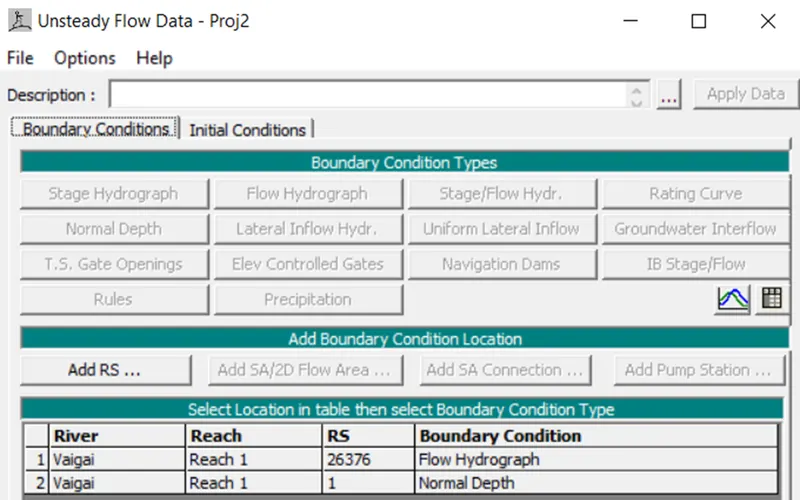
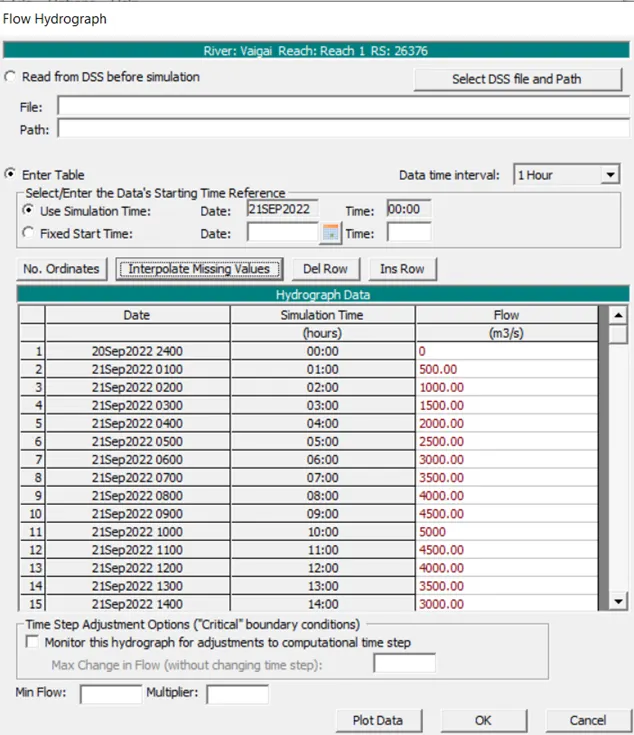
- Under boundary conditions, for u/s, choose flow hydrograph and enter the values
- For d/s, choose normal depth
- Run unsteady flow analysis by giving the simulation start and end time
- Go to RAS Mapper and view the results