Project 1
PROJECT 1
- Download toposheet from SOI Nakshe
- Convert the pdf to jpg to use in AutoCAD
AutoCAD:
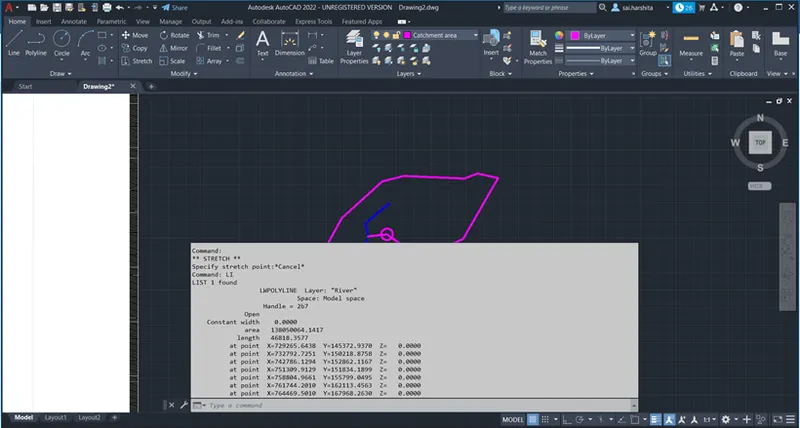
- Launch AutoCAD and go to Insert -> Attach file and attach the image
- Identify any river in the toposheet and use Polyline command to sketch it
- Use List / Properties command to check the length of the stream drawn - Ls
- Draw the catchment area of that particular stream by using Polyline command and by connecting the ridges and carefully observing the tributaries / stream joining the major river drawn.
- Use List / properties command to check the area of the catchment drawn
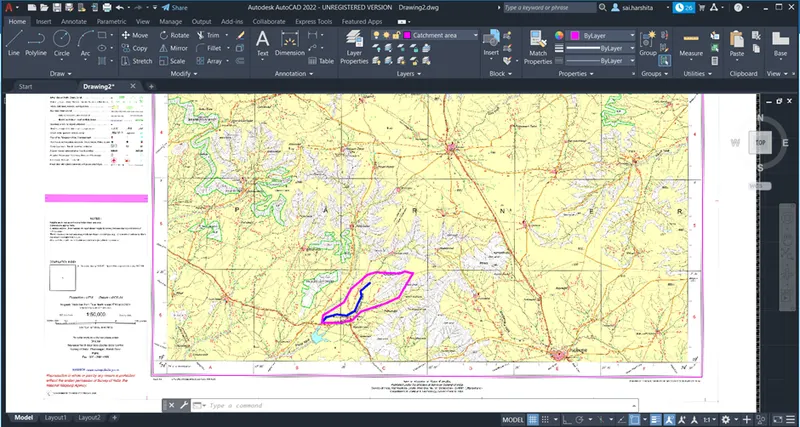
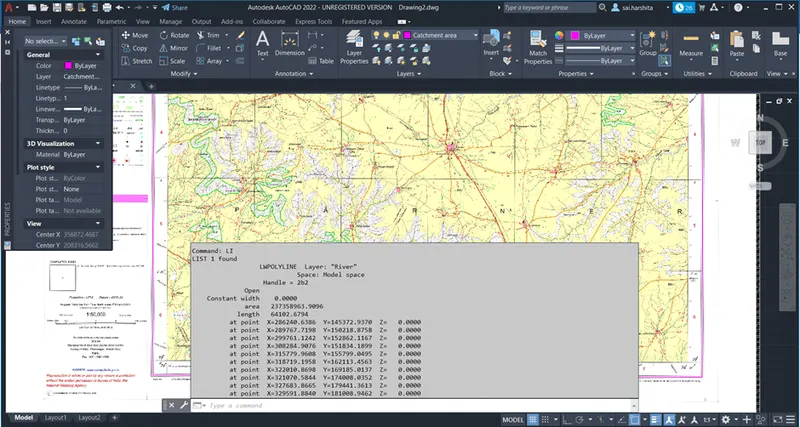
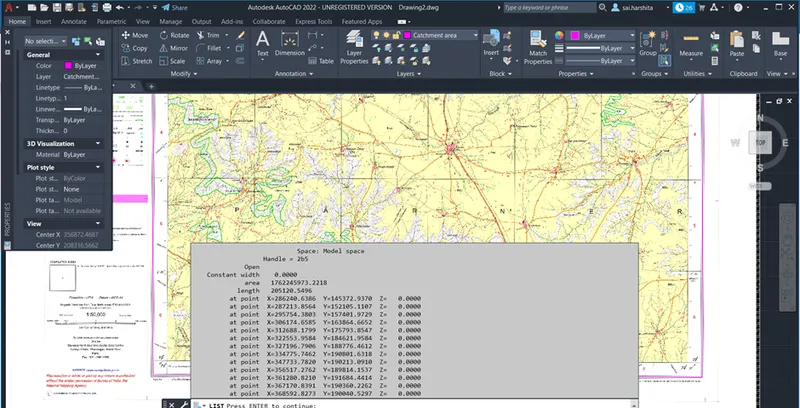
- Copy the catchment area and river
- Convert catchment area to a region by using Region command
- Find the centroid of the Catchment area region by using Massprop command
- Copy the x and y coordinate of the centroid in notepad
- Use Line command and specify first point ( x coordinate followed by a comma and y coordinate)
- That will take you to a point (centroid)
- Draw a random line from that point and draw a circle around the centroid
- Find the nearest stream where the length between the centroid and stream is minimum
- Break the line by using break command
- Using List command find the length of the upstream as Lc
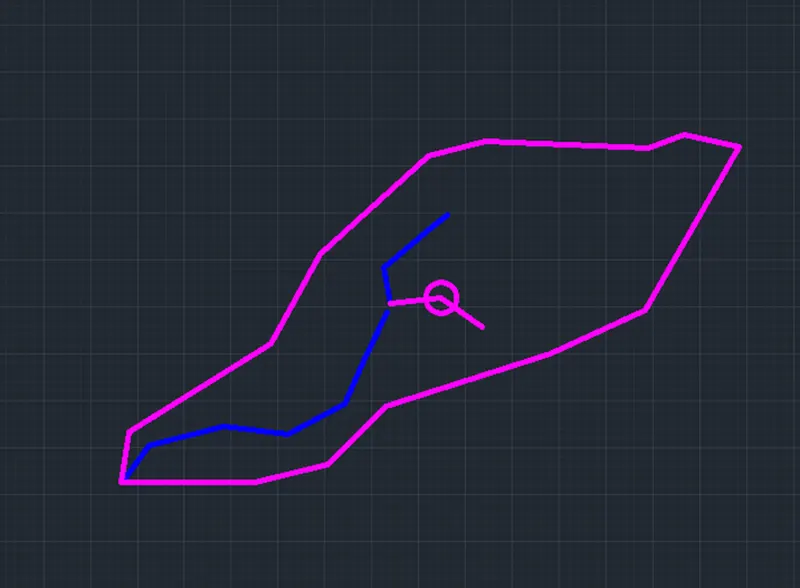
Google Earth Pro:
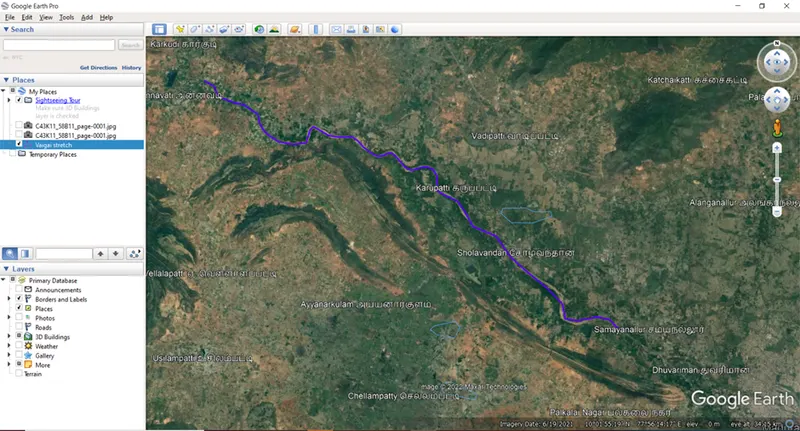
- Open Google Earth Pro
- Identify the river and go to Ruler - > Path
- Start tracing the river and save the river
- Find the RL of various points in the river
MS Excel:
- Open MS Excel and find the equivalent slope by filling in the required details
- Find the synthetic unit hydrograph coordinates (SUG) from the Central Water Commission flood estimation report of your basin
- From the isopluvial map for 25 years, find the average rainfall at your river region
- Find the reduction ratio and multiply it with the average rainfall
- Find reduction coefficient from the catchment area and find the areal rainfall
- Find the rainfall excess by identifying distribution coefficient
- Find the runoff by multiplying graph coordinates with the rainfall excess
- Final discharge = Direct runoff + Base flow
- Repeat the same for 100 years peak flow determination
HECRAS:
- Launch HECRAS
- File -> New Project. Enter the name of the new project and set the default project folder
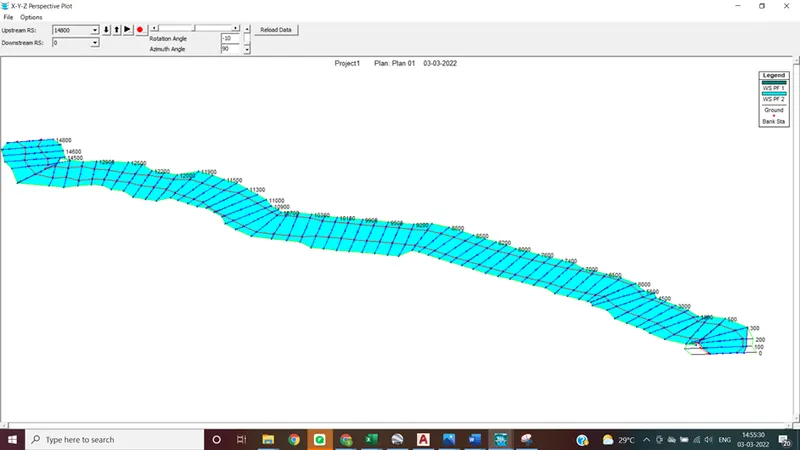
- Click on geometry data editor and draw river reach.
- Go to Geometric editor-> Cross sections
- Options - > Add a new cross section
- Enter the chainage length in the box provided and click OK. Observe the given value under river stations box
- Enter the station and elevation details and reach lengths
- Enter the Manning’s n values
- Enter the bank details of the main channel
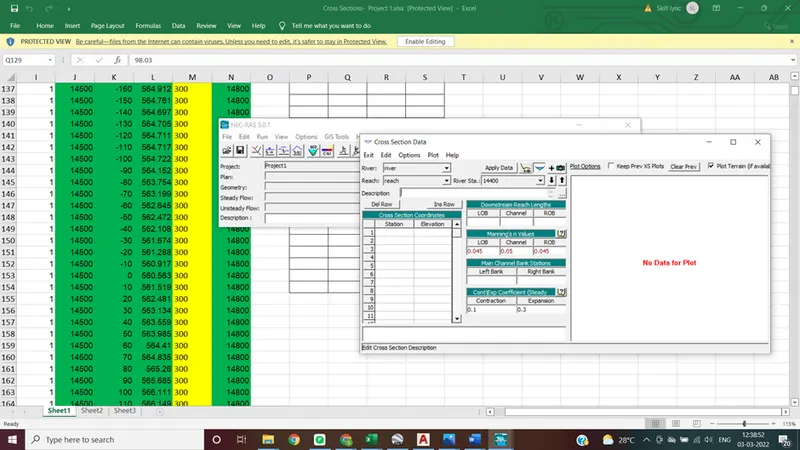
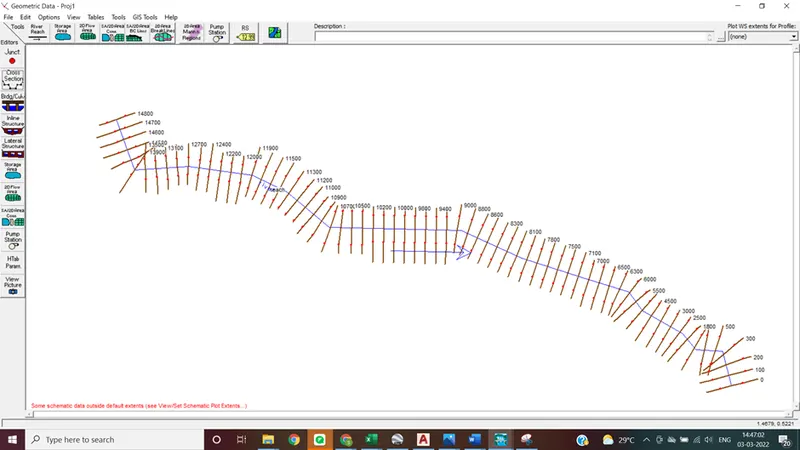
.
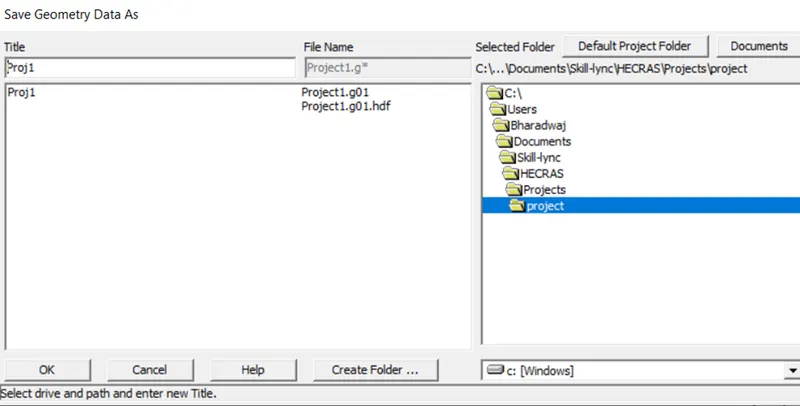
Save Geometry data by clicking File -> Save Geometry Data
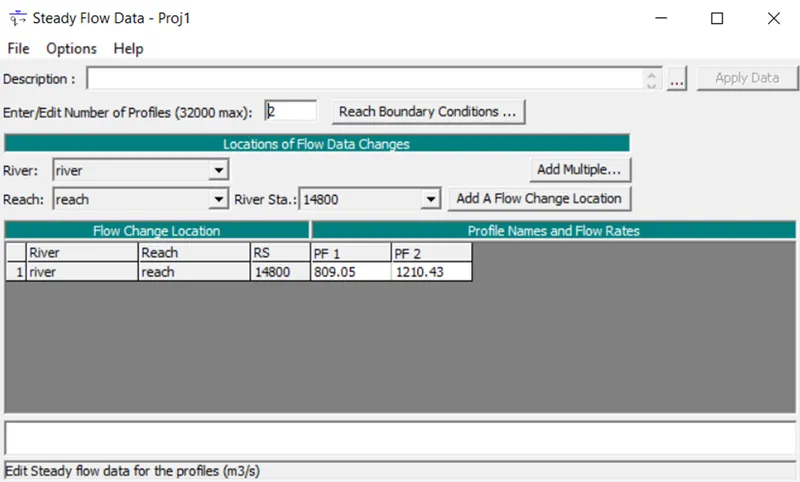
- Enter steady flow details by clicking on steady flow data icon
- Enter the number of profiles as 2
- Enter 25 year and 100 year peak flows under PF1 and PF2 respectively
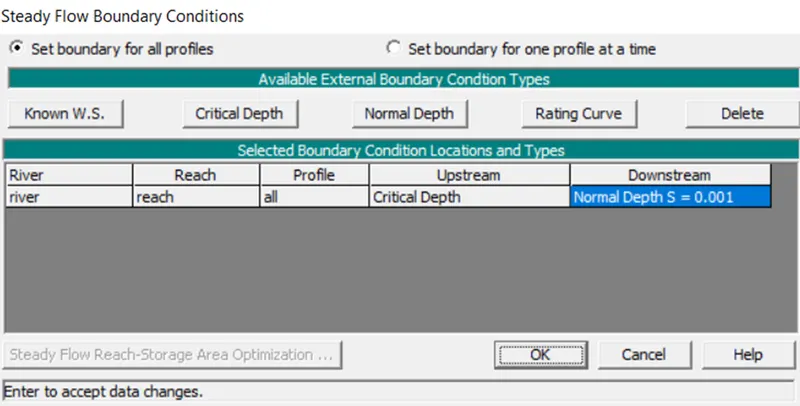
- Click on Reach boundary conditions and enter upstream boundary condition as Critical depth and downstream boundary condition as normal depth by entering slope
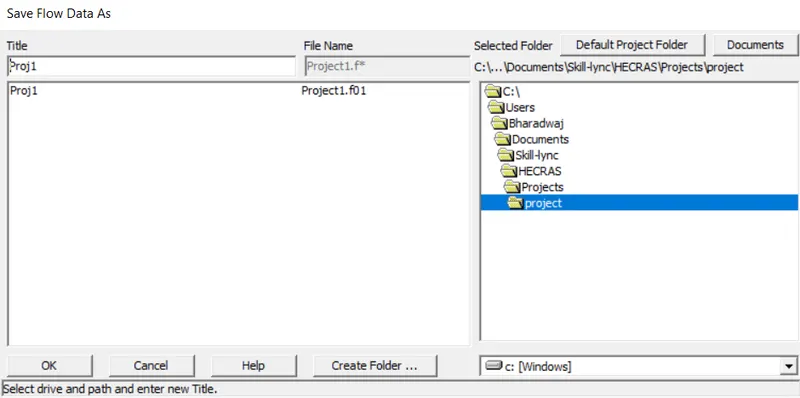
- Save Flow data
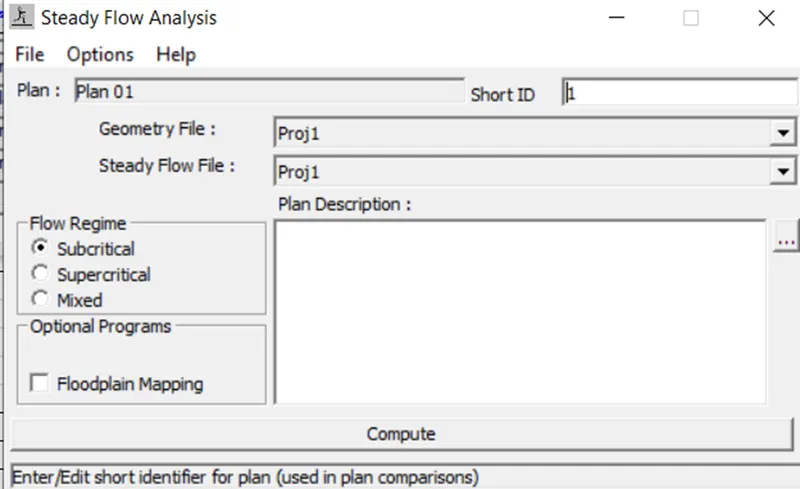
- Run steady flow analysis by clicking on compute
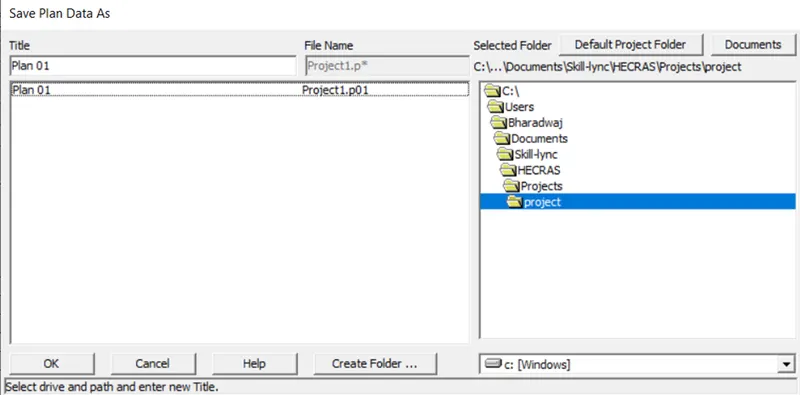
- File-> Save Plan Data
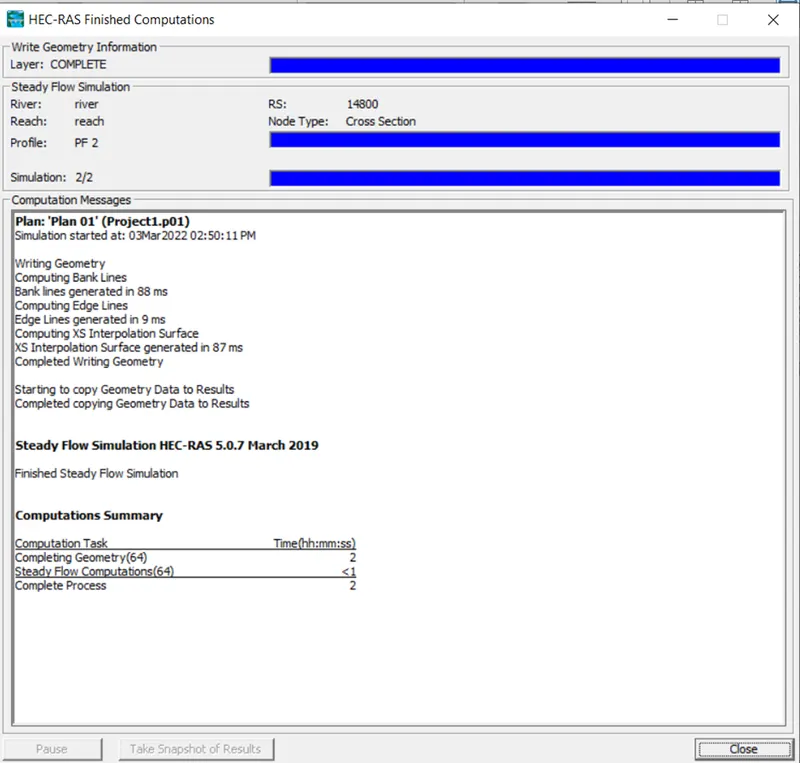
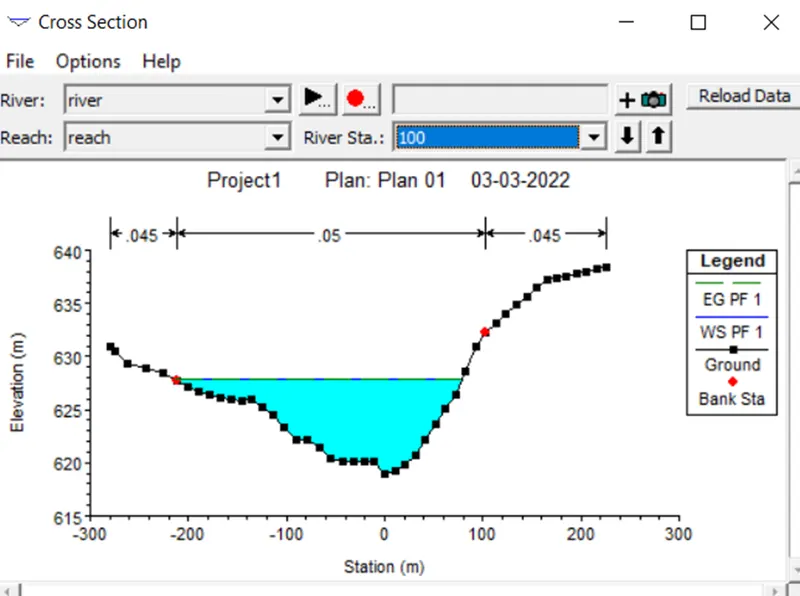
- Click on cross sections and view the water depths due to peak flows
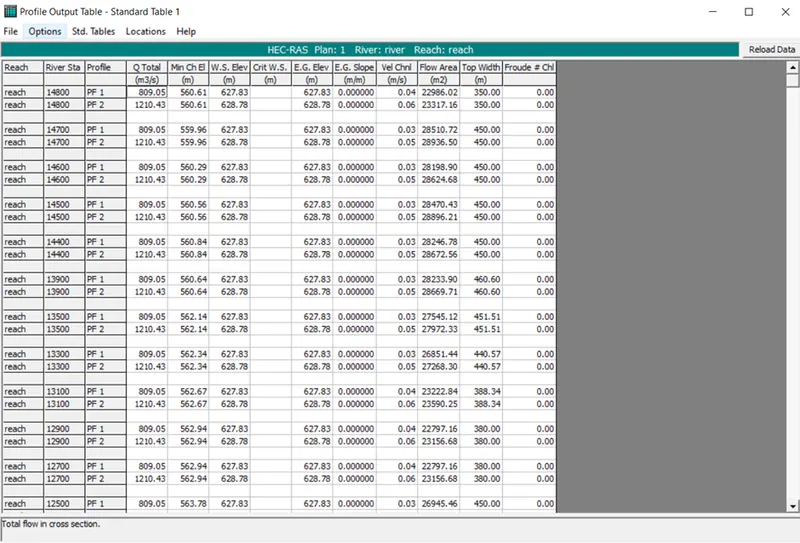
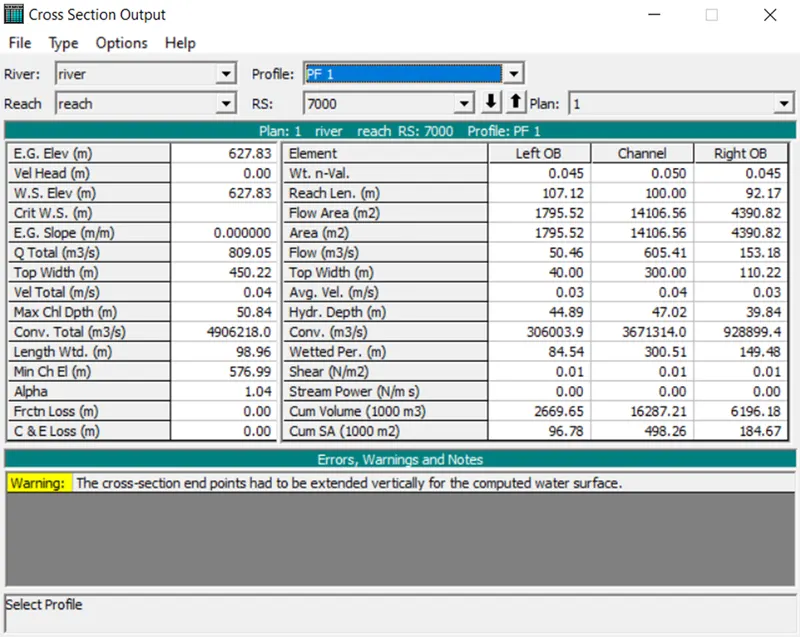
- Also click and view the Profile output and cross section output tables