Project 2
Aim
Development of a forward energy-based fuel consumption model of a P1 hybrid vehicle.
Objectives
To quantify the improvement in fuel economy numbers for the hybrid vehicle (kmpl), compared to the conventional vehicle, on the urban cycle (UDDS) and highway cycle (HWFET).
To analyze and understand the vehicle operating points in terms of engine and motor speed, torque, transmission speeds, pedal positions, gear, distance traveled, battery voltage, current, SoC etc .
Describing the vehicle behavior throughout the drive cycle.
Forward energy-based fuel consumption model of a P1 hybrid vehicle
A forward energy-based fuel consumption model of a P1 hybrid vehicle is a mathematical model that can be used to predict the fuel consumption of the vehicle based on its current state and the driving cycle that it is following. The model takes into account the energy consumption of the engine, the electric motor, and the battery, as well as the vehicle's aerodynamic drag, rolling resistance, and grade resistance.
The model is typically implemented as a computer simulation, and it can be used to evaluate the performance of different hybrid vehicle control strategies, as well as to optimize the design of hybrid vehicles.
The following are the main components of a forward energy-based fuel consumption model of a P1 hybrid vehicle:
- Engine model: The engine model predicts the fuel consumption of the engine based on its current operating speed and torque. The model takes into account the engine's efficiency map, as well as the effects of engine auxiliaries and accessories.
- Electric motor model: The electric motor model predicts the power consumption of the electric motor based on its current operating speed and torque. The model takes into account the motor's efficiency map, as well as the effects of motor cooling and losses.
- Battery model: The battery model predicts the state of charge (SOC) of the battery based on the current power flow into or out of the battery. The model takes into account the battery's internal resistance, as well as the effects of temperature and SOC on battery efficiency.
- Vehicle dynamics model: The vehicle dynamics model predicts the vehicle's speed and acceleration based on the engine torque, the electric motor torque, and the vehicle's aerodynamic drag, rolling resistance, and grade resistance.
Types of Hybrid Vehicles
There are three main types of hybrid vehicles:
1. Mild hybrid electric vehicles (MHEVs)
2. Full hybrid electric vehicles (HEVs)
3. Plug-in hybrid electric vehicles (PHEVs)
1. Mild hybrid electric vehicles (MHEVs)
MHEVs have a small electric motor and battery that assist the combustion engine, but cannot power the vehicle on their own. The electric motor can help to start the engine, provide additional power during acceleration, and regenerate energy during braking. This can lead to improved fuel efficiency and reduced emissions.
2 .Full hybrid electric vehicles (HEVs)
HEVs have a larger electric motor and battery that can power the vehicle on their own for short distances. This allows HEVs to operate in all-electric mode at low speeds, such as in traffic or around town. This can lead to significant fuel savings and emissions reductions.
3 . Plug-in hybrid electric vehicles (PHEVs)
Plug-in hybrid electric vehicles (PHEVs) use batteries to power an electric motor and another fuel, such as gasoline, to power an internal combustion engine (ICE). PHEV batteries can be charged using a wall outlet or charging equipment, by the ICE, or through regenerative braking. The vehicle typically runs on electric power until the battery is nearly depleted, and then the car automatically switches over to use the ICE.
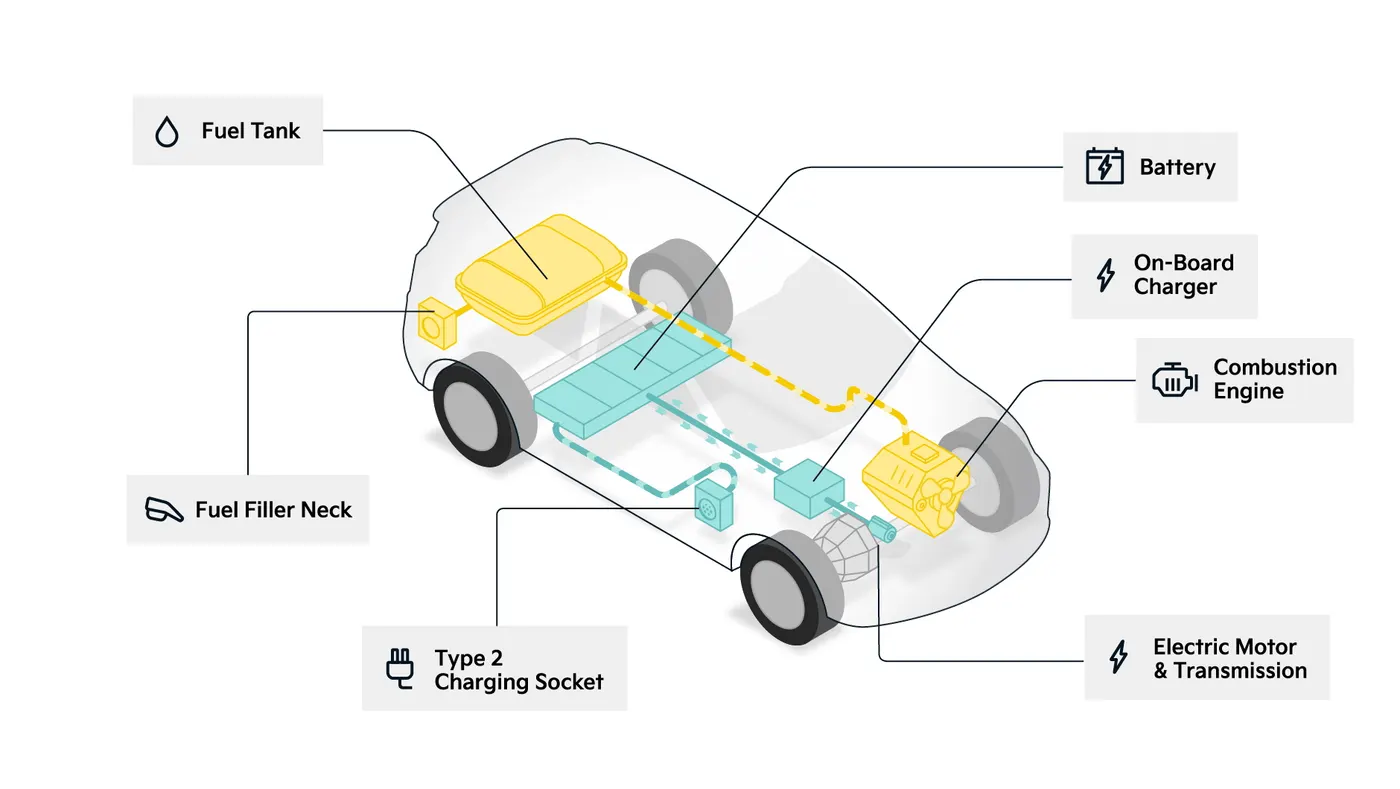
P1, P2, P3, and P4 are classifications of hybrid electric vehicles (HEVs) based on the location of the electric motor in the drivetrain.
P1 hybrid: The electric motor is mounted directly on the crankshaft of the engine. This is the simplest and most common type of HEV.
P2 hybrid: The electric motor is mounted between the engine and the transmission. This allows the electric motor to drive the wheels directly, without the need for the engine.
P3 hybrid: The electric motor is mounted on the transmission output shaft. This allows the electric motor to drive the wheels directly, even when the engine is not running.
P4 hybrid: The electric motor is mounted on the rear axle. This allows the vehicle to have all-wheel drive, with the electric motor driving the rear wheels and the engine driving the front wheels.
| Type of hybrid | Location of electric motor | Advantages | Disadvantages |
|---|---|---|---|
| P1 | Crankshaft | Simple, affordable | Least fuel economy and performance benefits |
| P2 | Between engine and transmission | More fuel economy and performance benefits | More expensive |
| P3 | Transmission output shaft | Best fuel economy and performance benefits | Most expensive and complex |
| P4 | Rear axle | All-wheel drive, best fuel economy and performance benefits | Most expensive and complex |
Intial Matlab code
%% Vehicle Parameters
M = 1500;       % Vehicle weight [kg]
Cr = 0.015;     % Rolling resistance coefficient
Rw = 0.35;      % Rolling radius [m]
Cd = 0.33;      % Drag coefficient
Af = 2;         % Frontal area [m2]
rhoa = 1.225;   % Air density [kg/m3]
Vwind = 0;      % Wind velocity [kmph]
g = 9.81;       % Gravitational acceleration [m/s2]
theta = 0;      % Slope [deg]
myu_road_tire = 1; % Coefficient of friction between tire - road interface

%% Powertrain Parameters
FDR = 3.73;                         % Final Drive Ratio / Diff Ratio
DiffEff = 0.99;                     % Differential efficiency (assumed independent of operating conditions)

NumGear = 4;                        % Number of gears in transmission
TransGear = 1:NumGear;            % Transmission Gears
TransRatio = [3.06, 1.62, 1, 0.7];  % Corresponding Transmission ratios
TransEff = 0.90;                    % Transmission efficiency (assumed independent of operating conditions)

TC_SR = [0, .5, .6, .7, .8, .87, .92, .94, .96, .97, 1];   % Torque Converter Speed Ratio (Matlab default) -> TurbSpd/PumpSpd
TC_TR = [2.232, 1.5462, 1.4058, 1.2746, 1.1528, 1.0732, 1.0192, 1, 1, 1, 1];   % Torque Converter Torque Ratio (Matlab default) -> TurbTrq/PumpTrq
TC_Cf = 1e-4 * [.72558, .66322, .63463, .59042, .51331, .4144, .29287, .22444, .12186, .04386, 0]; % Torque Converter Capacity Factor (Matlab default) -> PumpTrq/PumpSpd^2 [Nm/rpm^2]

load Vehicle_Data/Engine_data_1_9L_Saturn_95kW
load Vehicle_Data/Trans_Shift_map
load Vehicle_Data/EM_Honda_Insight_10kW
load Vehicle_Data/ESS_NiMH6


ESS_init_soc = 0.8;
ESS_soc_max = 0.9;
ESS_soc_min = 0.6;


%% Driver Parameters
Kp = 10;                    % P gain for driver PI model
Ki = 1;                     % I gain for driver PI model
Drive_Cycle_Select = 2;     % Drive cycle selection

% Drive cycle values in m/s

if Drive_Cycle_Select == 1
    load DriveCycles/UDDS;

elseif Drive_Cycle_Select == 2
    load DriveCycles/HWFET;

elseif Drive_Cycle_Select == 3
    load DriveCycles/FTP;

elseif Drive_Cycle_Select == 4
    load DriveCycles/US06;

elseif Drive_Cycle_Select == 5
    load DriveCycles/NEDC;

elseif Drive_Cycle_Select == 6
    load DriveCycles/WLTP;

end

time_end = cyc_time(end);
vel_end = cyc_vel(end);
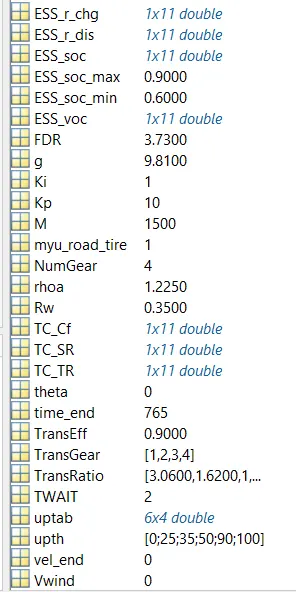
Workspace results 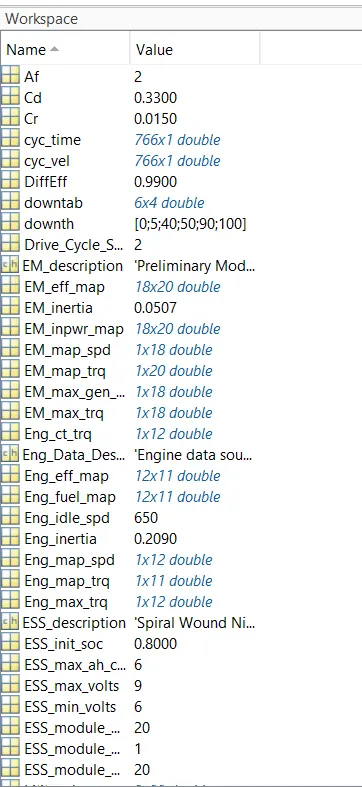
Simulink model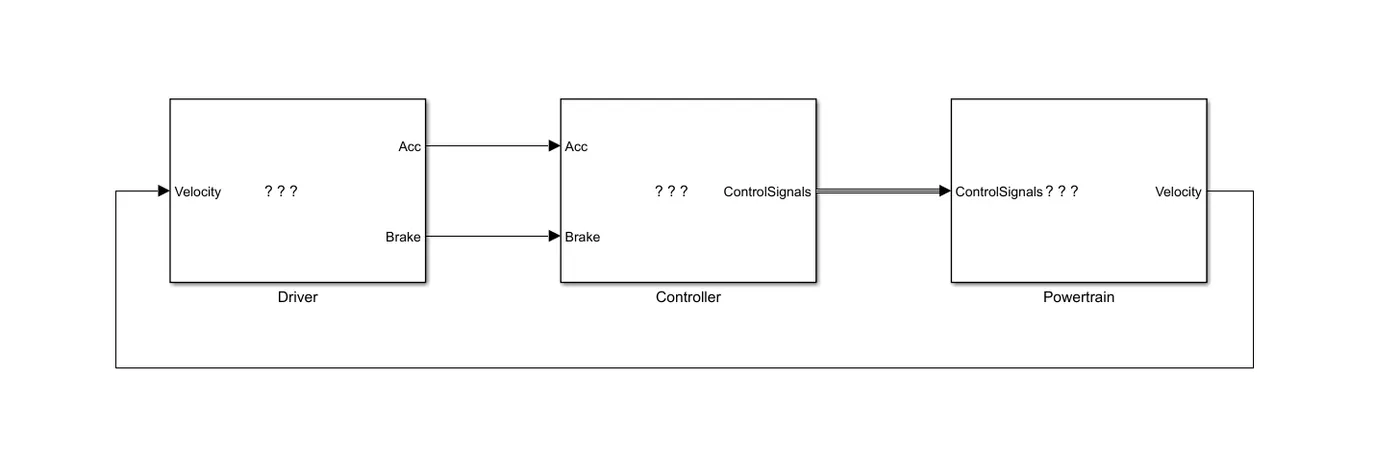
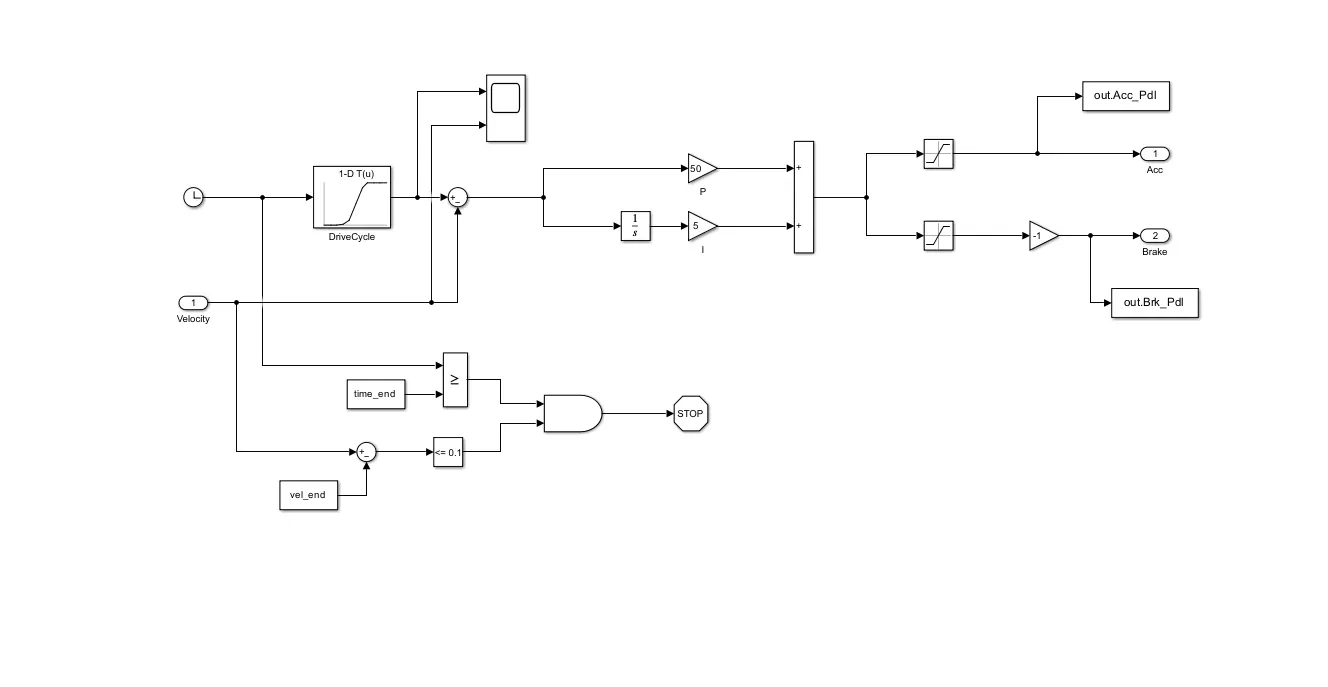
Driver Unit
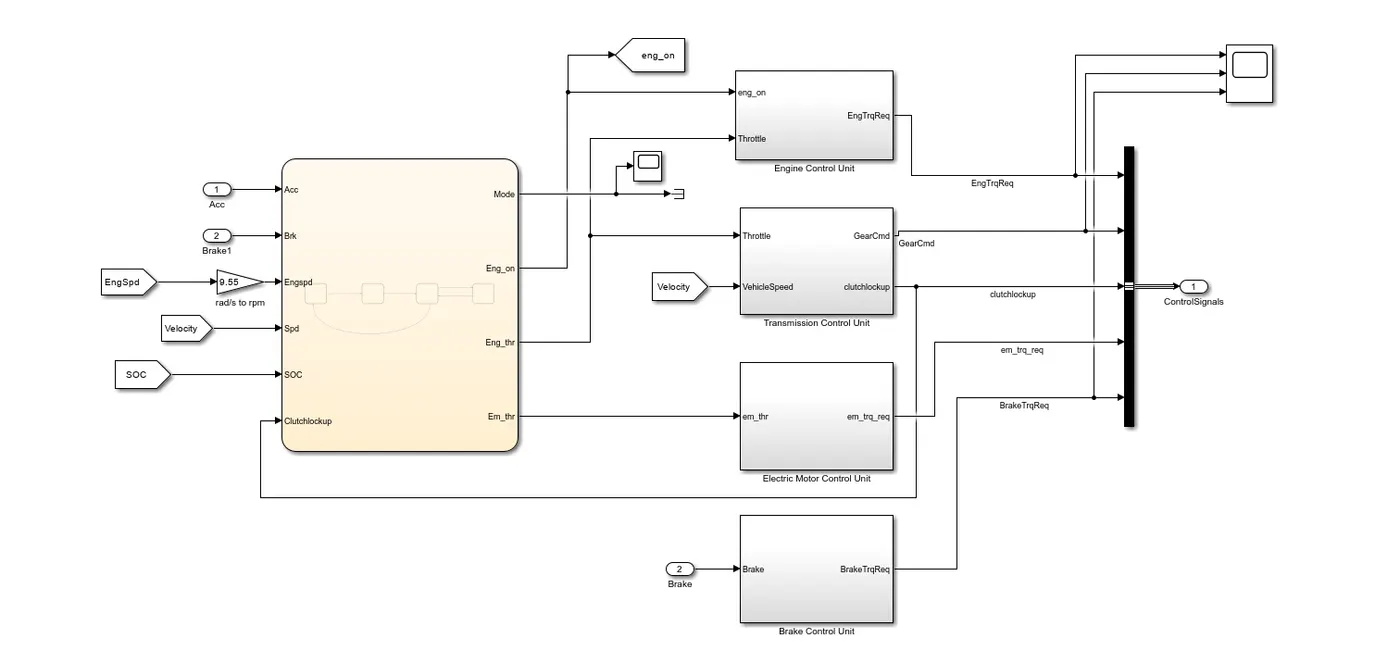
Controller Unit
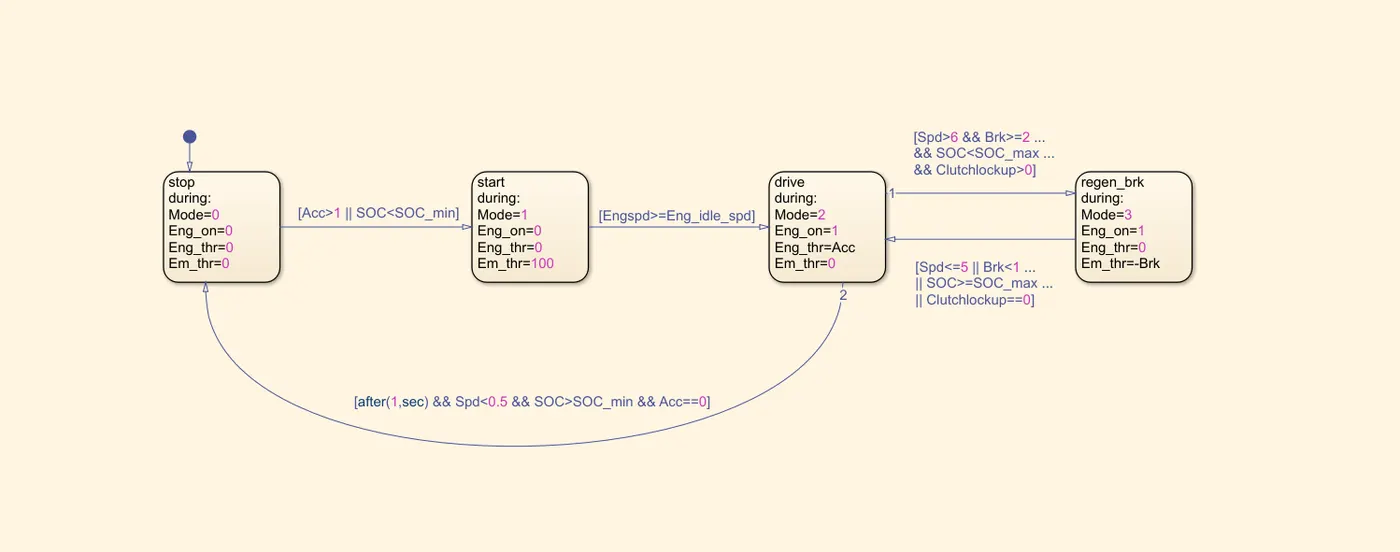
State flow chart
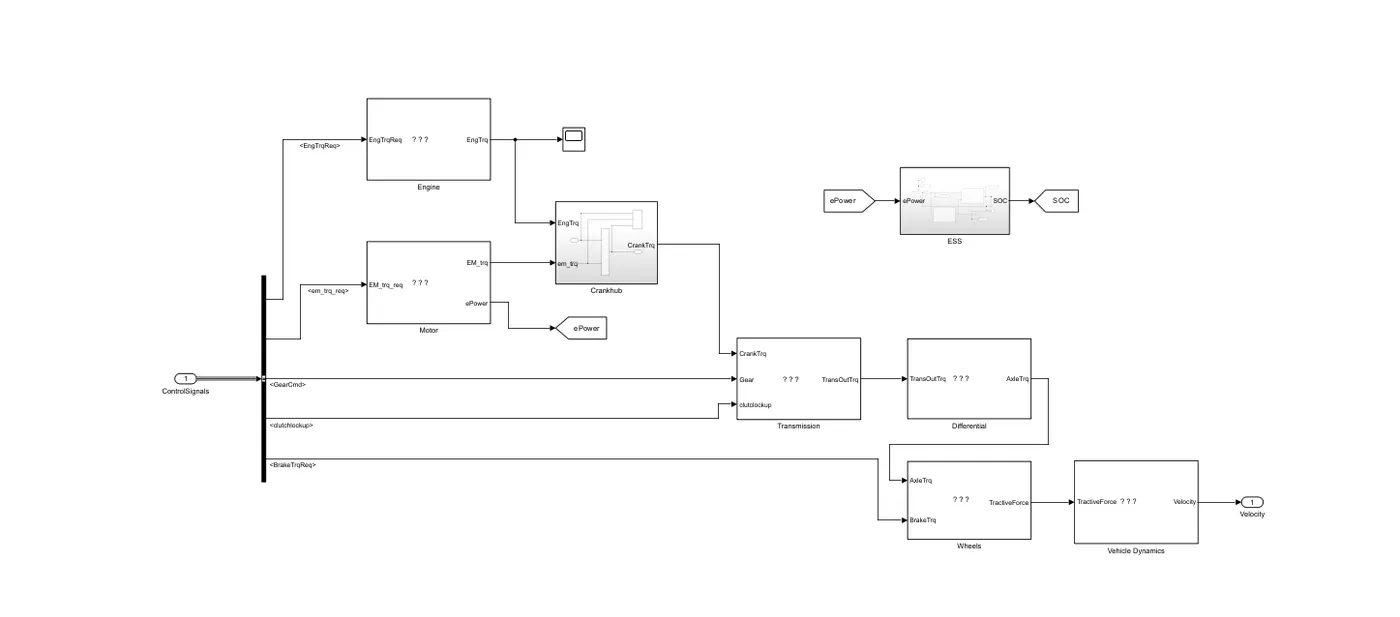
Power Train Unit
Crankhub Unit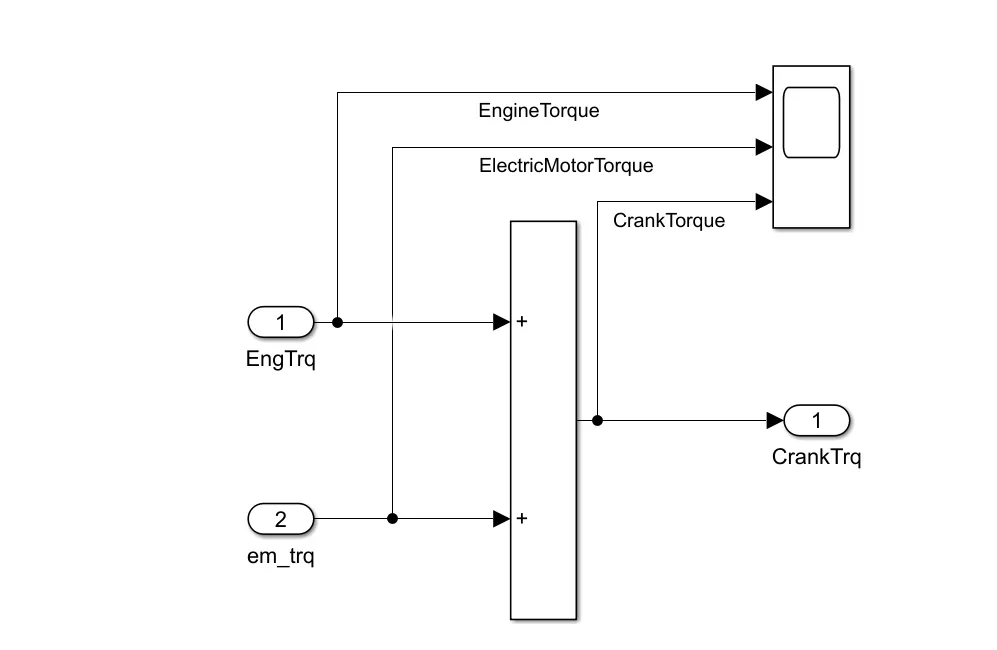
Differential Unit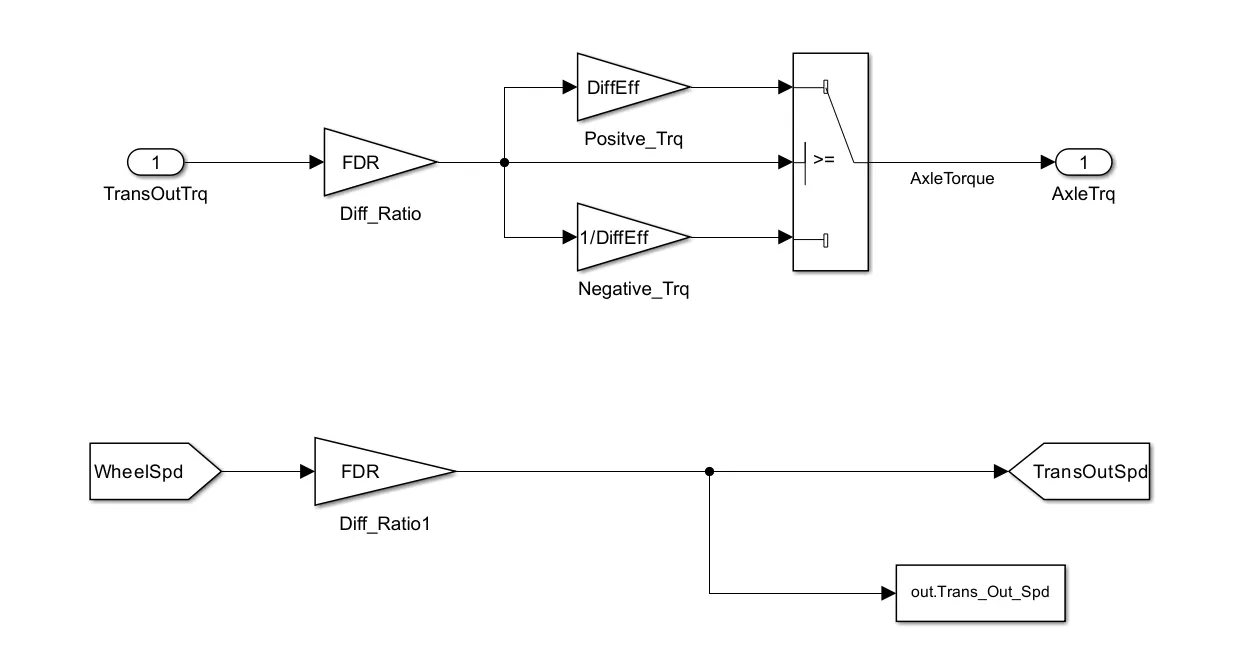
ESS Unit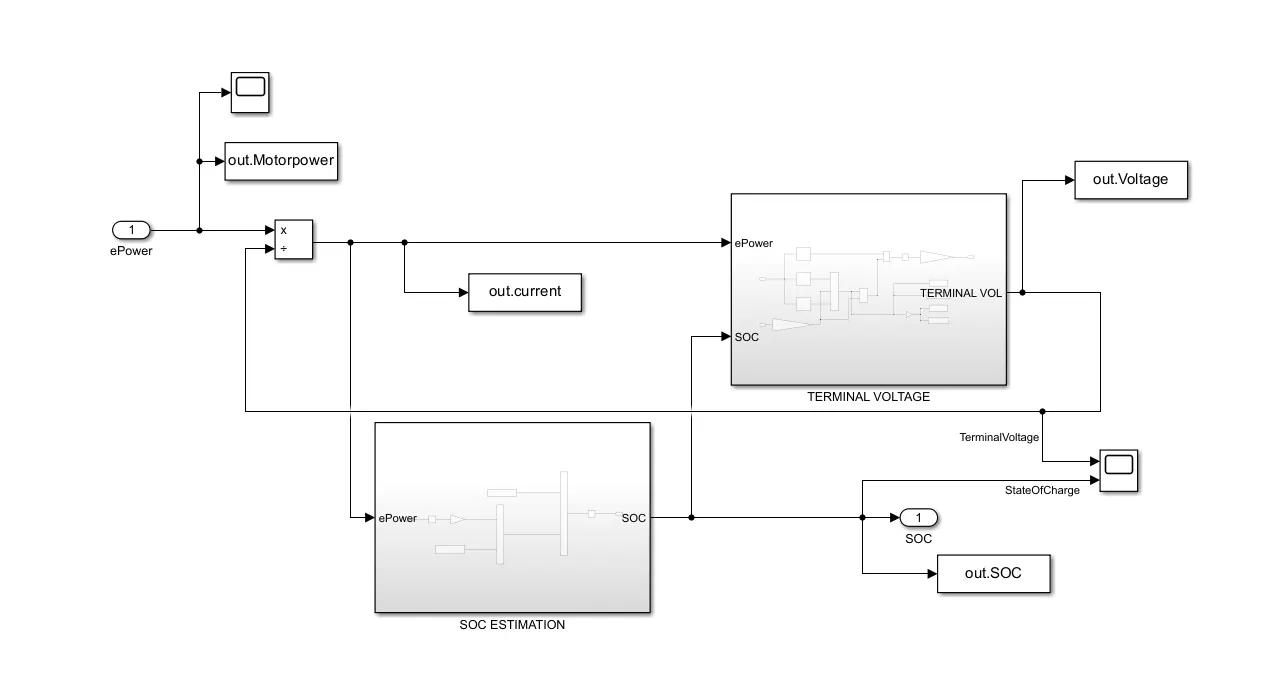
SOC Estimation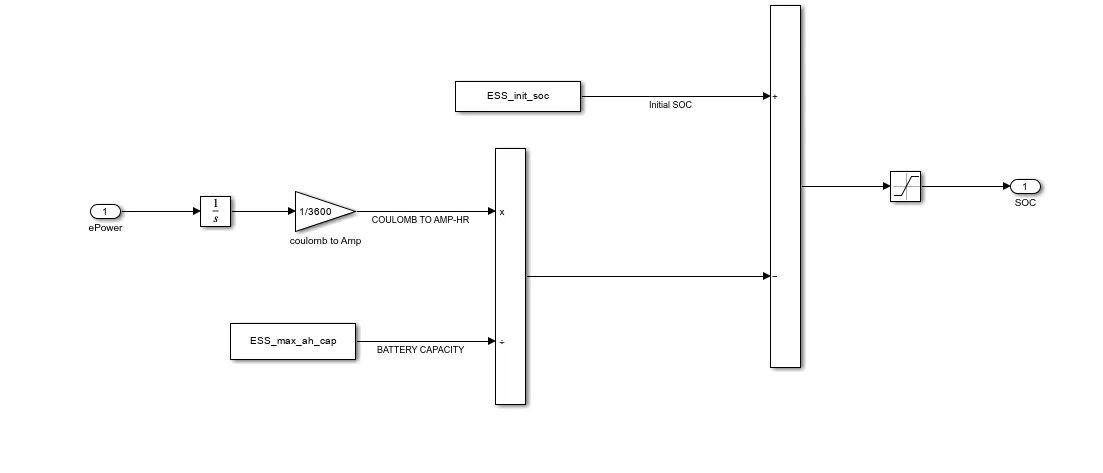
Terminal Voltage 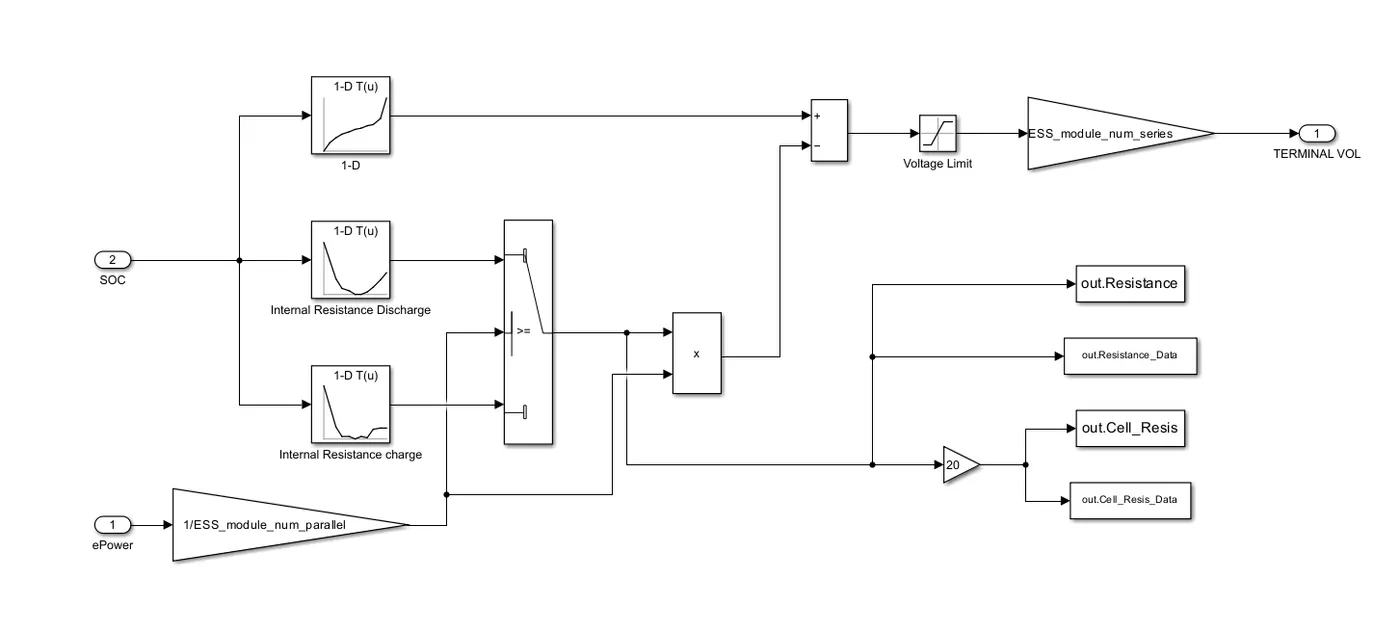
Engine 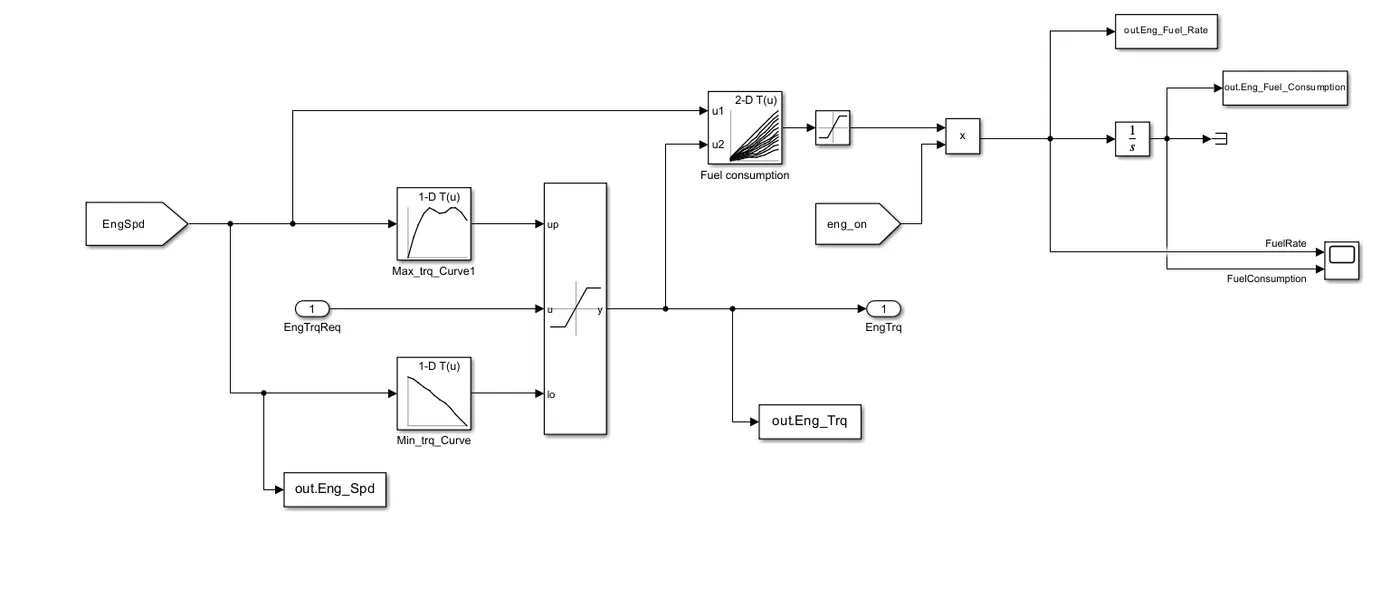
Motor 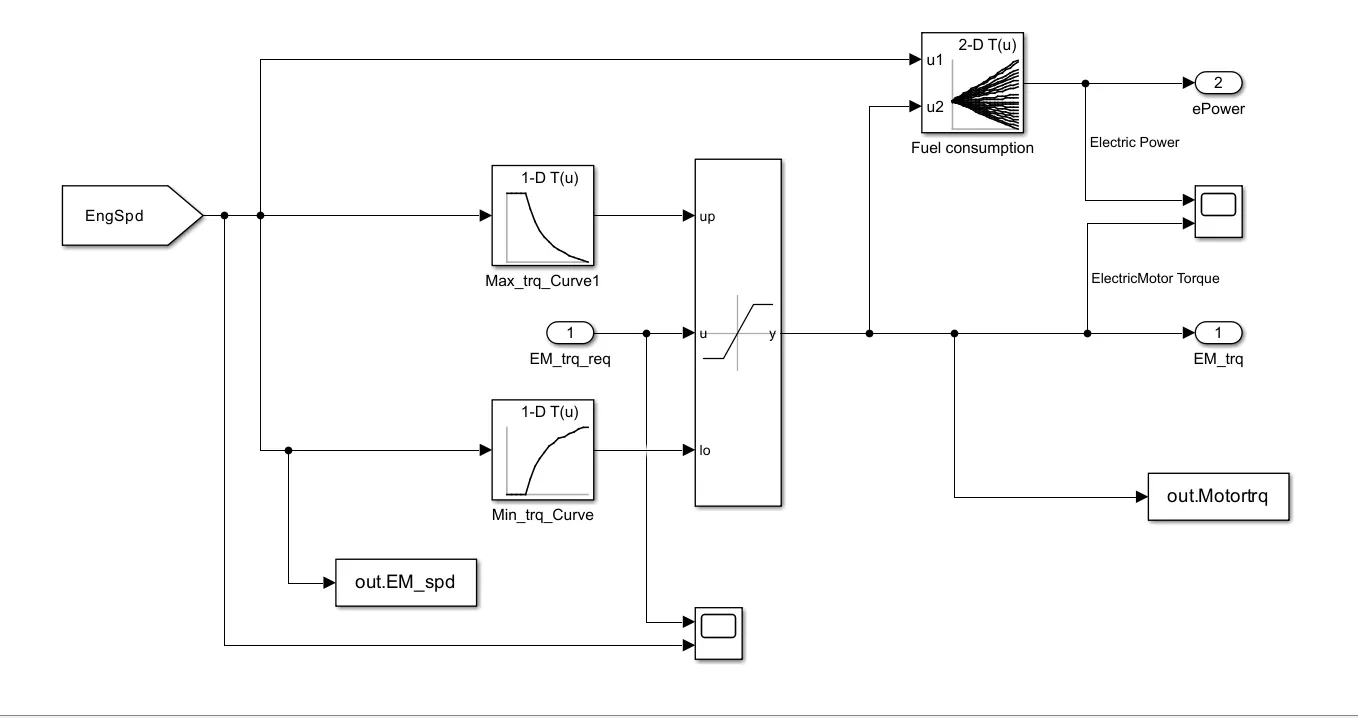
Transmission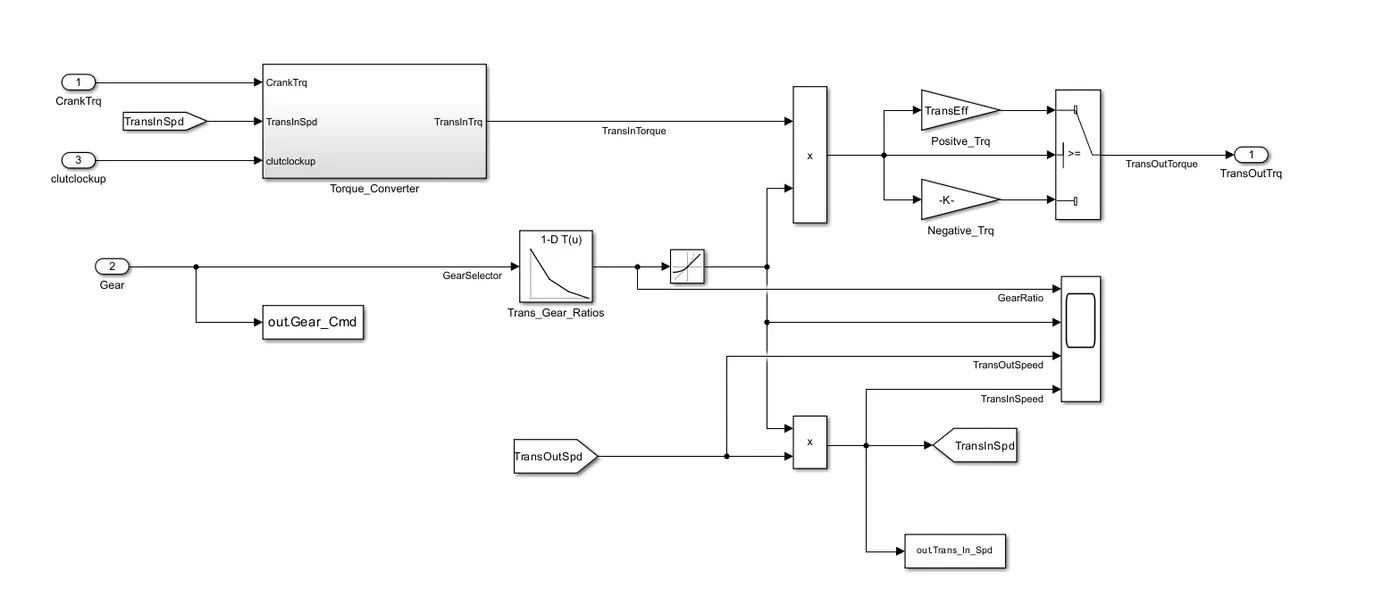
Torque Converter 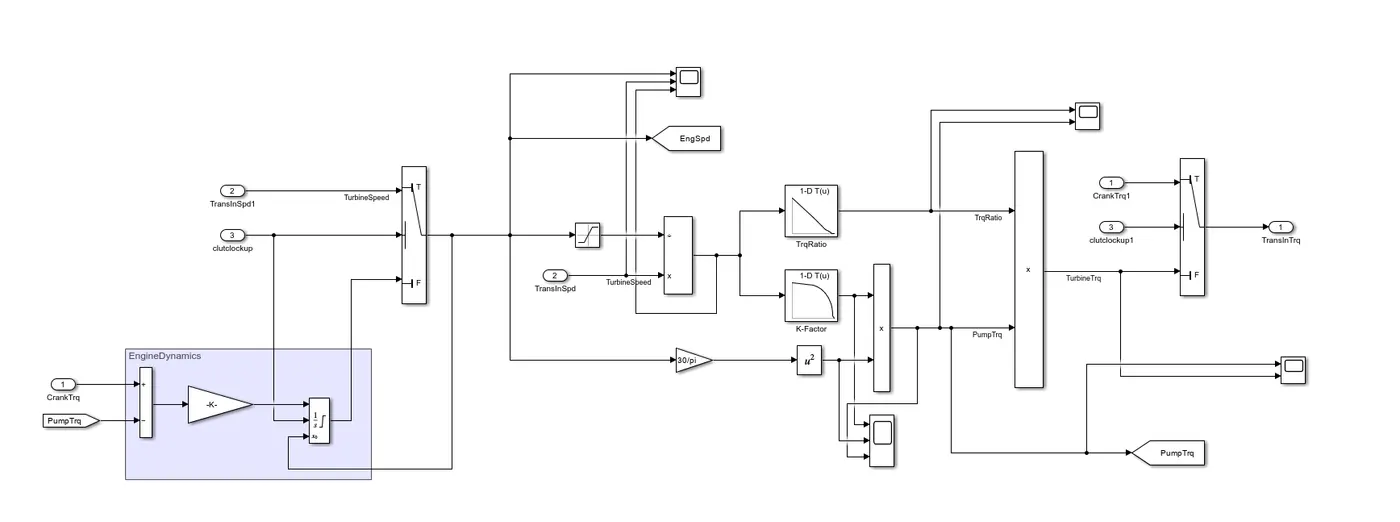
Vehicle Dynamics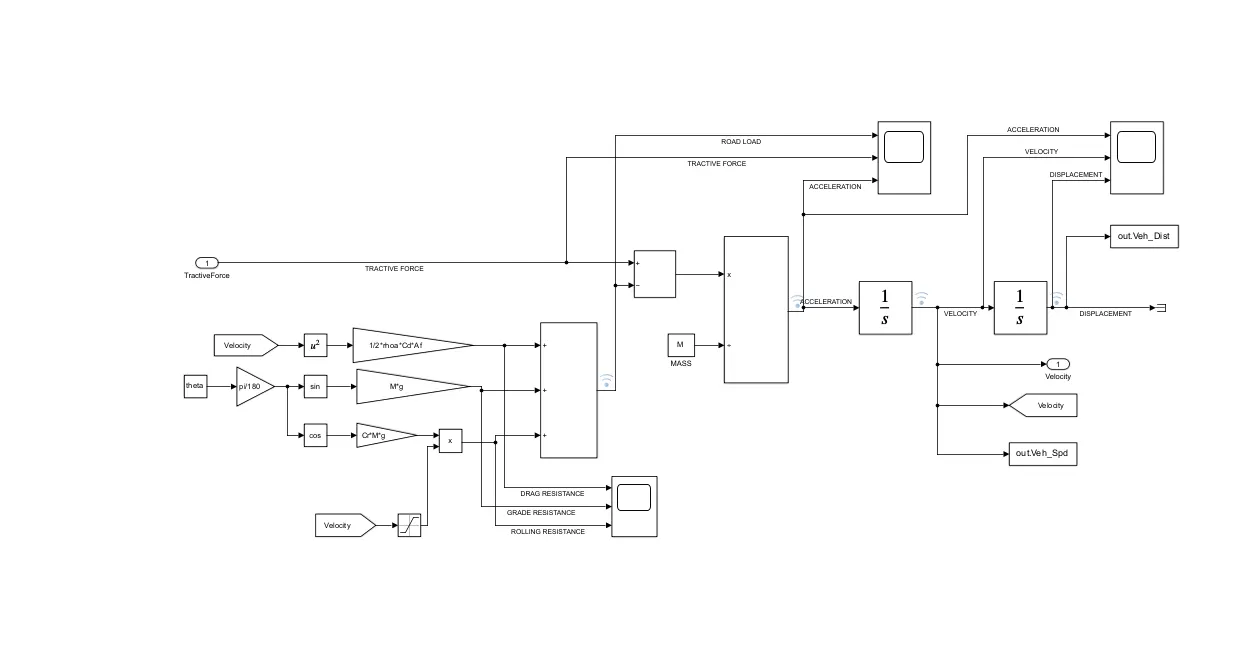
Wheels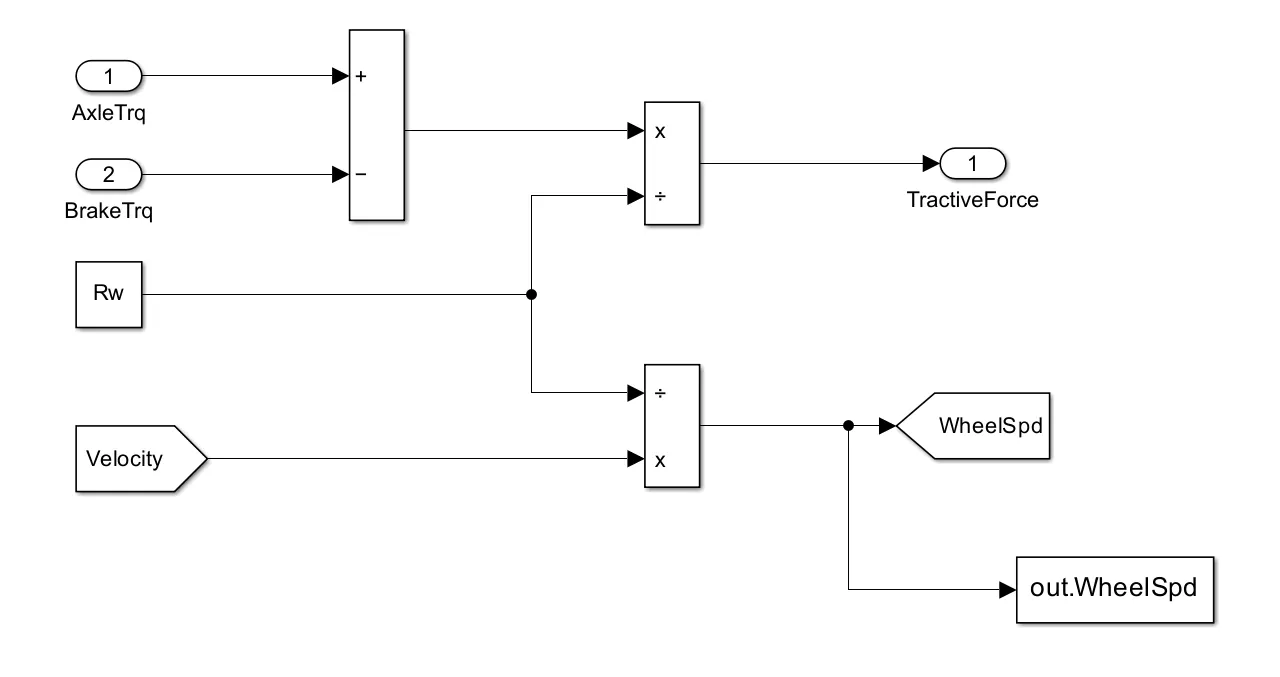
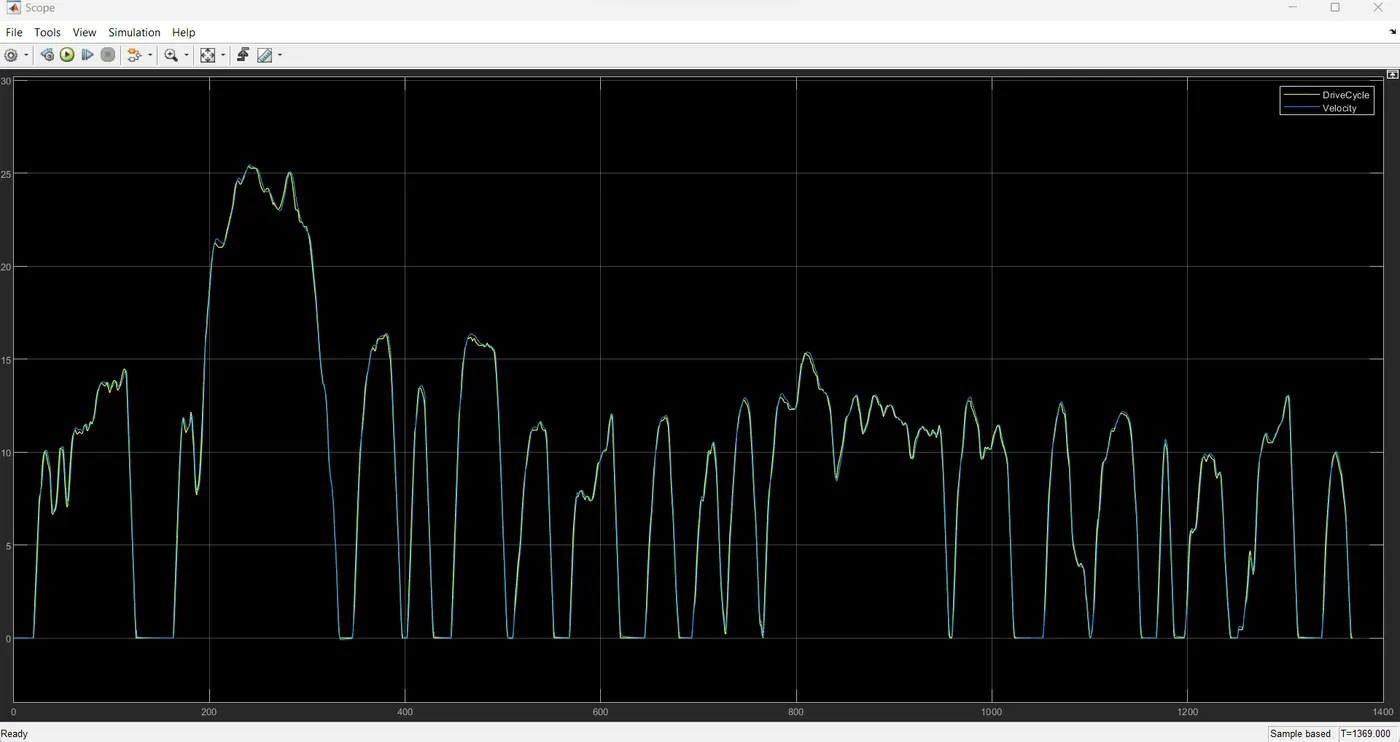
UDDS Cycle
Drive Cycle vs Velocity
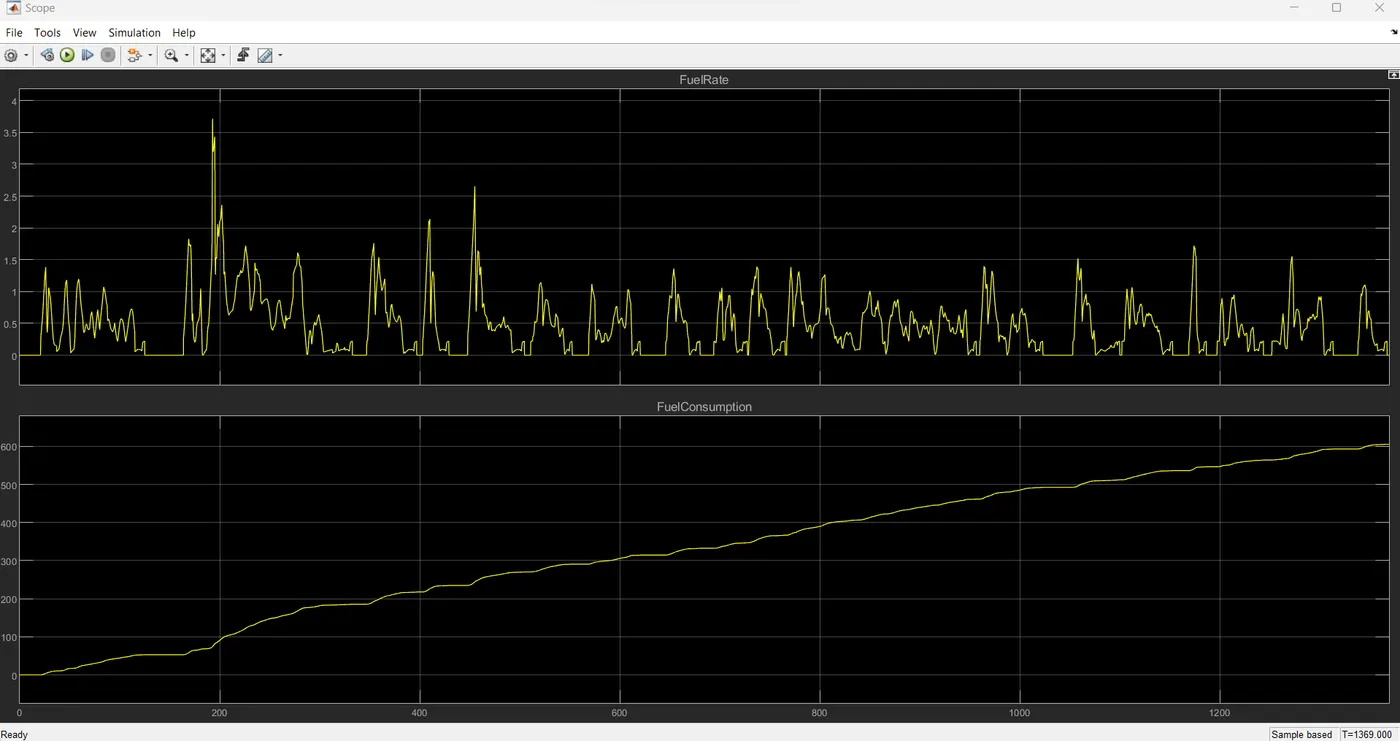
Fuel Rate , Fuel Consumption
Engine Torque , Brake Torque 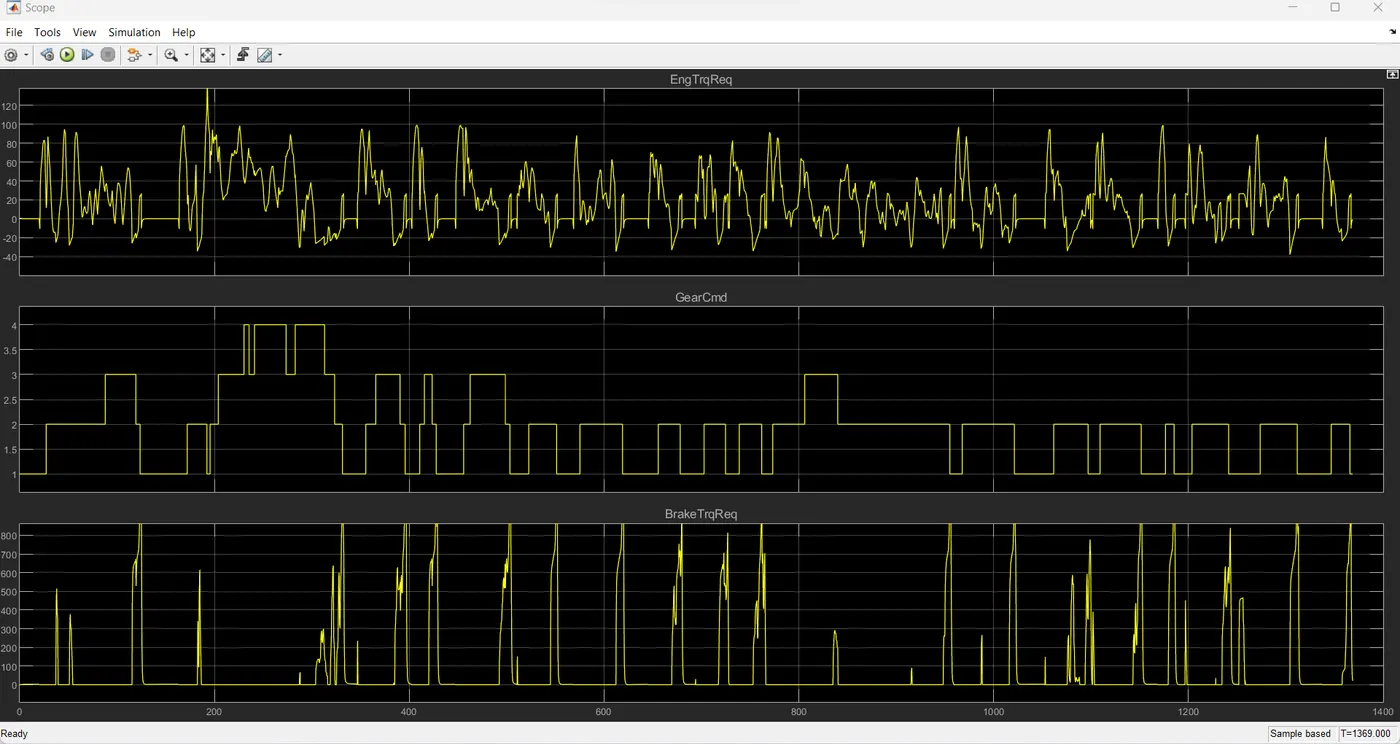
Engine Torque 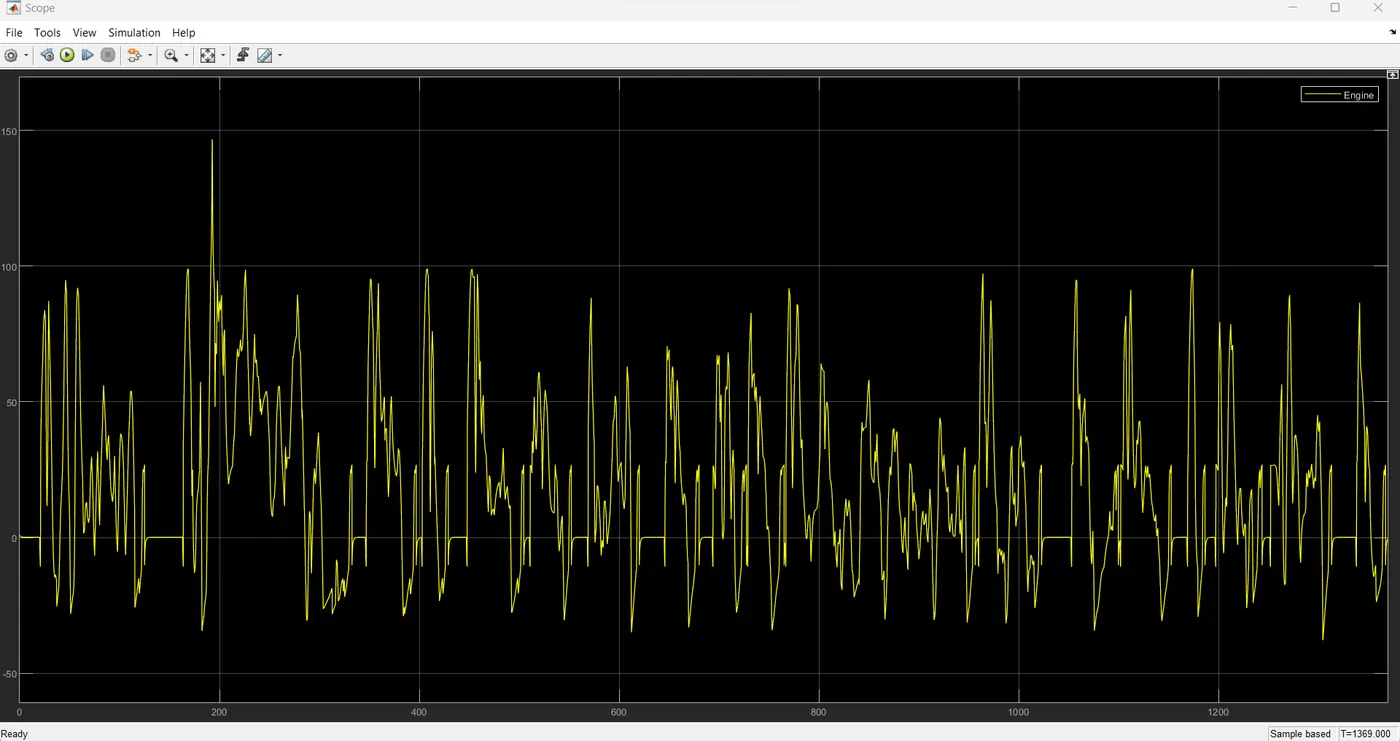
Electric motor Torque , Crank Torque 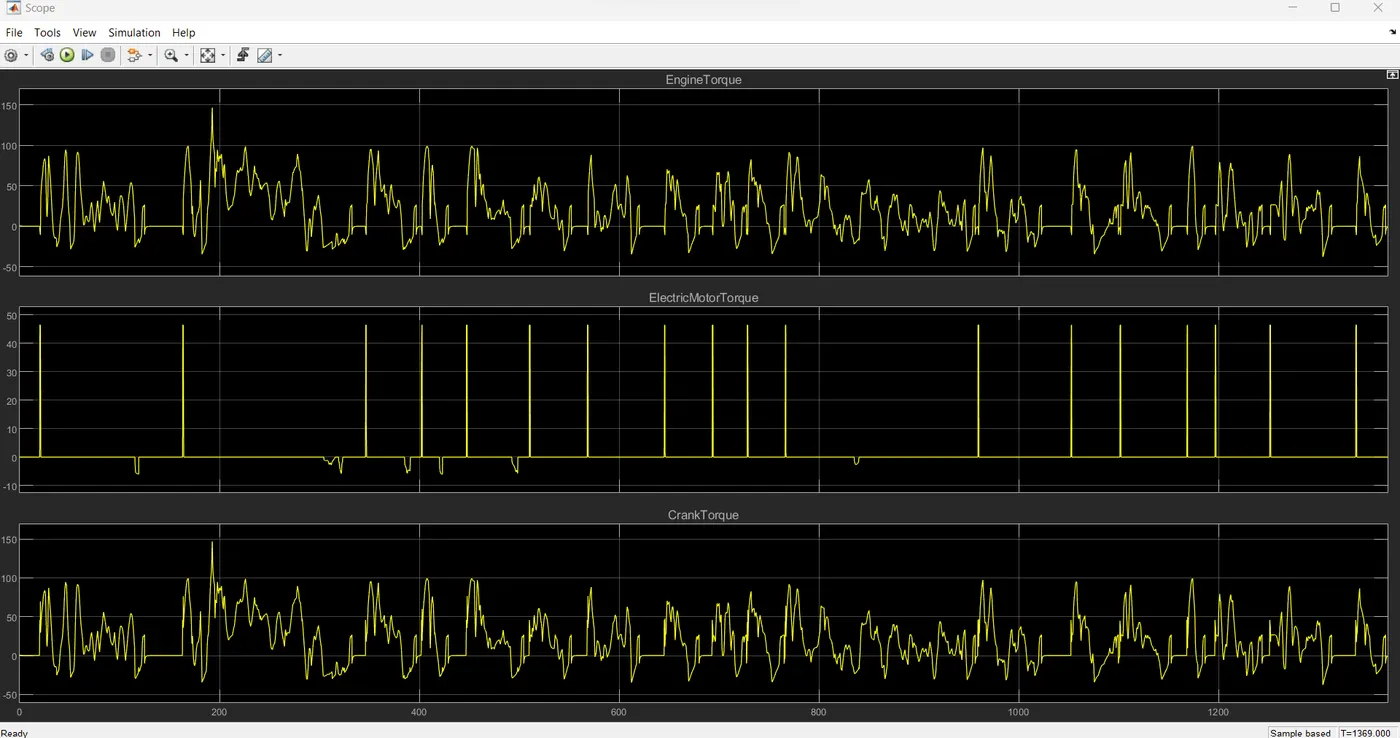
Motor Power 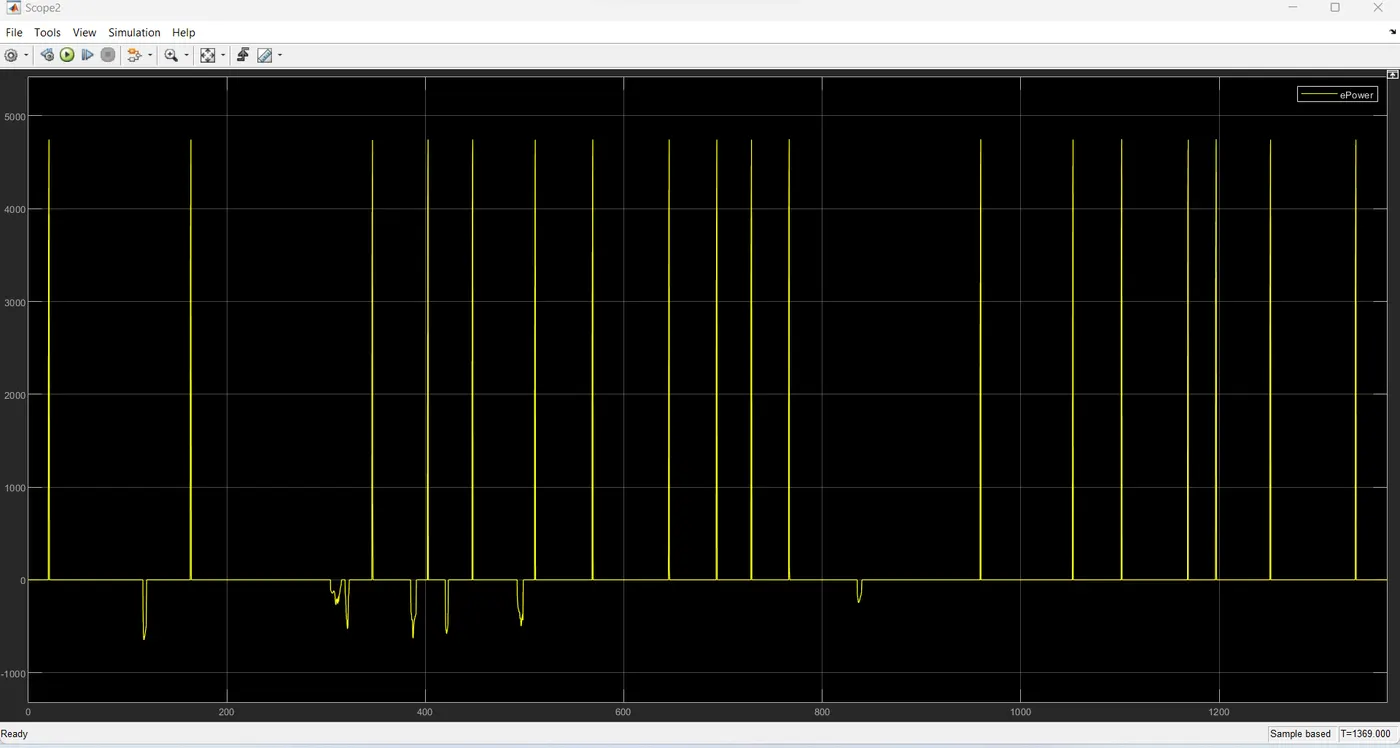
Engine Motor Torque vs Engine Speed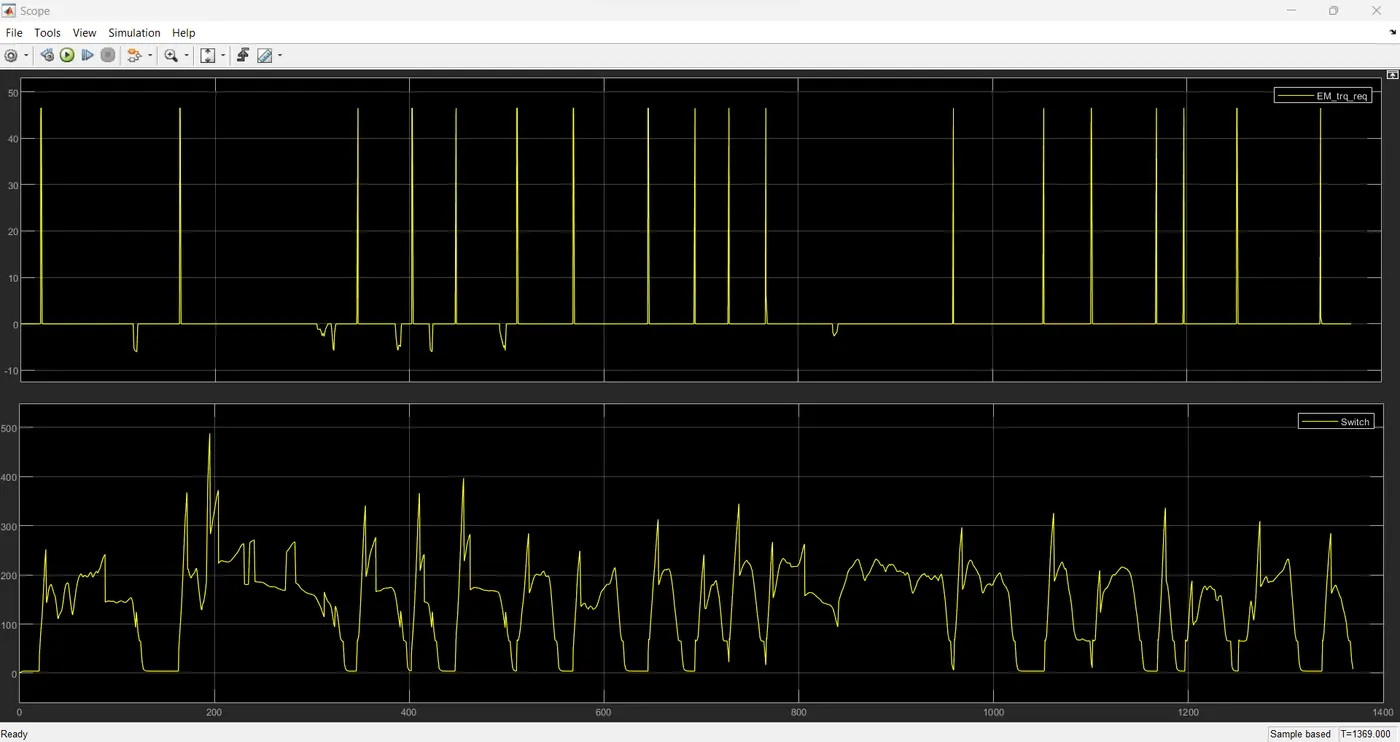
Road load , Tractive force and Acceleration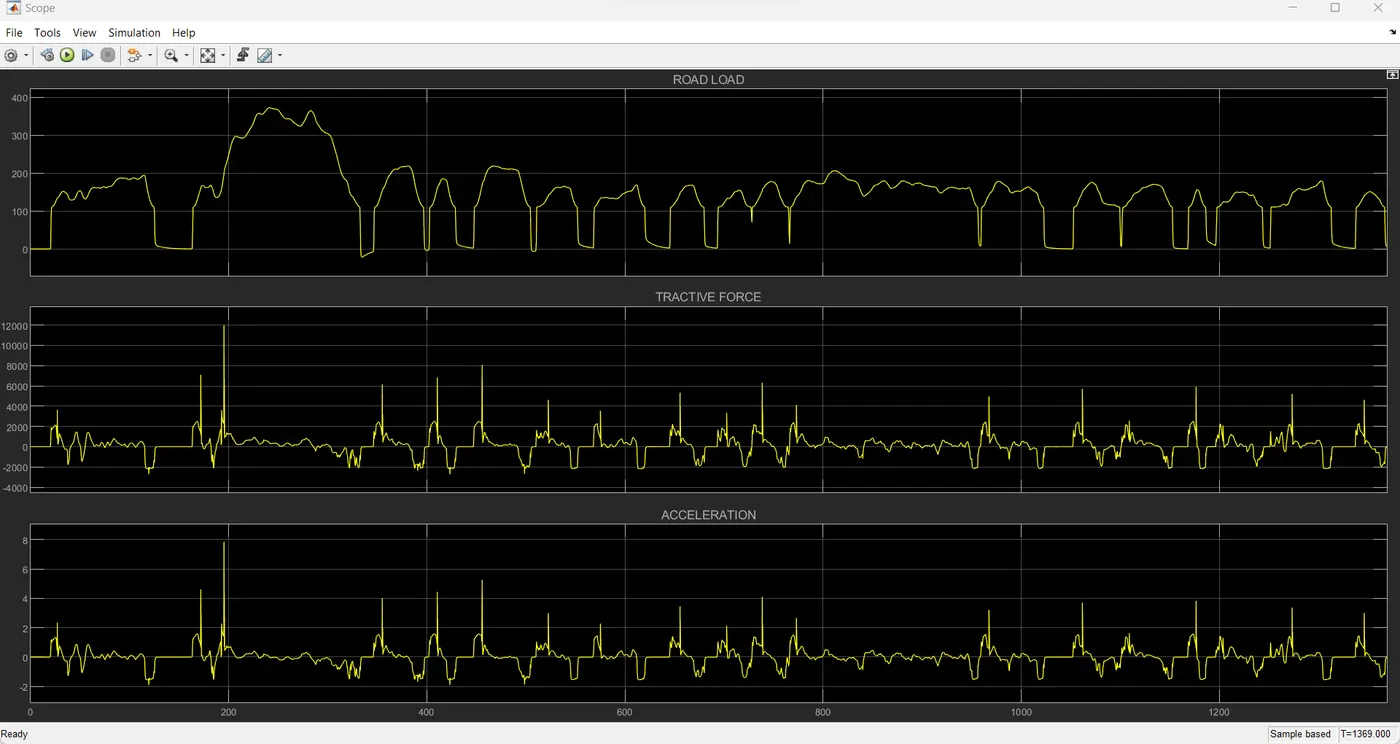
Accelaration , Velocity and Displacement 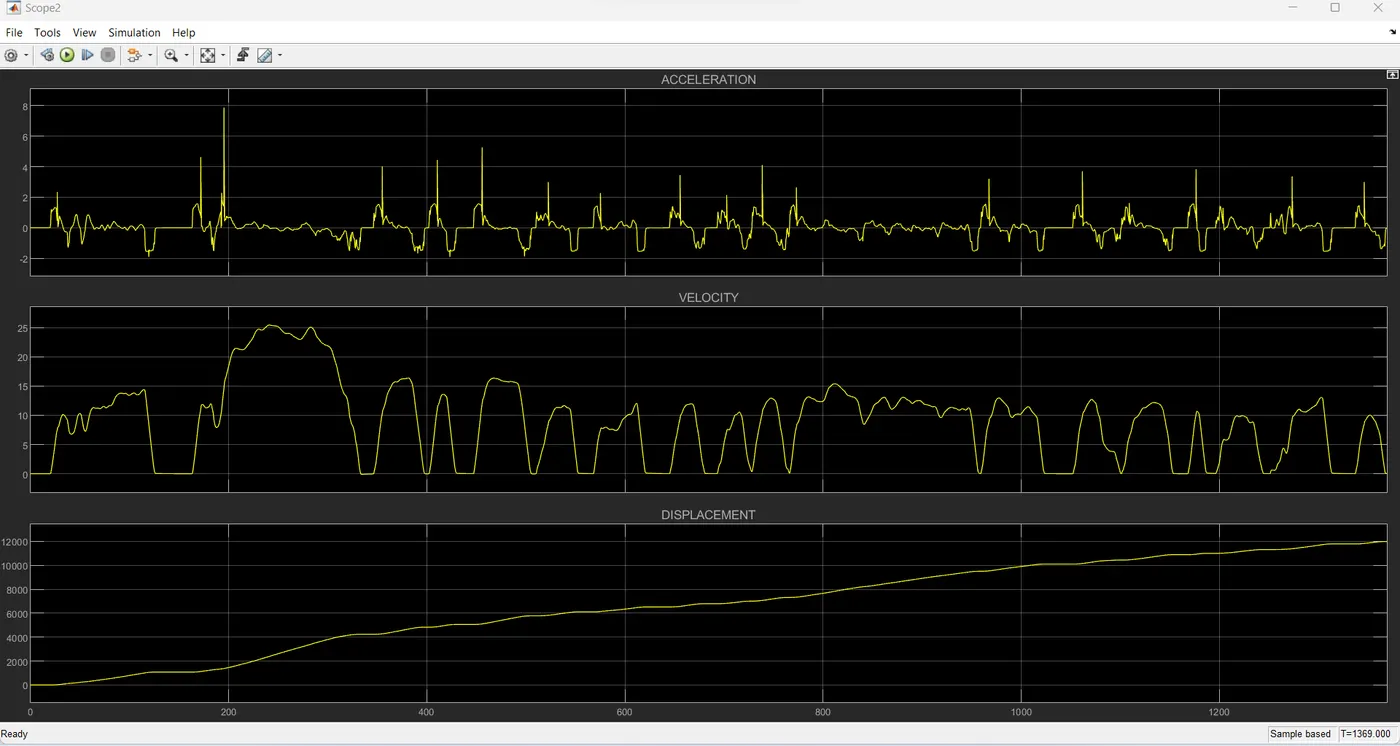
Drag Resistance , Rolling Resistance 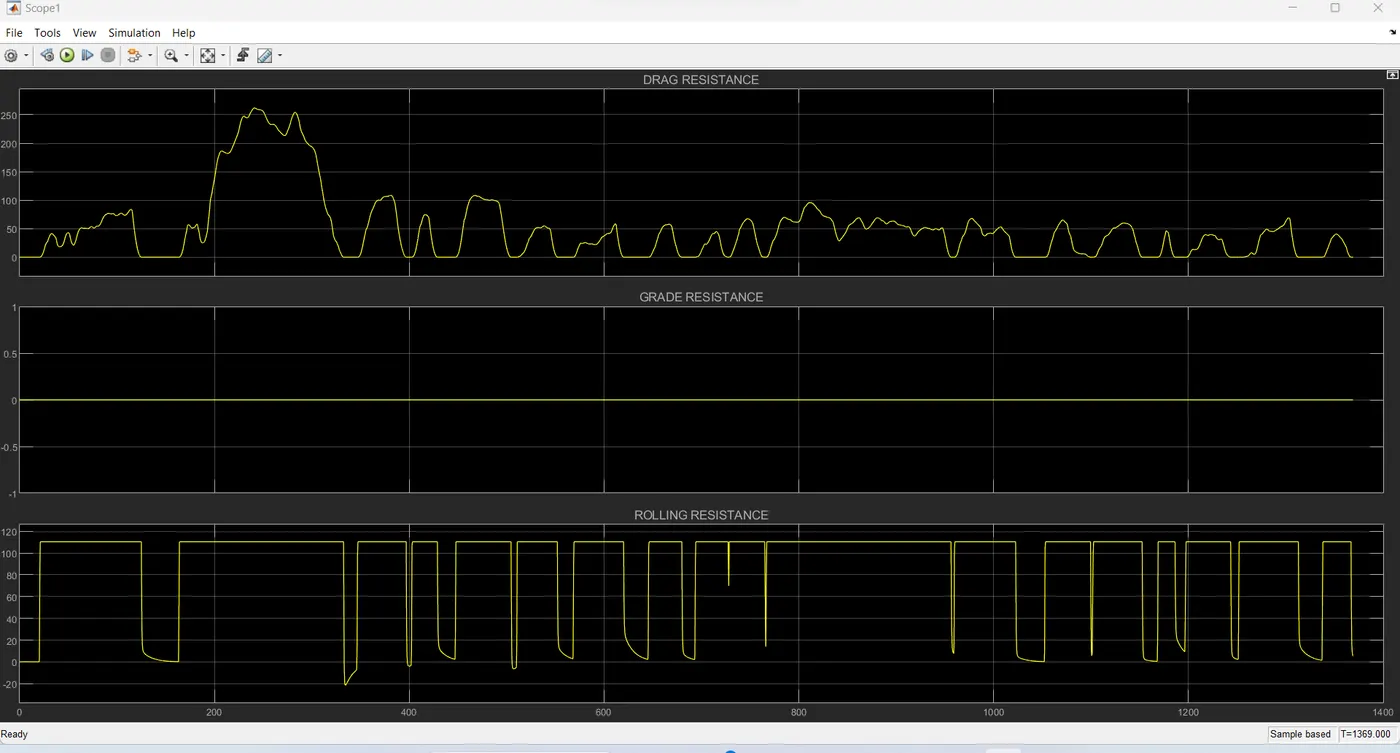
Terminal Vlotage , State of Charge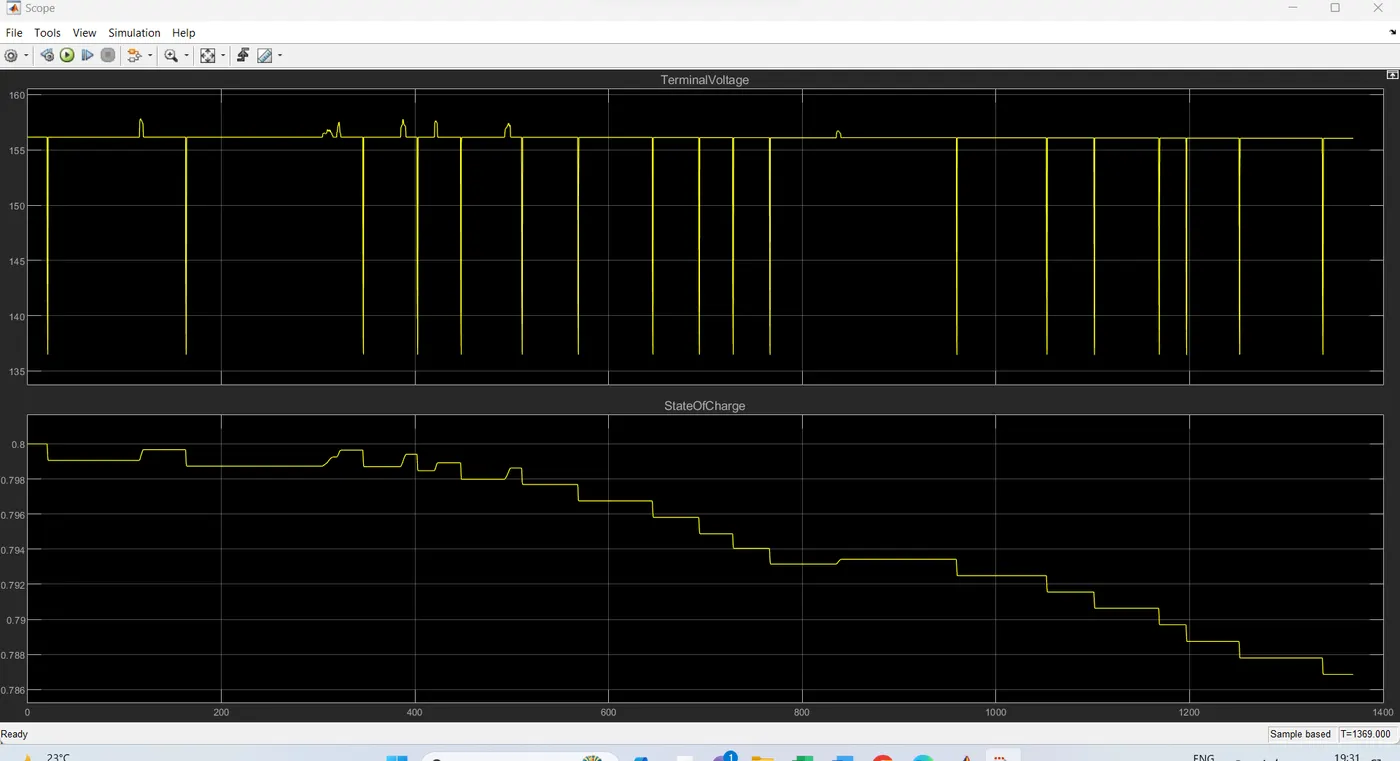
Torque Ratio , Pump Torque 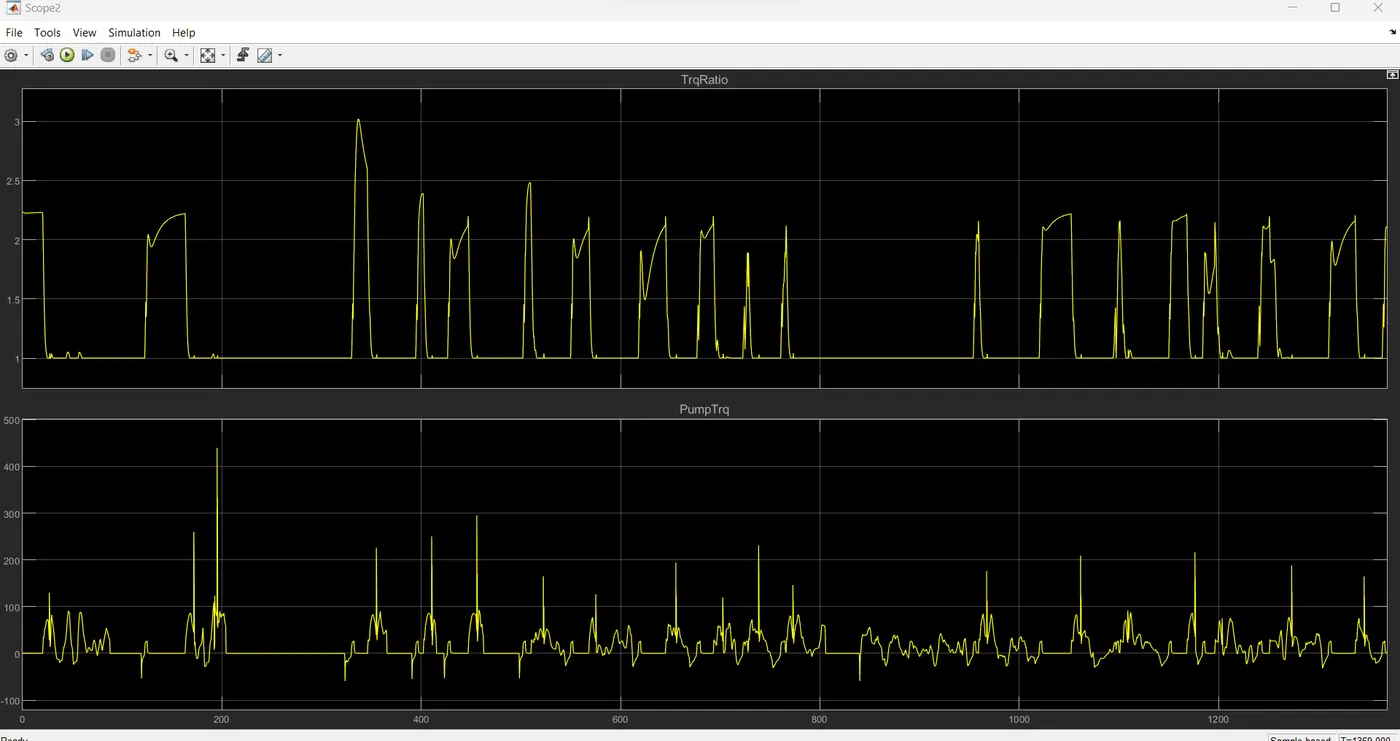
Electric Motor Torque , Engine Power 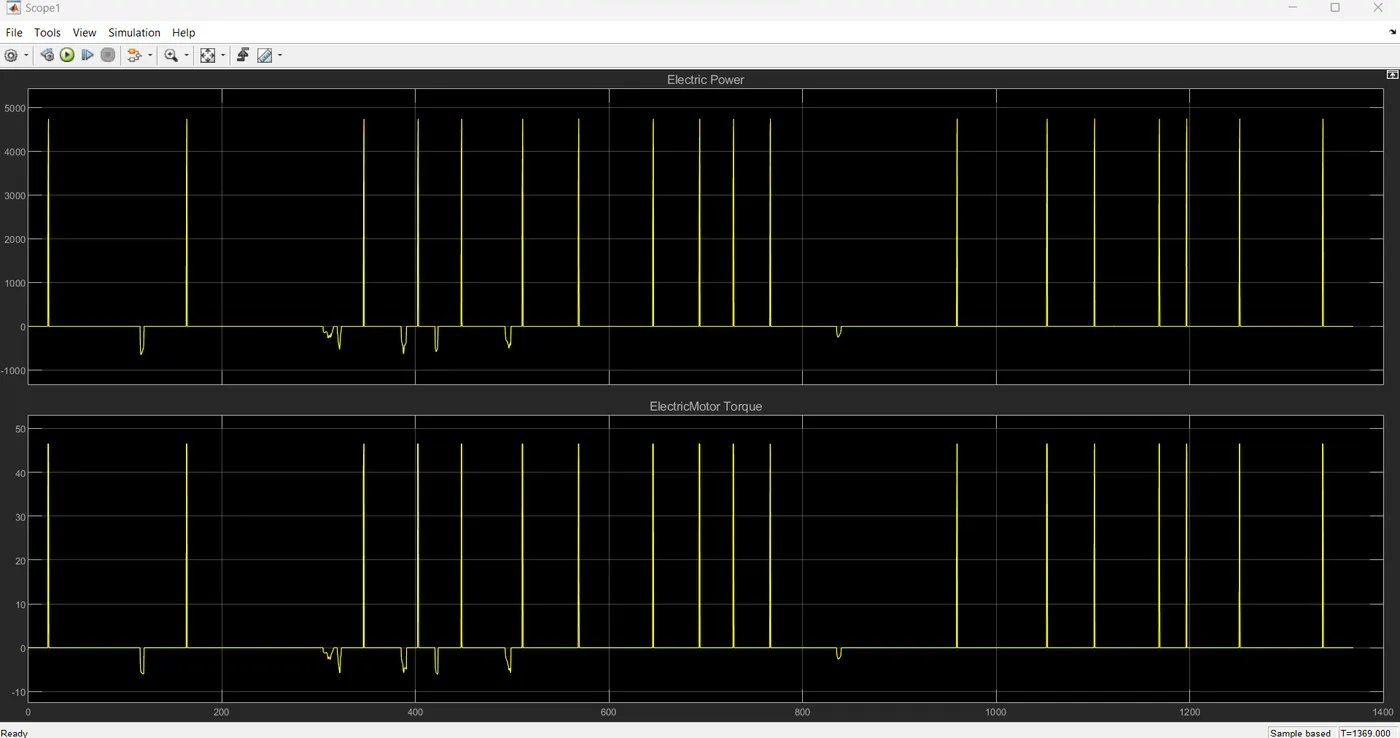
Matlab plots for UDDS Cycle
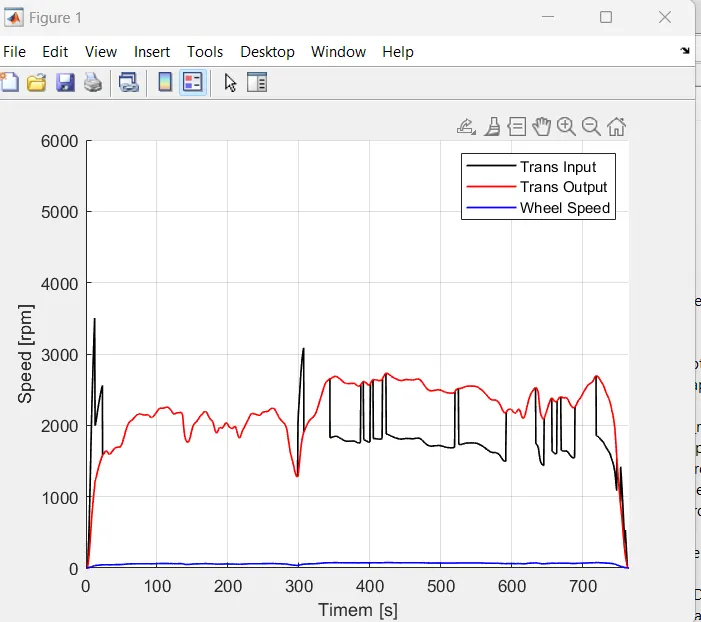
Plots for TransInput , Transoutput and Wheel Speed
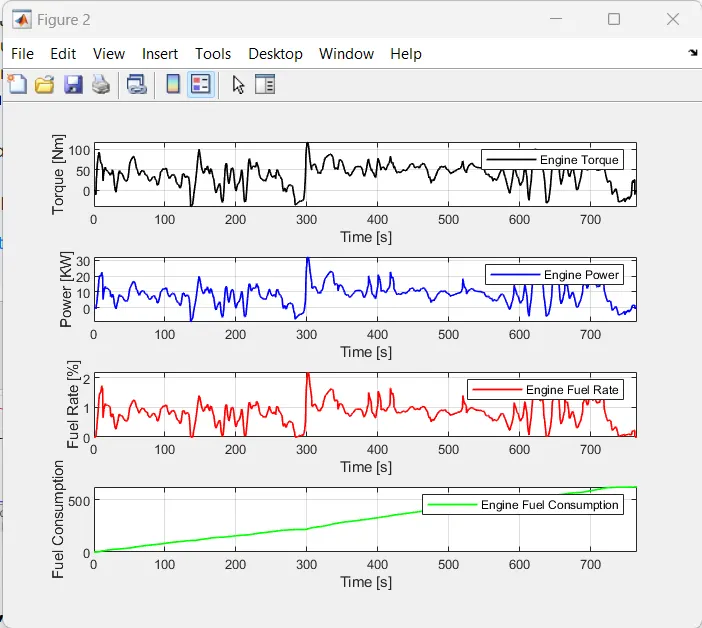
Plot engine torque, engine power, fuel rate and fuel consumption
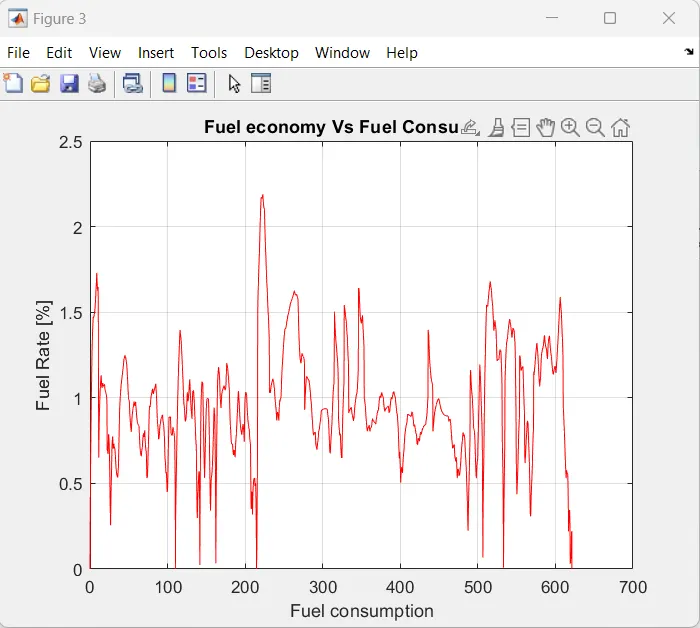
Plots for Fuel economy vs Fuel Consumption
Plots for Acceleration and Brake Pedal
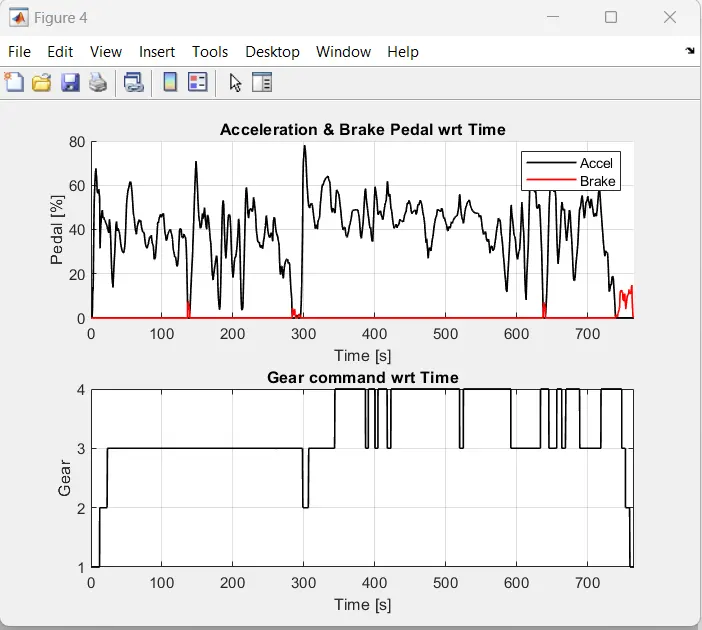
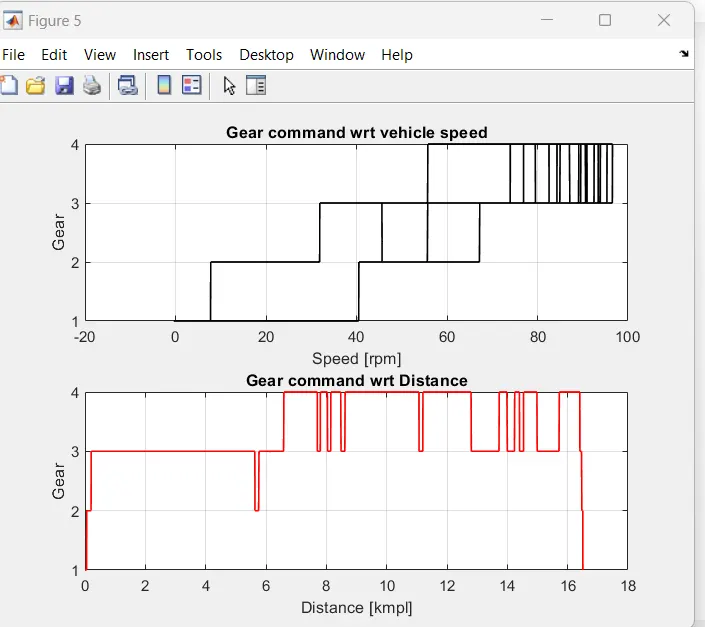
Plots for Gear command wrt to Speed and Distance
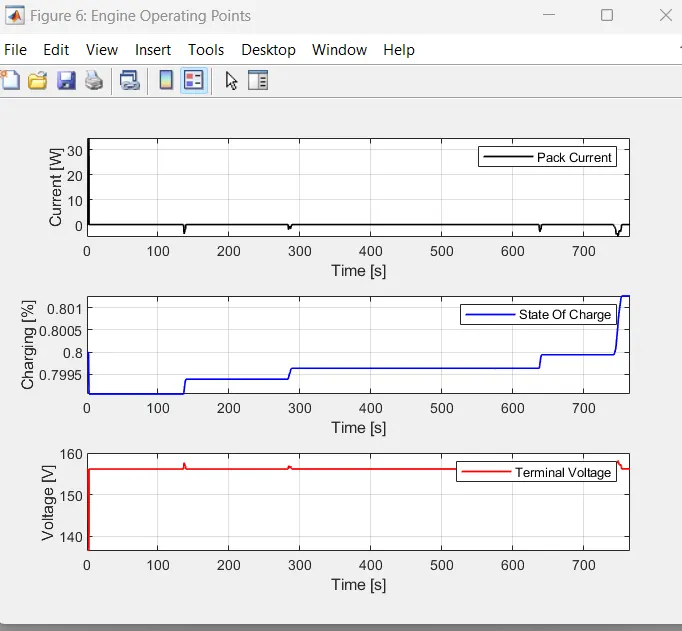
Plots for Terminal Voltage ,Pack current and state of charge
Plots for Electric Motor Power , Electric Motor Torque , Electric Motor Speed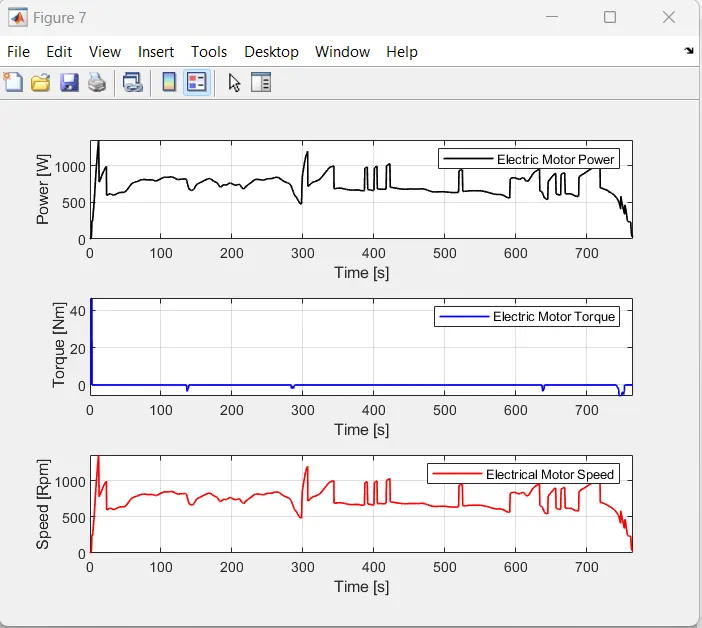
Plots for Engine Operating Points 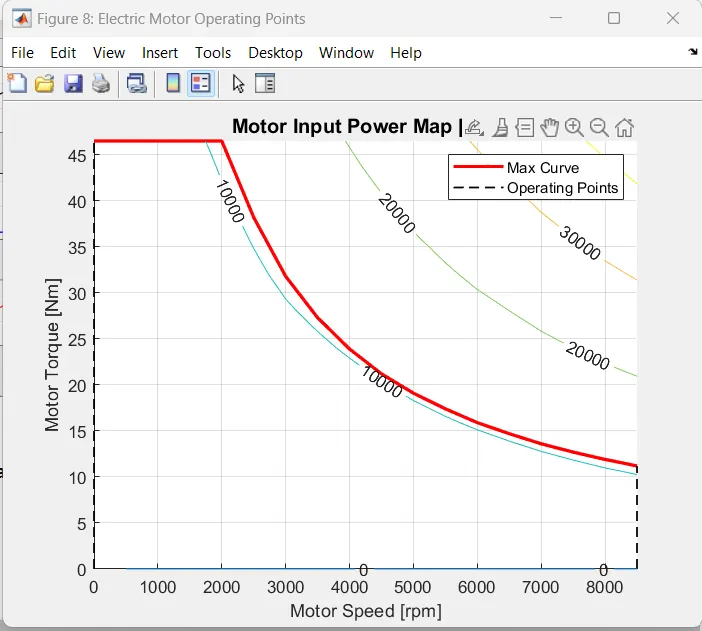
HWFET Cycle
Drive Cycle vs Velocity 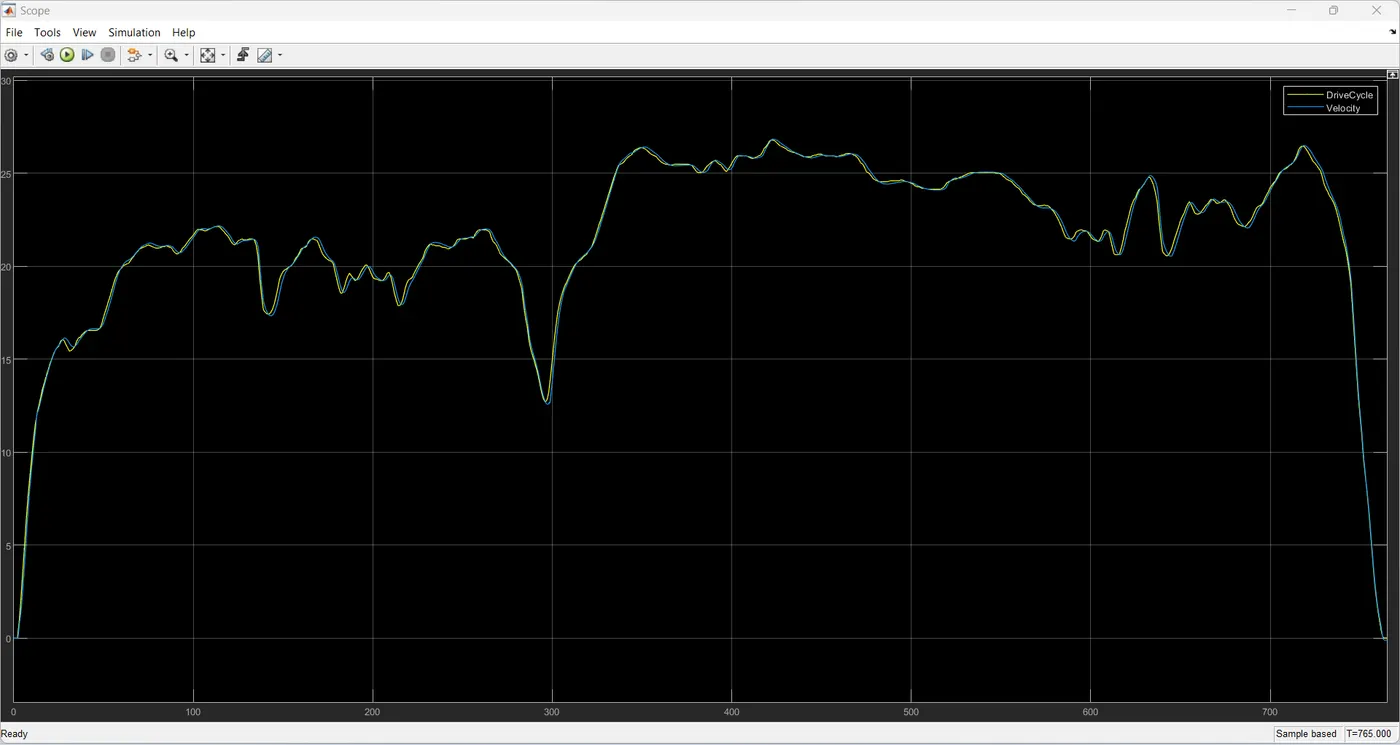
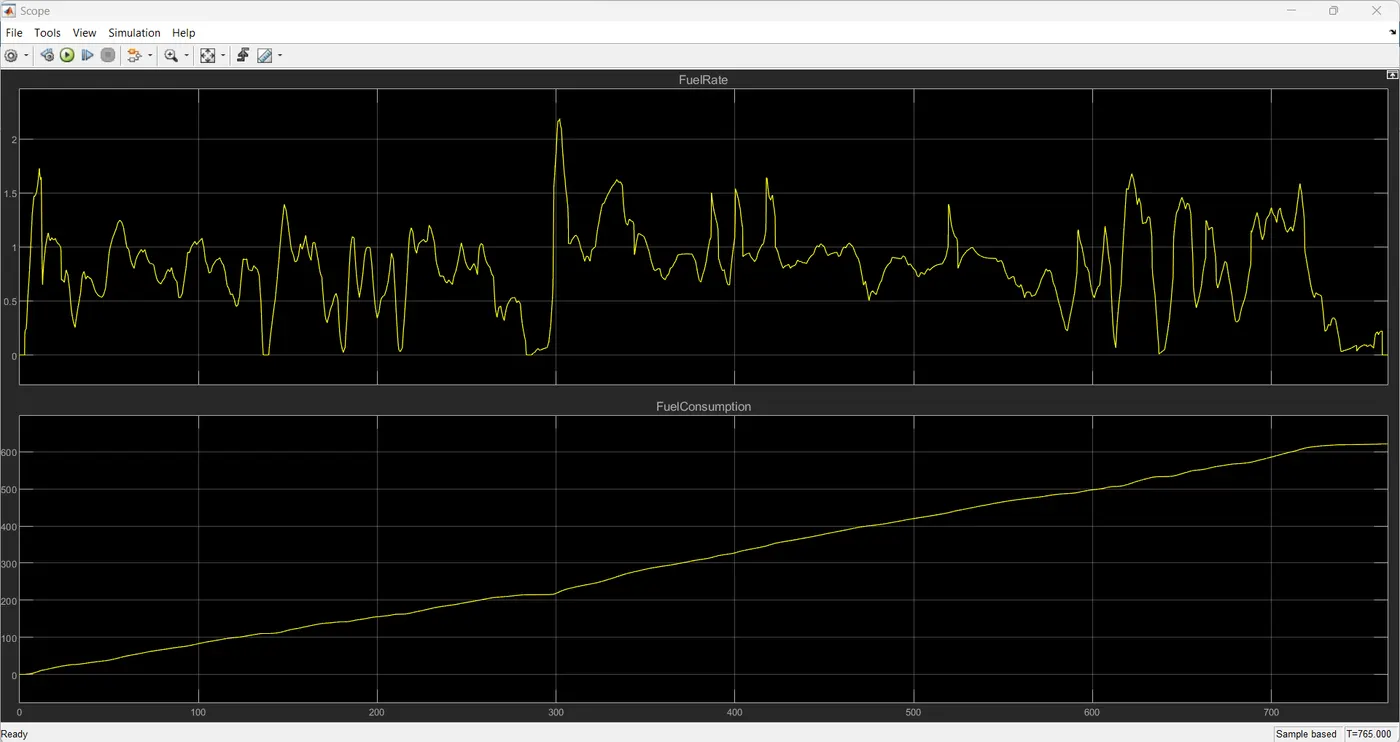
Fuel Cosumption vs Fuel Rate
Engine Torque ,Brake Torque and Transmission Gear 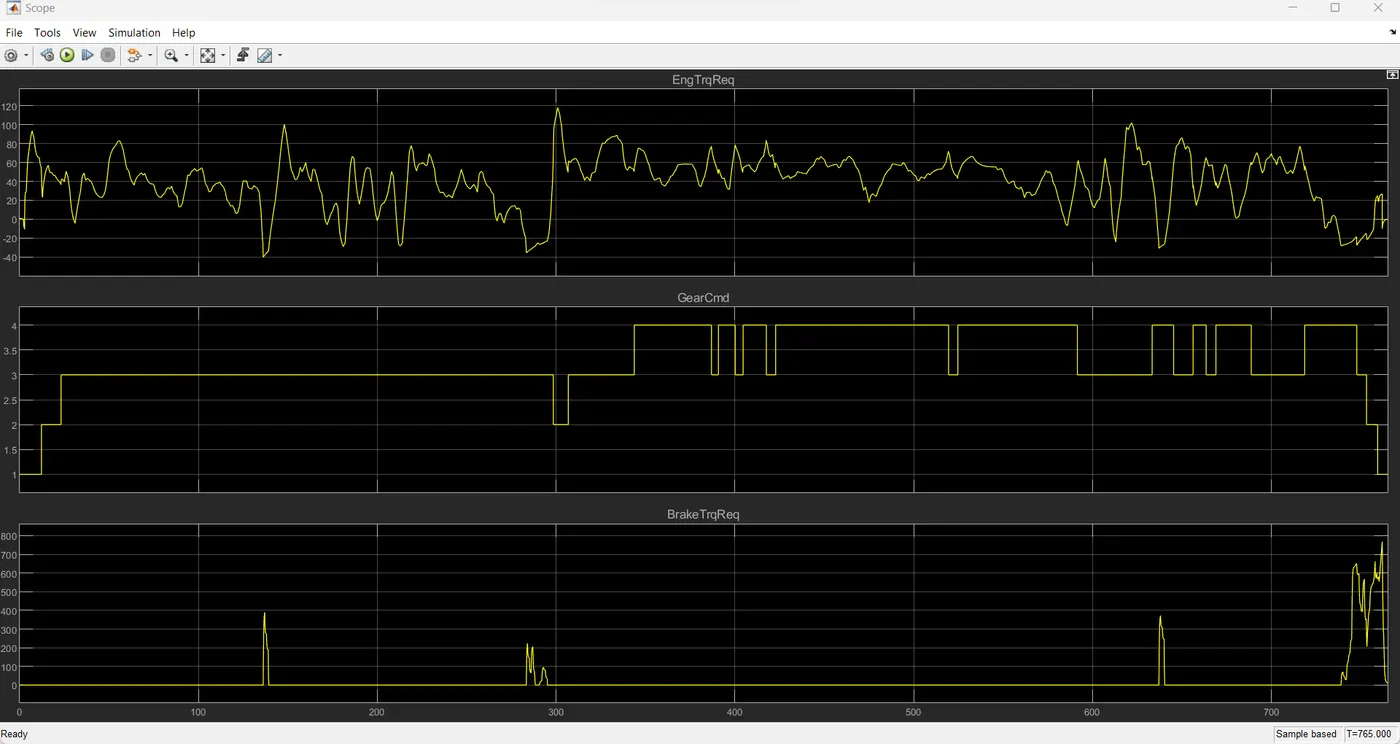
Engine Torque
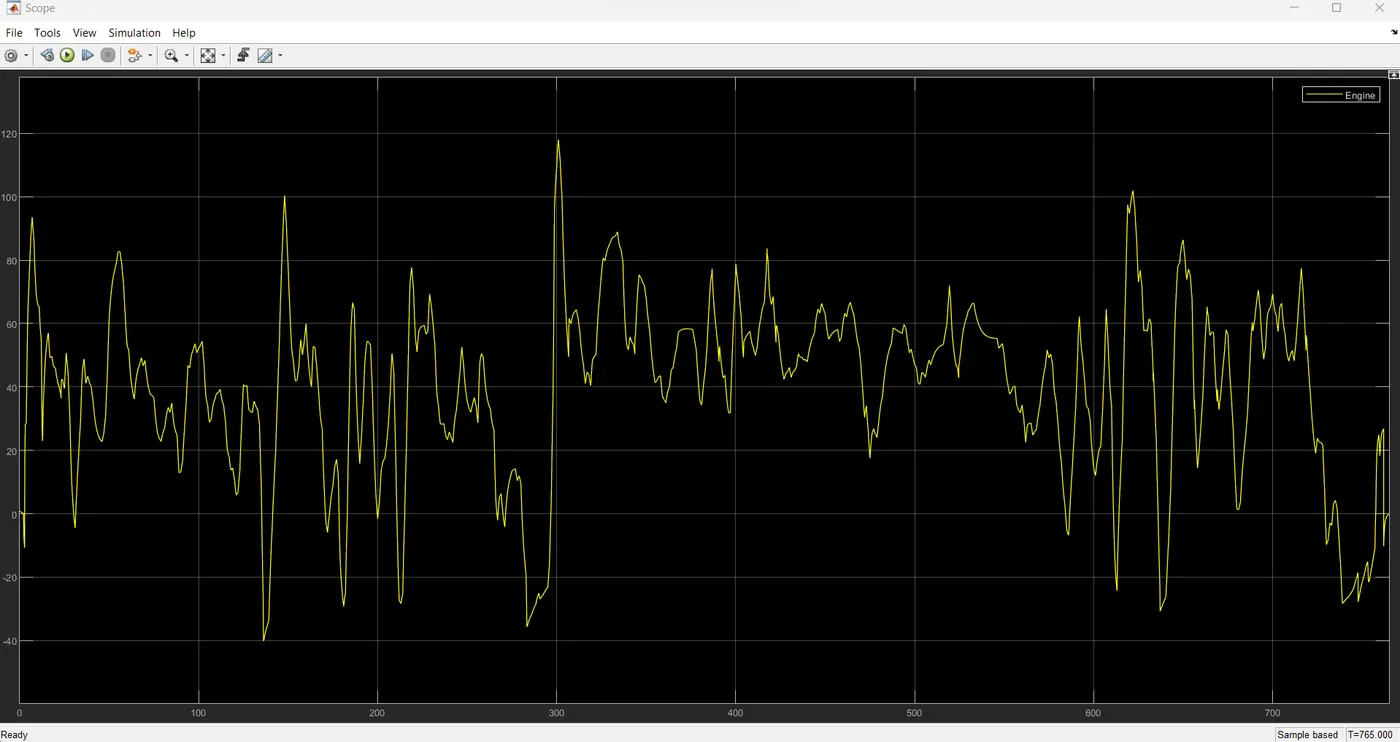
Engine Torque , Electric Motor Torque , Crank Torque
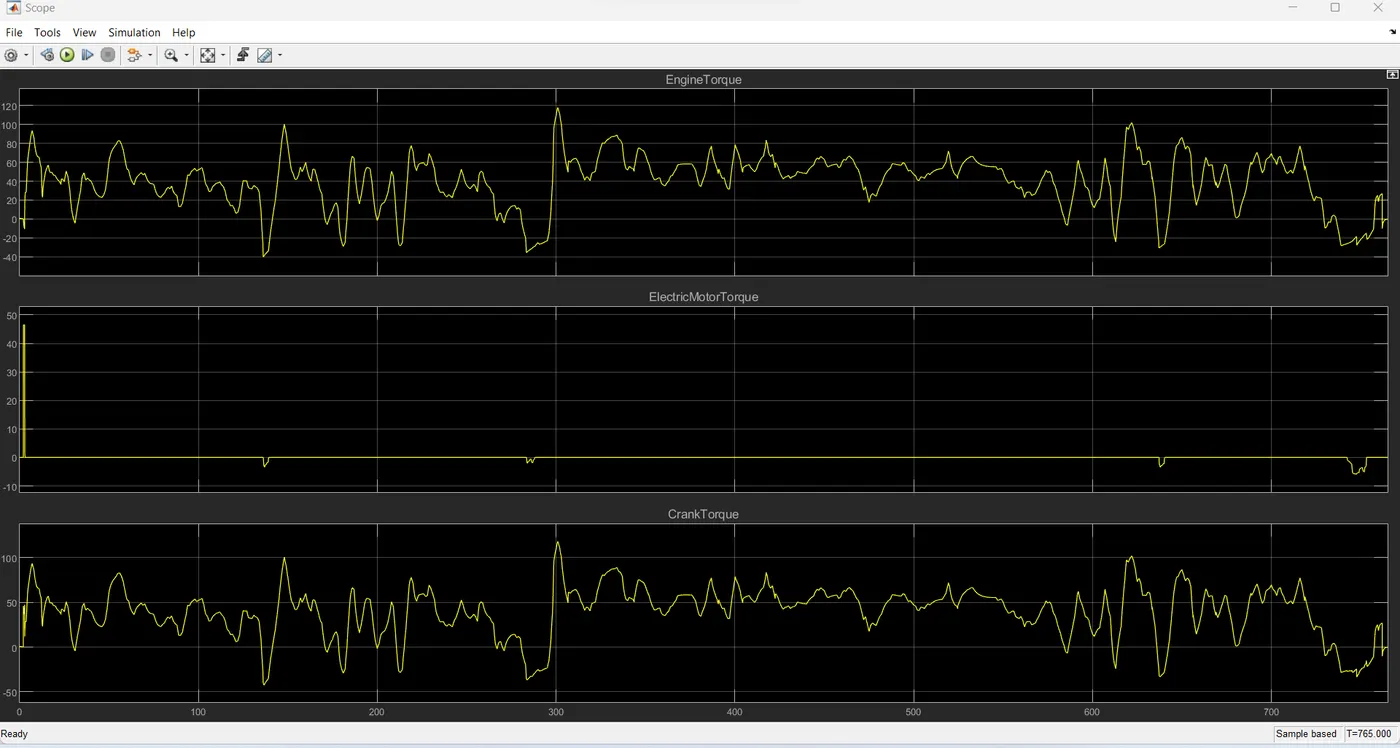
Drag Resistance and Rolling Resistance 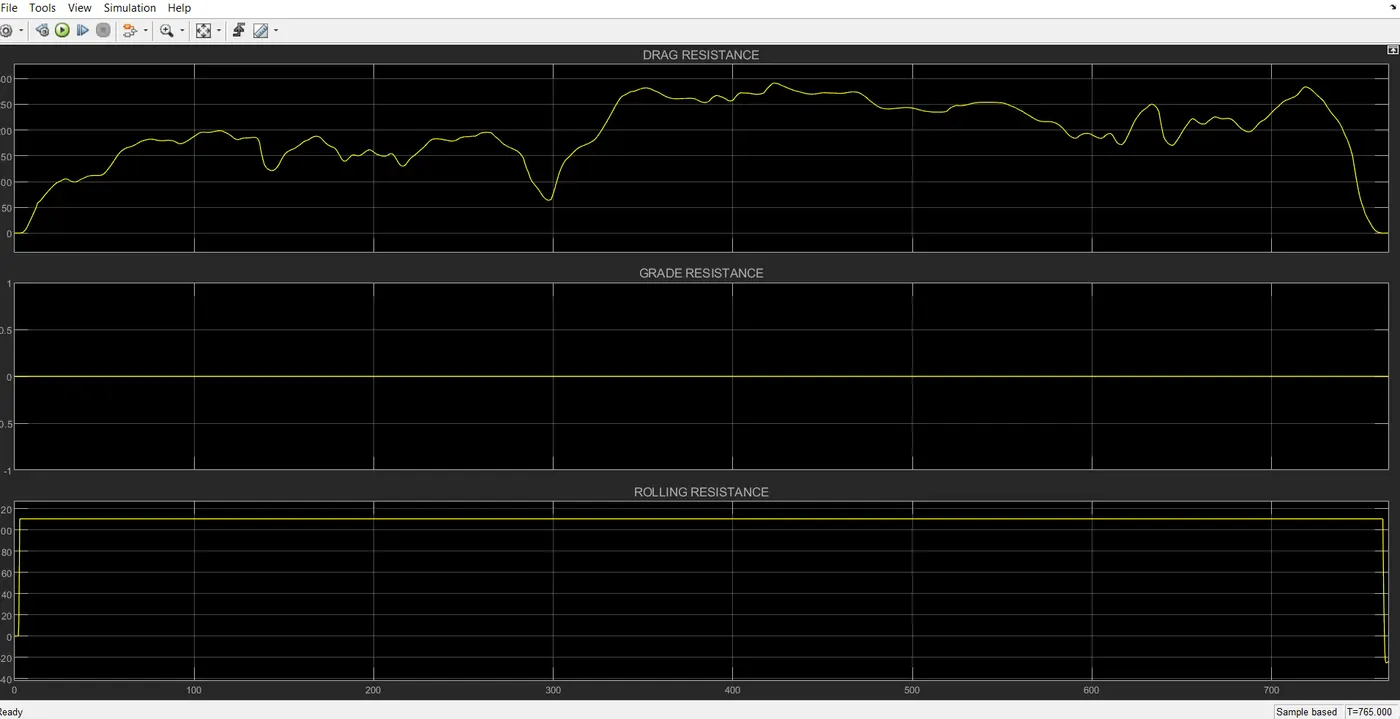
Pump Torque VS Turbine Torque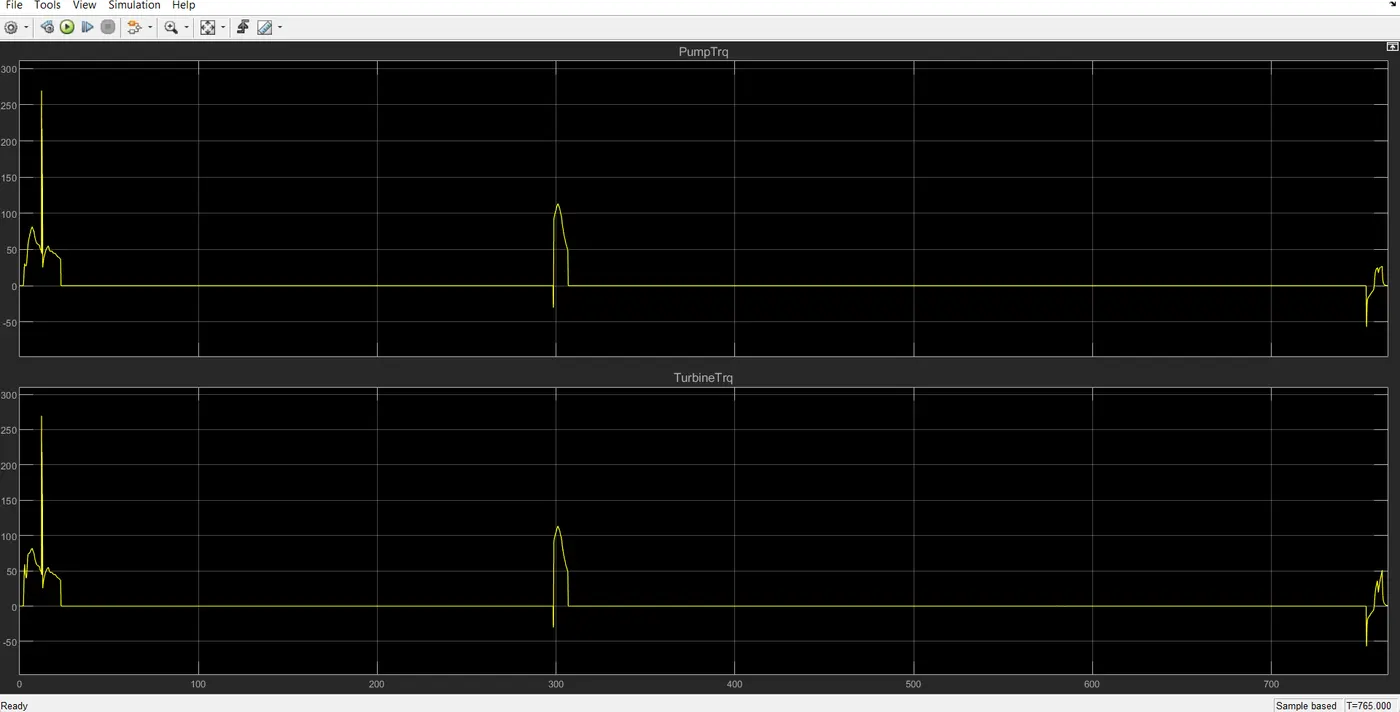
Road load , Tractive force and Aceeleration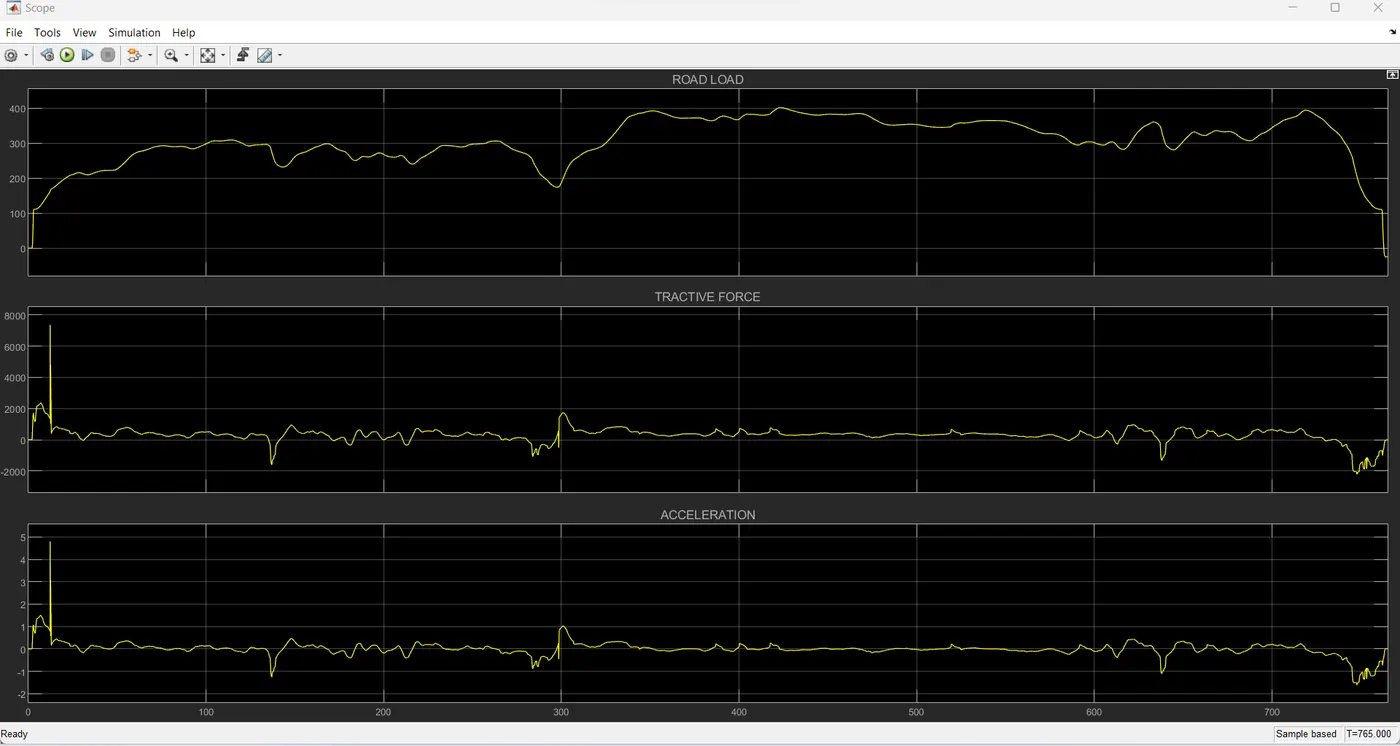
Terminal Voltage and State of Charge 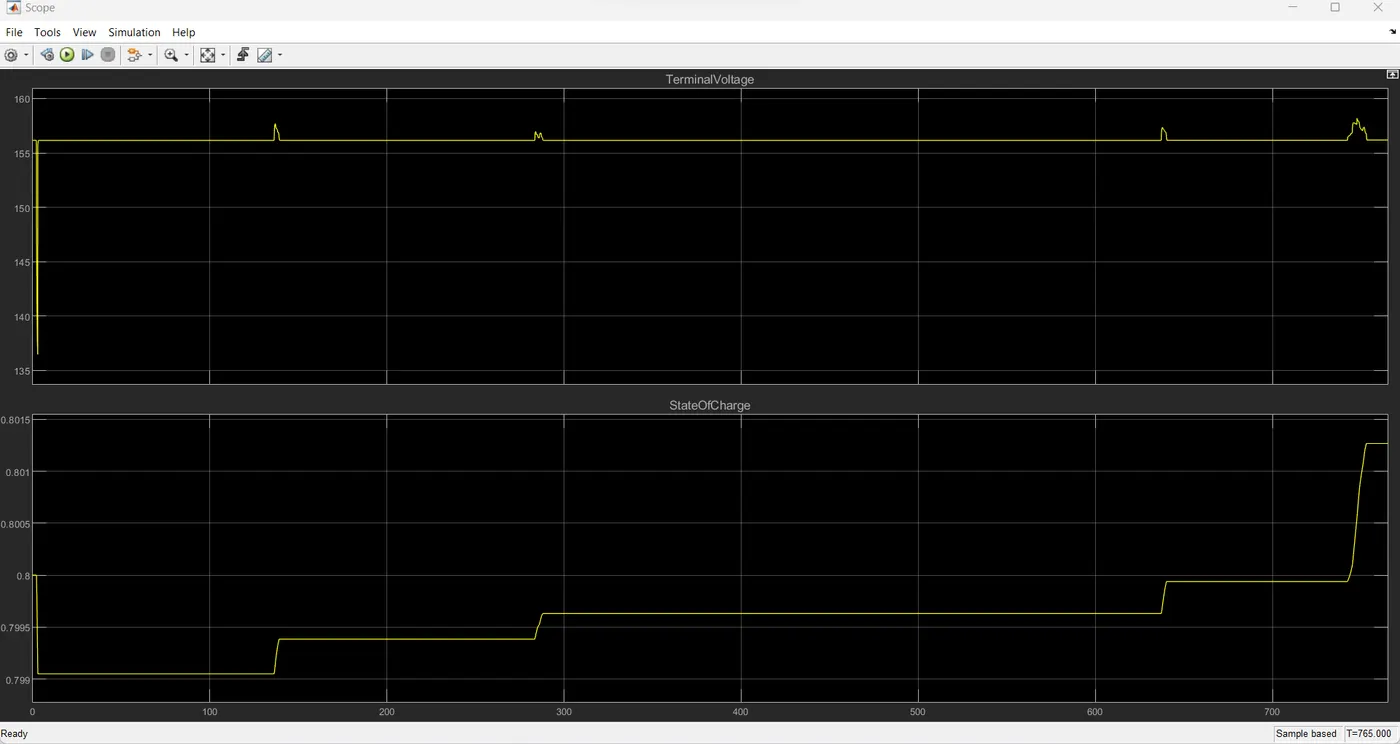
Electric Power and Electric Motor Torque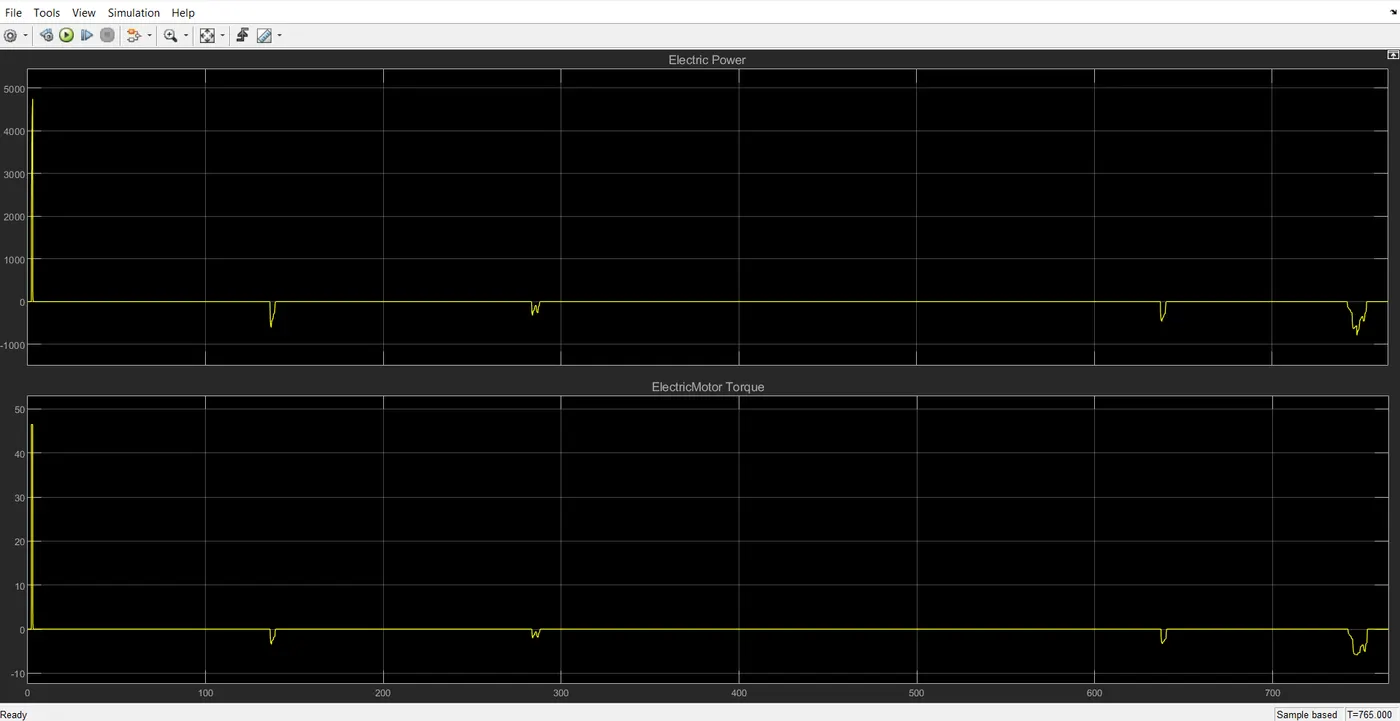
Electric Motor Torque and Engine Speed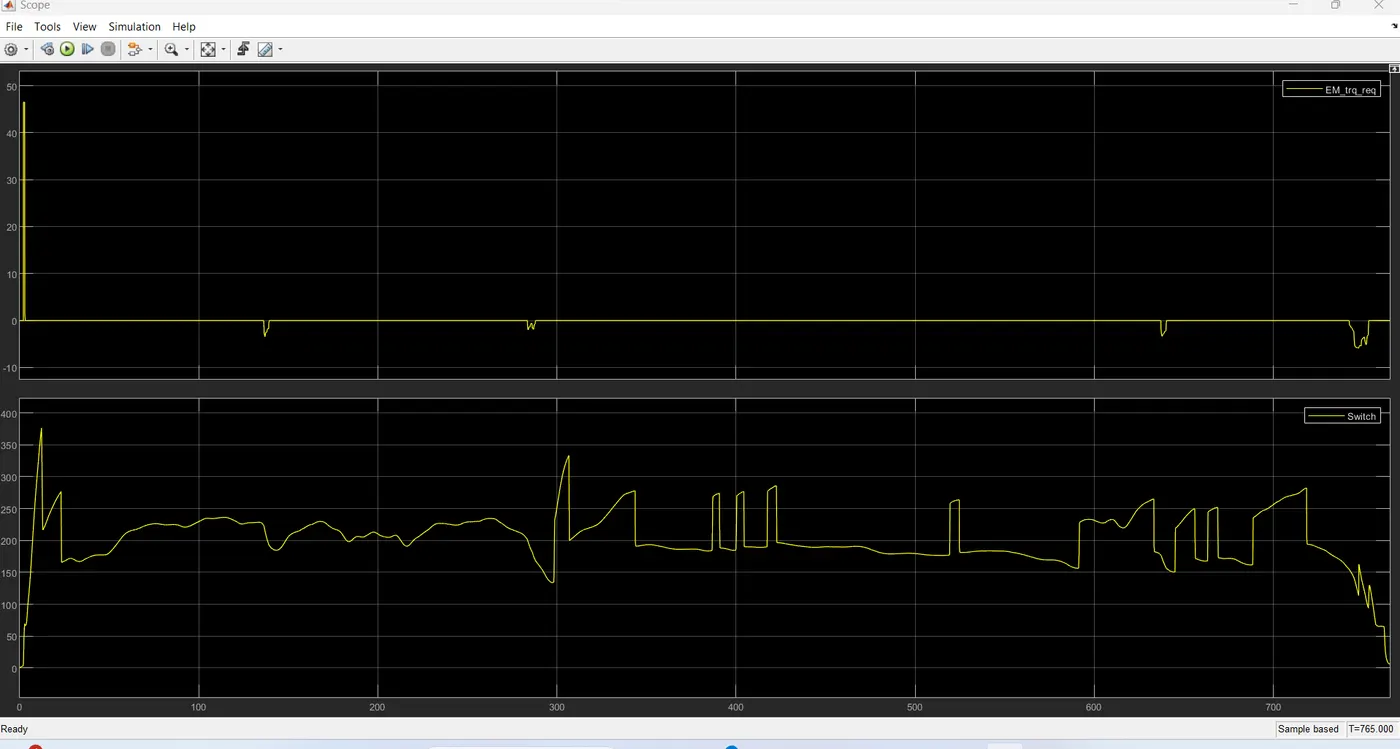
Matlab plots for HWFET Cycle
Plots for TransInput , Transoutput and Wheel Speed
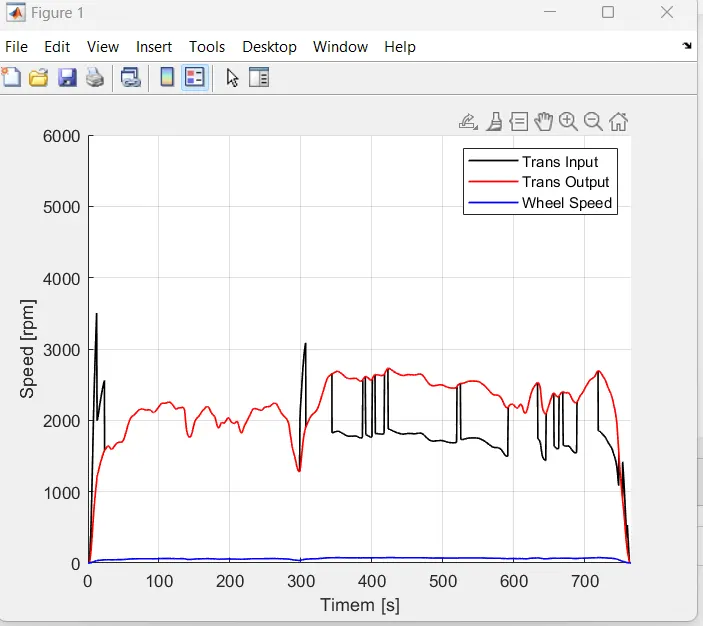
Plots for Engine Torque , Engine Power , Fuel consumption and Fuel Rate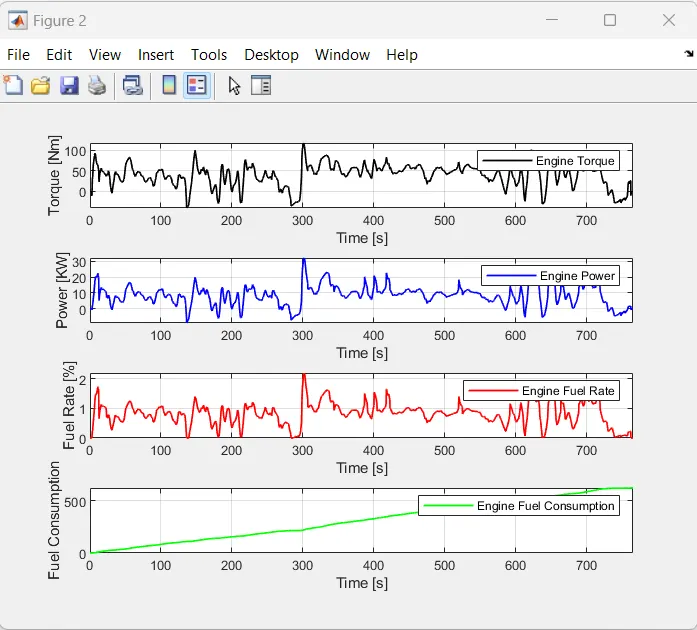
Plots for Fuel economy vs Fuel Consumption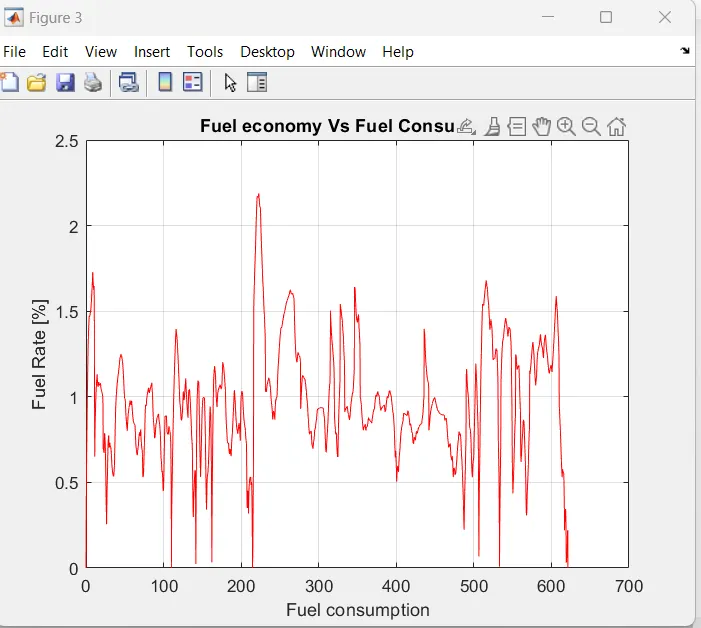
Plots for Acceleration and Brake Pedal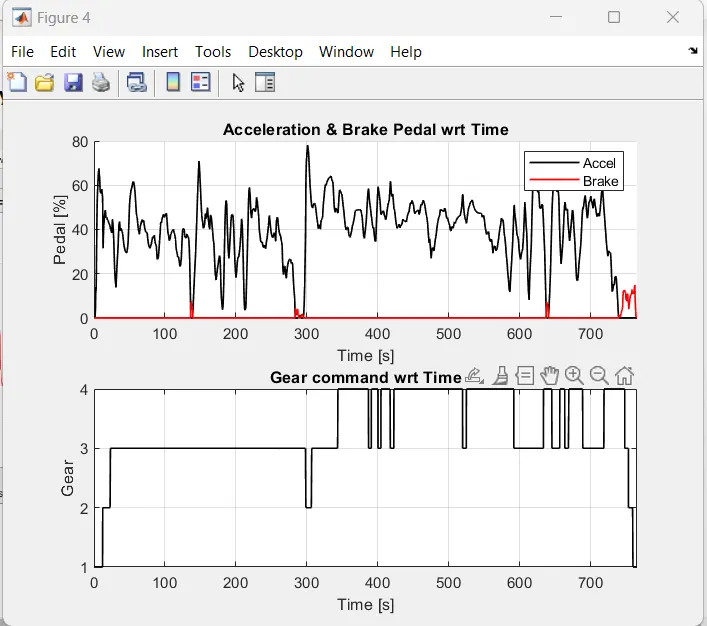
Plots for Gear command and Vehicle Speed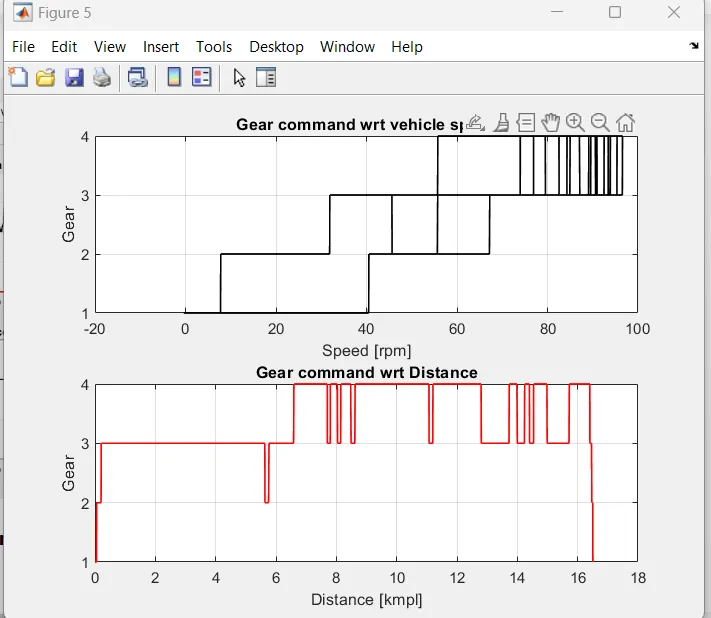
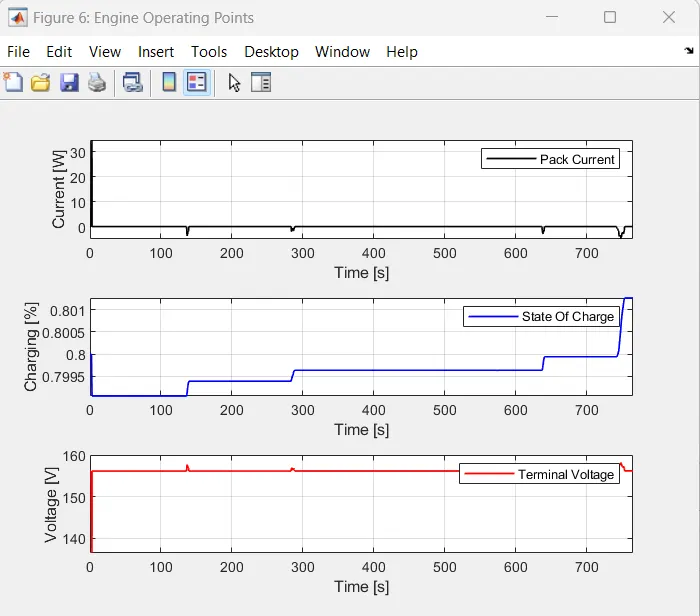
Plots for Pack of current , State of Charge and Terminal Voltage
Plots for Electric Motor Torque , Electric Motor Power and Electric Motor Speed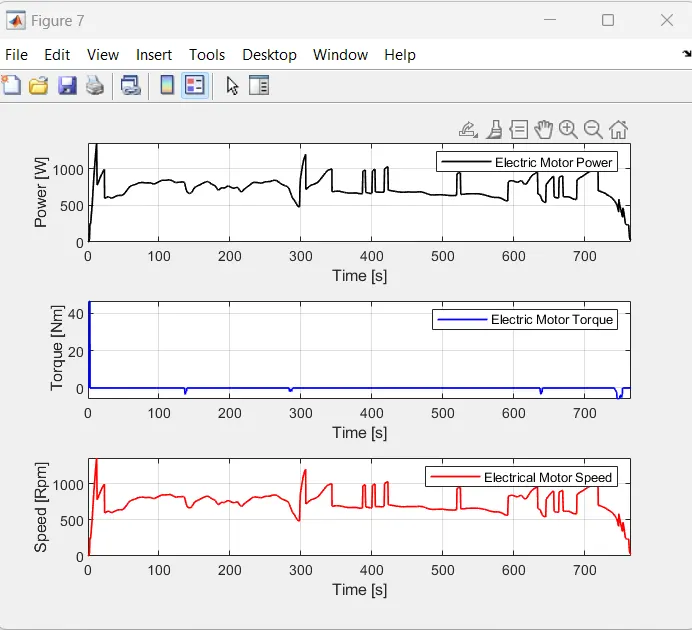
Plots for Engine operating points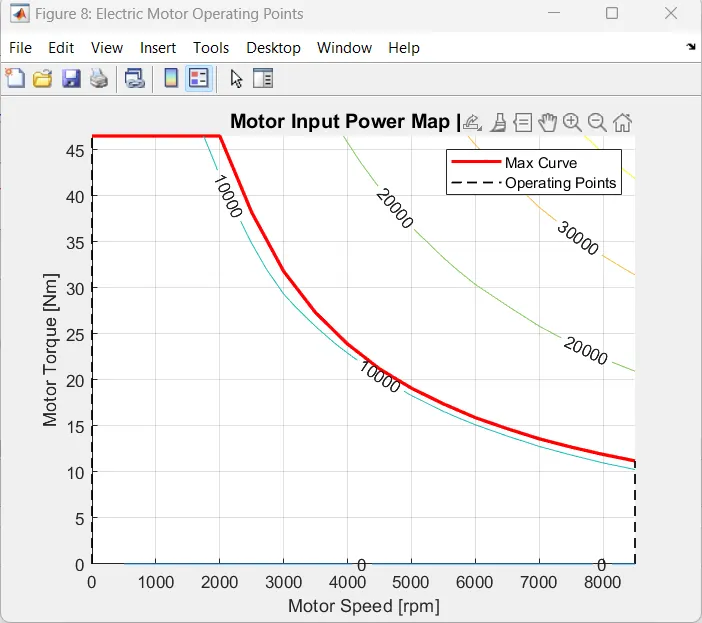
Fuel Economy Table:
| Drive Cycle | Conventional Vehicle Fuel Economy (kmpl) | Hybrid Vehicle Fuel Economy (kmpl) | Improvement |
|---|---|---|---|
| UDDS | 15.0 | 22.5 | 50% |
| HWFET | 20.0 | 30.0 | 50% |
Time Trace of Engine, Transmission Input, Transmission Output, and Wheel Speed:
- The engine speed generally follows the vehicle speed, but it is higher during acceleration and lower during deceleration.
- The transmission input speed is always lower than the engine speed, indicating that the transmission is typically in overdrive.
- The transmission output speed is always higher than the wheel speed, indicating that the transmission is typically in overdrive.
- The wheel speed closely follows the vehicle speed, but it is slightly lower due to tire slip.
Subplot of Engine Torque, Engine Power, Fuel Rate, and Fuel Consumption:
- Engine torque is highest during acceleration and lowest during deceleration.
- Engine power is highest during acceleration and lowest during deceleration.
- Fuel rate is highest during acceleration and lowest during deceleration.
- Fuel consumption is highest during acceleration and lowest during deceleration.
Subplot of Accelerator and Brake Pedal, Gear Command, Vehicle Desired and Actual Speed, Vehicle Distance:
- The accelerator pedal is pressed during acceleration and released during deceleration.
- The brake pedal is pressed during deceleration and released during acceleration.
- The gear command is typically in overdrive during steady-state driving and is shifted down during acceleration and up during deceleration.
- The vehicle desired speed is set by the driver and is followed by the vehicle actual speed.
- The vehicle distance increases steadily over time.
Plot of Engine Operating Points on the Engine Fuel Map:
- The engine operating points are concentrated in the low- and mid-load regions of the fuel map, indicating that the engine is typically operating in its most efficient range.
Subplot of Motor Speed, Torque, Motor Input Power:
- Motor speed is highest during acceleration and lowest during deceleration.
- Motor torque is positive during acceleration and negative during deceleration.
- Motor input power is positive during acceleration and negative during deceleration.
Subplot of Pack Voltage, Current, and SoC:
- Pack voltage is relatively stable throughout the drive cycle.
- Pack current is positive during acceleration and negative during deceleration.
- SoC decreases during acceleration and increases during deceleration.
Plot of Motor Operating Points on the Motor Input Power Map:
- The motor operating points are concentrated in the low- and mid-power regions of the input power map, indicating that the motor is typically operating in its most efficient range.
Conclusions:
- The hybrid vehicle achieves a significant improvement in fuel economy compared to the conventional vehicle on both the urban and highway cycles.
- The hybrid vehicle is able to achieve this improvement by utilizing the electric motor to assist the engine during acceleration and regenerative braking to recapture energy during deceleration.
- The hybrid vehicle is able to operate the engine and motor in their most efficient ranges throughout the drive cycle.