Parsing NASA thermodynamic data using MATLAB.
Objective:
- To write a function that extracts the 14 co-efficients and calculates the enthalpy, entropy and specific heats for all the species in the data file. You will be reading this file NASA thermodynamic data(Tip:use fopen and fgetl). The formulae are shown below.
Here R is the universal gas constant, T is the temeprature
The FIRST 7 coefficients are HIGH-temperature coefficients and the SECOND 7 coefficients are LOW-temperature coefficients.
Also use the LOCAL TEMPERATURE RANGES which is unique for each individual species, not the GLOBAL TEMPERATURE RANGE.
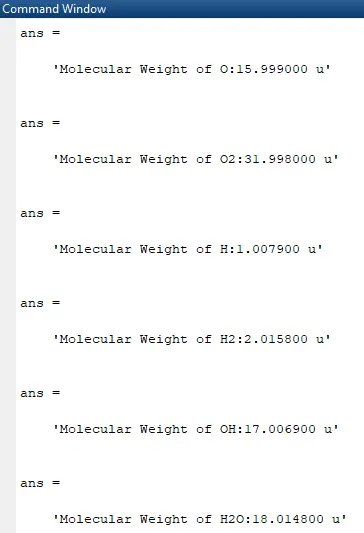
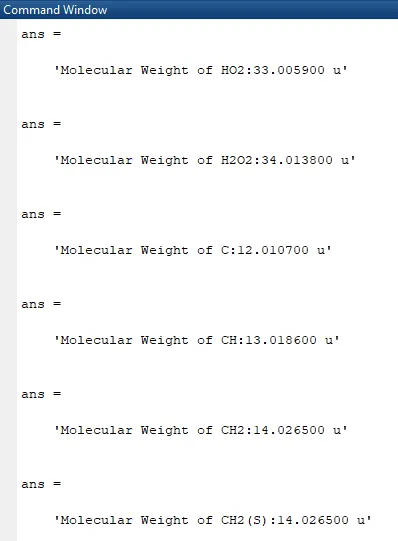
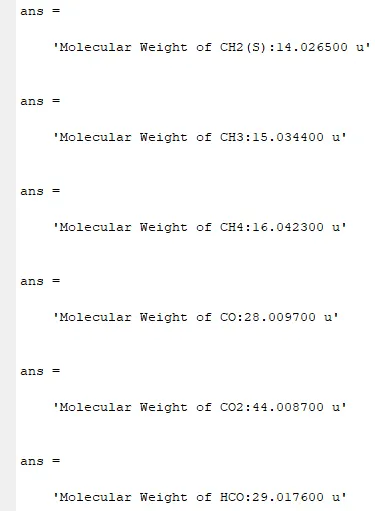
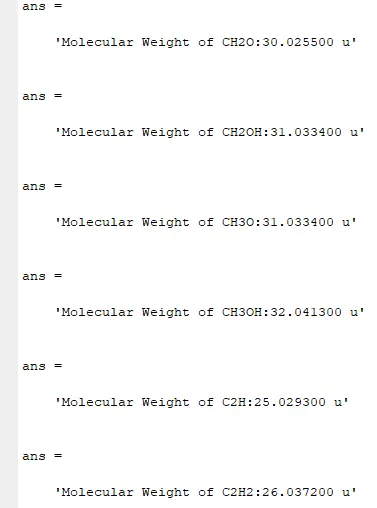
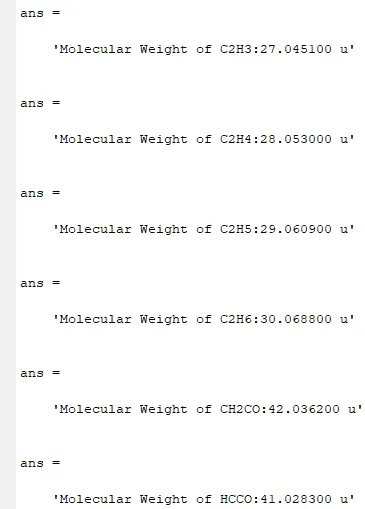
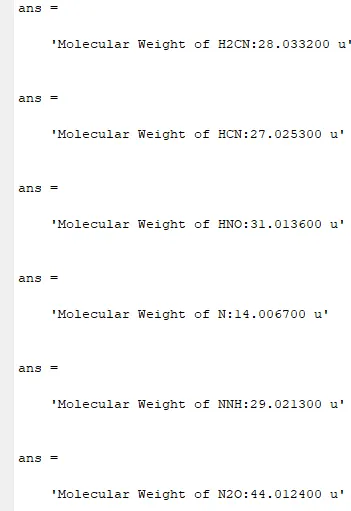
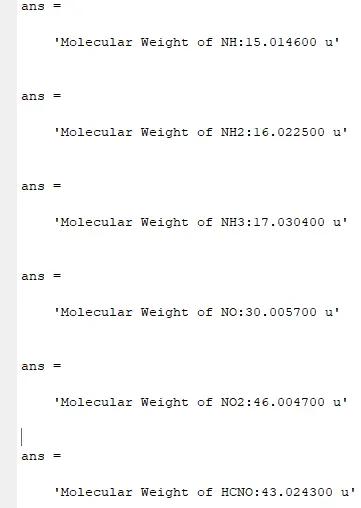
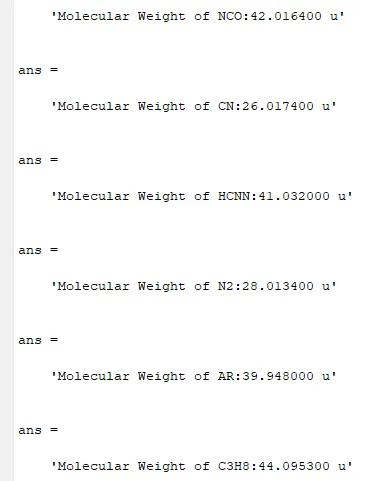
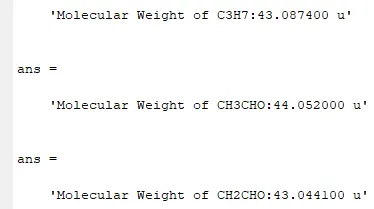
- Calculate the molecular weight of each species and display it in the command window.
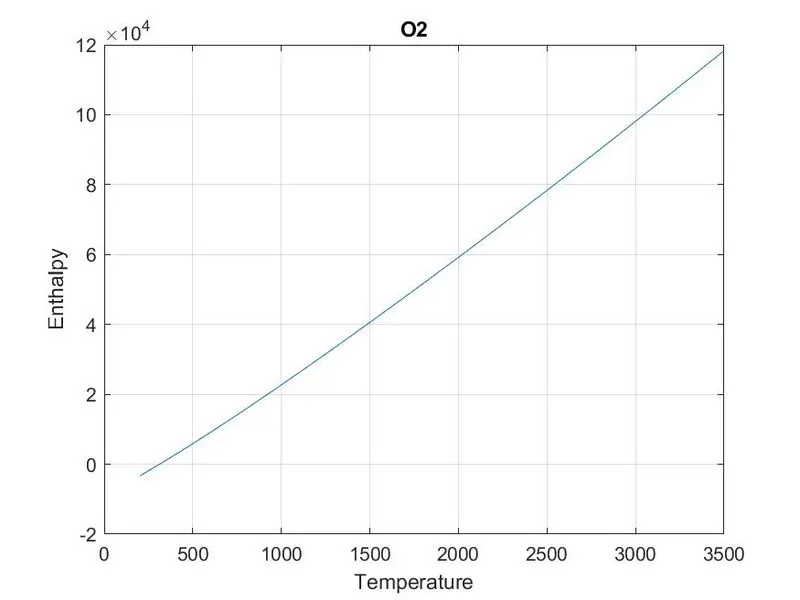
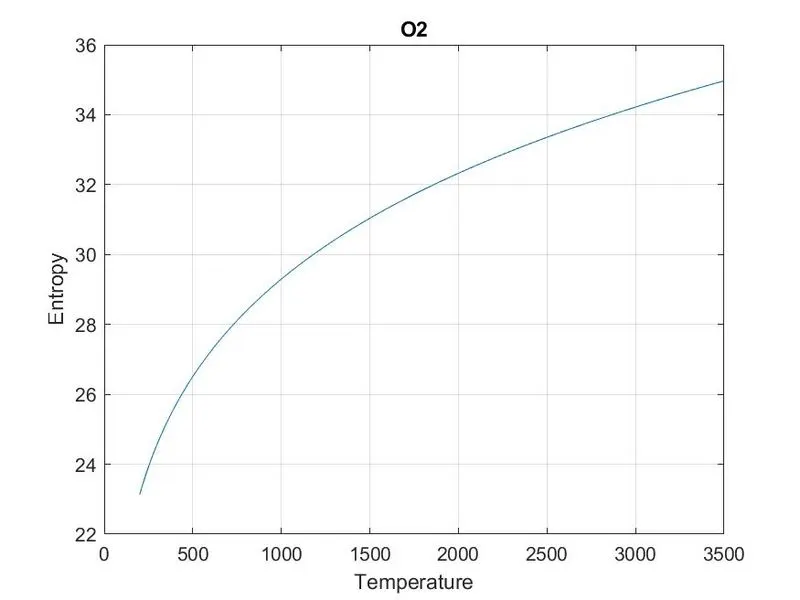
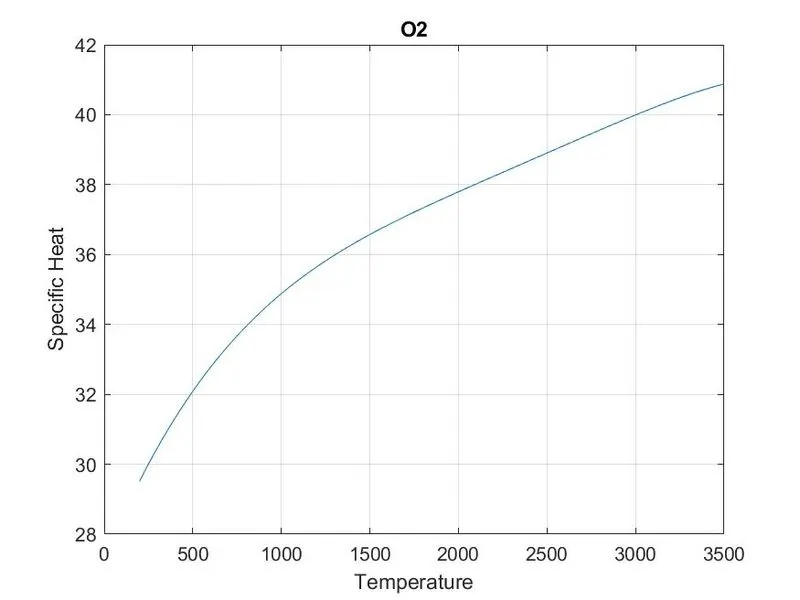
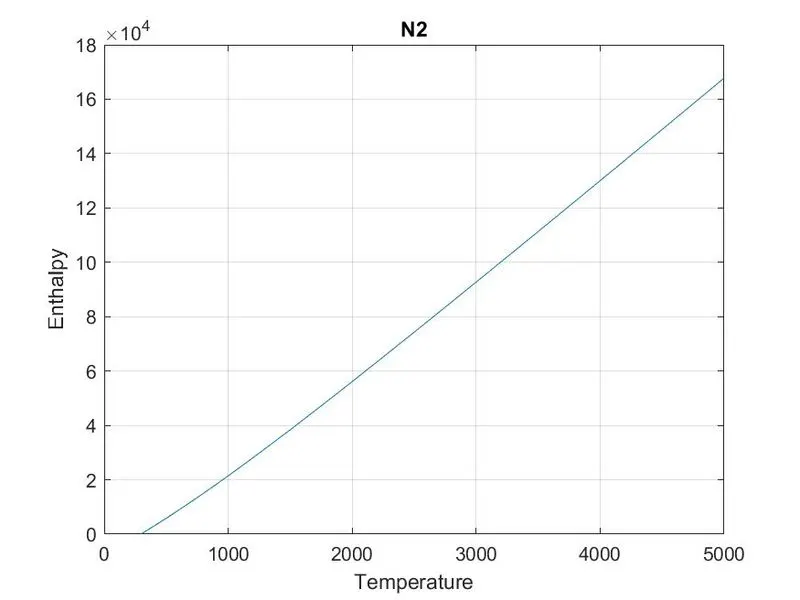
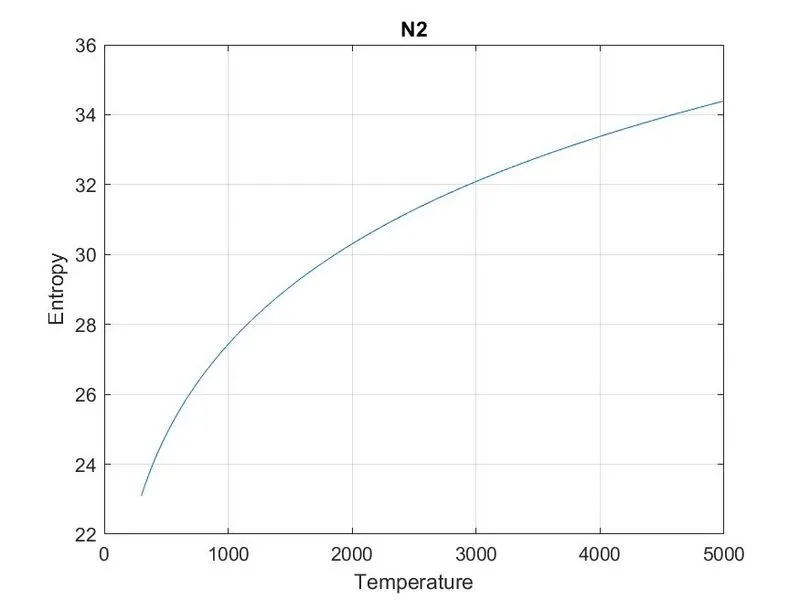
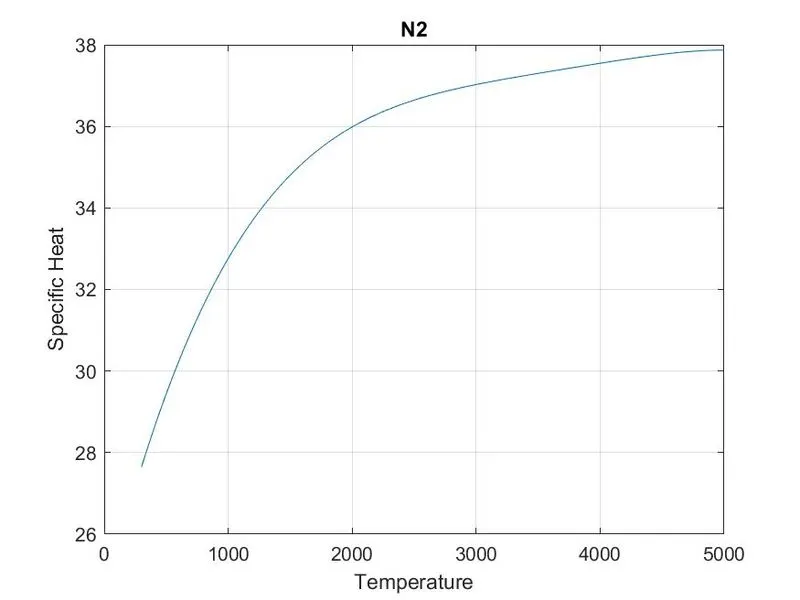
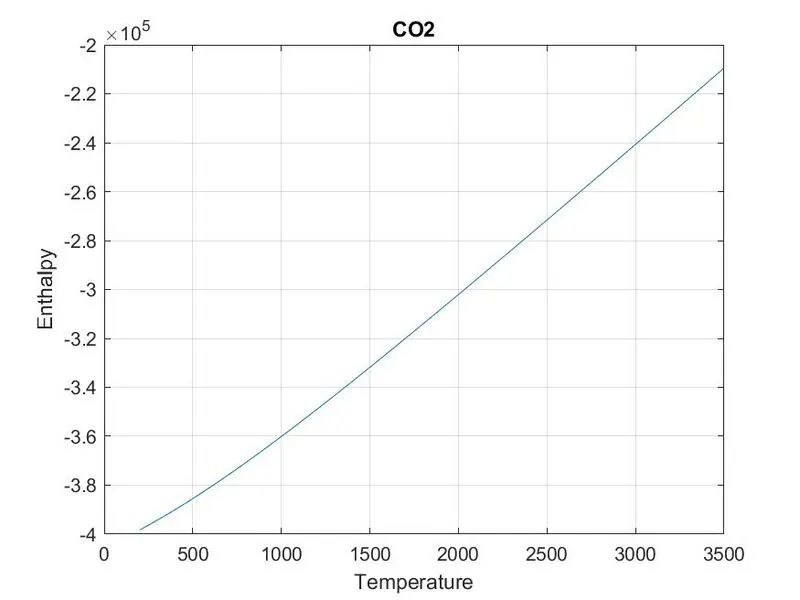
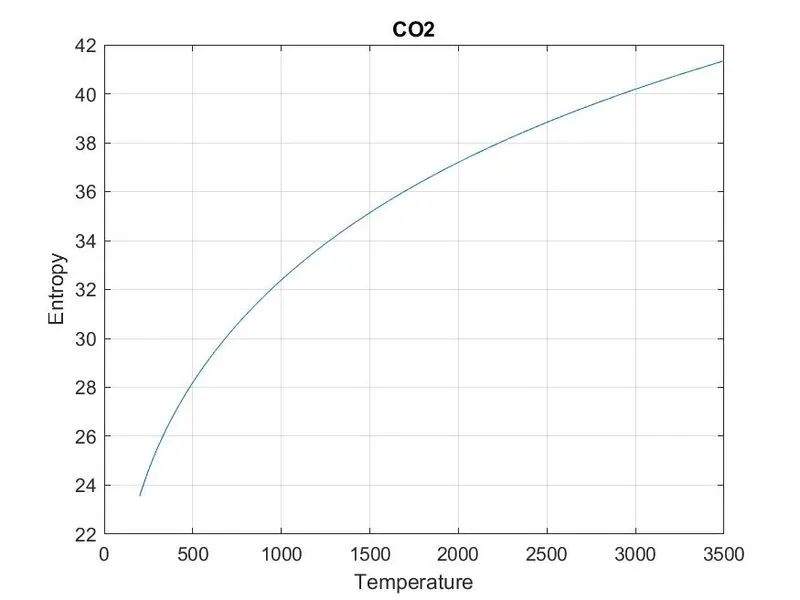
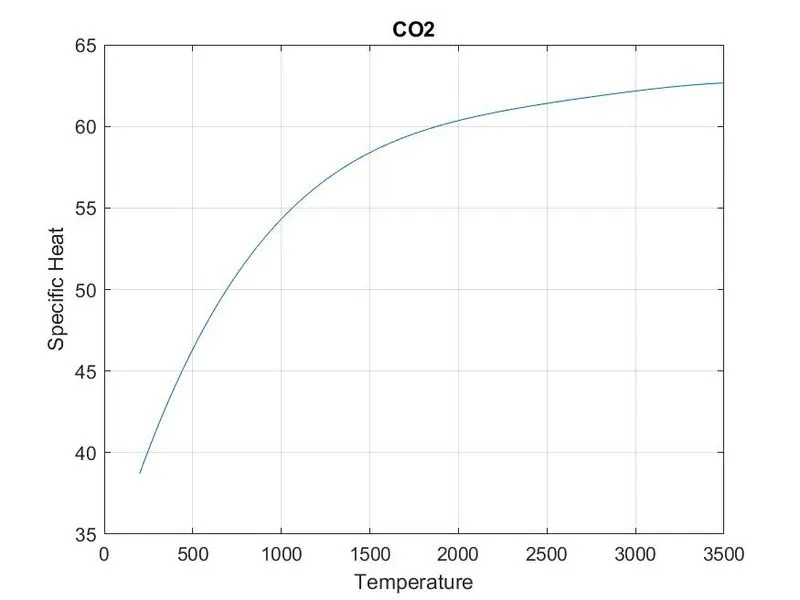
- Plot the Cp, Enthalpy and Entropy for the local temperature range (low temperature : high temperature) specific for each species.
- Save the plots as images with appropriate names and dump them in separate folders for each species with suitable name. All these should be generated automatically.
Attachments needed:
- Screenshot of the window where all the folders are saved.
- Plots for o2 and Co2 species (your program should be case insensitive, if it is going to take the species name as an input).
Programme Code with comments:
close all
clear all
clc

Data_File = fopen('THERMO.dat','r');

%% Skipping 1st header, reading and storing 2nd headder in "A".
fgetl(Data_File)                       % This will read 1st line & store nowhere.
A = fgetl(Data_File);                  % This will read 2nd line, & store it in "A".
A1 = strsplit(A,' ');                  % This will break the data in "A" wherever " "
                                         is present.

global_low_temp = str2num(A1{2});
global_mid_temp = str2num(A1{3});
global_high_temp = str2num(A1{4});

%% Reading and skipping next 3 lines.
for i = 1:3
fgetl(Data_File);
end

%% Now, reading species data.

for i = 1:53                            %Since, there are 53 species.

h = fgetl(Data_File);
h1 = strsplit(h,' ');
species_name = (h1{1});                 % Curly braces are used for strings "{}".
z = length(h1)                          % As we are sure that temp values are at (z-1),
                                          (z-2)&(z-3).
local_low_temp = str2num(h1{z-3});      % We can also do "str2num(h1{6})" for
                                         'oxygen'only.As,what if for some species in
                                          cell 6 there is an alphabet eg- OH.
local_high_temp = str2num(h1{z-2});     % or
local_mid_temp = str2double(h1{z-1});   % or
t1 = local_low_temp;
t2 = local_mid_temp;
t3 = local_high_temp;

% Getting 1st line co-efficients(a1-a5).
line1 = fgetl(Data_File);

a = strfind(line1,'E');                 % Finding all the position of "E" in line1, to
                                          locate entire no..
a1 = str2num(line1(1 : a(1)+3));
a2 = str2num(line1(a(1)+4 : a(2)+3));
a3 = str2num(line1(a(2)+4 : a(3)+3));
a4 = str2num(line1(a(3)+4 : a(4)+3));
a5 = str2num(line1(a(4)+4 : a(5)+3));

% Getting 2nd line co-efficients (a6-a10).
line2 = fgetl(Data_File);

a_1 = strfind(line2,'E');
a6 = str2num(line2(1 : a_1(1)+3));
a7 = str2num(line2(a_1(1)+4 : a_1(2)+3));
a8 = str2num(line2(a_1(2)+4 : a_1(3)+3));
a9 = str2num(line2(a_1(3)+4 : a_1(4)+3));
a10 = str2num(line2(a_1(4)+4 : a_1(5)+3));

% Getting 3rd line co-efficients (a11-a14).
line3 = fgetl(Data_File);

a_2 = strfind(line3,'E');
a11 = str2num(line3(1 : a_2(1)+3));
a12 = str2num(line3(a_2(1)+4 : a_2(2)+3));
a13 = str2num(line3(a_2(2)+4 : a_2(3)+3));
a14 = str2num(line3(a_2(3)+4 : a_2(4)+3));

%% Putting co-efficients in formula.
R = 8.314;
T = linspace(t1,t3,1000);

for k = 1:length(T)

if T(k) > t2
                   % Finding cp,H & S for Higher Temp.(t2-t3) co-efficients(a1-a7)
cp = R * (a1 + a2 * T + a3 * T.^2 + a4 * T.^3 + a5 * T.^4);
H  = R .* T .* (a1 + a2 .* (T/2) + a3 .* ((T.^2)/3) + a4 .* ((T.^3)/4) + a5 .* ((T.^4)/5) + (a6./T));
S  = R .* (a1 .* log(T) + a2 .* T + a3 .* ((T.^2)/2) + a4 .* ((T.^3)/3) + a5 .* ((T.^4)/4) + a7);

else               % Finding cp,H & S for Lower Temp.(t1-t2) co-efficients = (a8-a14)
cp = R * (a8 + a9 .* T + a10 .* T.^2 + a11 .* T.^3 + a12 .* T.^4);
H  = R .* T .* (a8 + a9 .* (T/2) + a10 .* ((T.^2)/3) + a11 .* ((T.^3)/4) + a12 .* ((T.^4)/5) + (a13./T));
S  = R .* (a8 .* log(T) + a9 .* T + a10 .* ((T.^2)/2) + a11 .* ((T.^3)/3) + a12 .* ((T.^4)/4) + a14);

end

end

%% Plotting the graphs
figure(1)
plot(T,cp)
grid on
title(species_name)
xlabel('Temperature')
ylabel('Specific Heat')

figure(2)
plot(T,H)
grid on
title(species_name)
xlabel('Temperature')
ylabel('Enthalpy')

figure(3)
plot(T,S)
grid on
title(species_name)
xlabel('Temperature')
ylabel('Entropy')

%% Creating Folder & Saving files.

 % Creating folder for respective species.
 mkdir(['C:MatlabSkill-LyncChallenges6 File Parsing-NASA Thermo dataFreshPlots',species_name]);

 % Saving the plots.
 cd(['C:MatlabSkill-LyncChallenges6 File Parsing-NASA Thermo dataFreshPlots',species_name]);  %" ' " is used to terminate the location.
 saveas(1,'Specific heat','jpg')
 saveas(2,'Enthalpy','jpg')
 saveas(3,'Entropy','jpg')


%% Finding molecular mass.

elements=['H','C','O','N','A'];
atomic_weight=[1.0079 12.0107 15.999 14.0067 39.948];
mol_mass=0;
for l=1:length(species_name)
    for m=1:length(atomic_weight)
        if strcmp(species_name(l),elements(m))
            mol_mass=mol_mass+atomic_weight(m);
            position=m;
        end
    end

n=str2double(species_name(l));
if n>1
    mol_mass=mol_mass+atomic_weight(position)*(n-1);

end
end
sprintf('Molecular Weight of %s:%f u',species_name,mol_mass)


end

%% Closing the file.

fclose(Data_File)
Molecular weight of all species:
Plot for 02, N2 and Co2:
o2
N2
C02
Screenshot of the directory where all folders are saved: