Project 1 - Parsing NASA thermodynamic data
AIM
To write a code in MATLAB to parse a NASA Thermodynamic file and obtain the thermodynamic and chemical properties of different species of the elements.
INTRODUCTION
1. PARSING:
Parsing, syntax analysis, or syntactic analysis is the process of analyzing a string of symbols, either in natural language, computer languages or data structures, conforming to the rules of a formal grammar. The term parsing comes from Latin pars (orationis), meaning part (of speech). Within computer science, the term is used in the analysis of computer languages, referring to the syntactic analysis of the input code into its component parts in order to facilitate the writing of compilers and interpreters. The term may also be used to describe a split or separation. [1]
2. PARSER:
A parser is a software component that takes input data (frequently text) and builds a data structure – often some kind of parse tree, abstract syntax tree or other hierarchical structure, giving a structural representation of the input while checking for correct syntax. The parsing may be preceded or followed by other steps, or these may be combined into a single step. The parser is often preceded by a separate lexical analyzer, which creates tokens from the sequence of input characters; alternatively, these can be combined in scanner-less parsing. Parsers may be programmed by hand or may be automatically or semi-automatically generated by a parser generator. Parsing is complementary to templating, which produces formatted output. These may be applied to different domains, but often appear together, such as the scanf/printf pair, or the input (front end parsing) and output (back end code generation) stages of a compiler. [1]
OBJECTIVES
- To write a function in MATLAB that extracts the 14 coefficients and calculates the enthalpy,entropy and specific heats for all the species in the data file.
- To calculate the molecular weight of each species and display it in the command window.
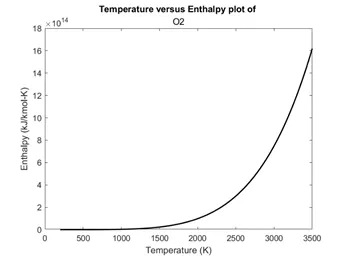
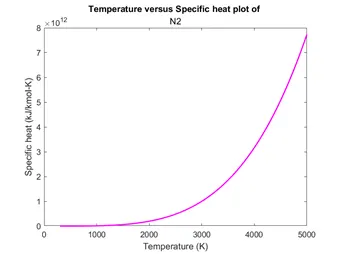
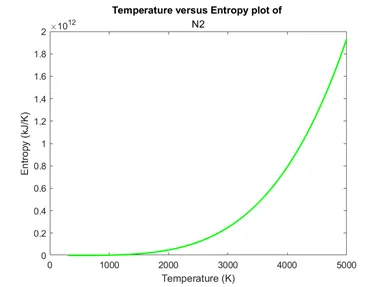
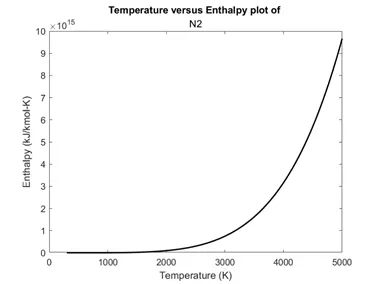
- To plot the Cp, Enthalpy and Entropy for the local temperature range (low temperature: high temperature) specific for each species.
- Save the plots as images with appropriate names and dump them in separate folders for each species with suitable name. All these should be generated automatically.
- Screenshot of the window where all the folders are saved is to be submitted.
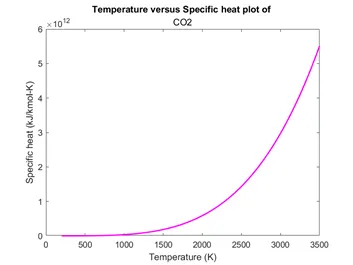
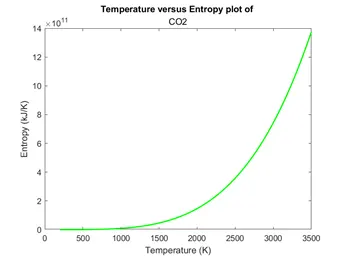
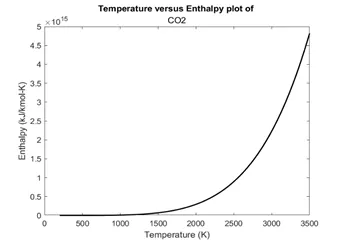
- Plots for o2, N2 and Co2 species are to be submitted.
PROGRAM – CODE WRITTEN IN MATLAB
PROBLEM STATEMENT:
A NASA Thermodynamic data file is named ‘THERMO.dat’ is given as:
https://drive.google.com/file/d/1AikCHDlz9s_fu8whE81qee_GD4AyYpCP/view
and the file has to be parsed. The data is to be extracted to evaluate the values of specific heat, enthalpy, and entropy for each species using their local temperature ranges. A plot is to be created to identify the variation of the found properties with respect to temperature. The following are the equations for specific heat, enthalpy, and entropy for high temperature ranges:
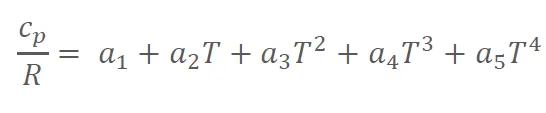


The following are the equations for specific heat, enthalpy, and entropy for low temperature ranges:



A code using the above set of equations is to be written to evaluate the Global maxima.
CODE SIMULATION:
%NASA FILE PARSING CHALLENGE

clear
close all
clc

f1 = fopen('THERMO.dat','r');
%LINE 1
heading = fgetl(f1);

%extracting global temperature range from LINE 2
%Extracting a line with fgetl command and splitting the string using
%strsplit command
temp = fgetl(f1);
A = strsplit(temp,' ');
%Converting the string to a number but the MATLAB suggested 'double' insted
%of 'number' for faster performance
global_low_temp = str2double(A{2}); %low
global_med_temp = str2double(A{3}); %medium
global_high_temp = str2double(A{4}); %high

%comments are extracted using the command fgetl
comment1 = fgetl(f1); %LINE 3
comment2 = fgetl(f1); %LINE 4
comment3 = fgetl(f1); %LINE 5


%To evaluate each species, its necessary to identify the number of species
%Number of species = 53
%Using the number of species the following are calculated

%EXTRACTING THE COEFFICIENTS,MOLECULAR WEIGHT ALONG WITH PLOTS IN WHICH
%TEMPERATURE OF EACH SPECIES VARIES WITH SPECIFIC HEAT,ENTHALPY AND ENTROPY
for i = 1 : 53
       tline1 = fgetl(f1); %creating tline using fgetl command
       Z = strfind(tline1,'G '); %finding the string by choosing the delimeter as G along with space
       b1 = strsplit(tline1,' '); %splitting string obtained from tline using space as delimeter
       c = b1(1); %string of species name
       species_name = char(c); %specifying the species name in characters

       %DISPLAYING THE MOLECULAR WEIGHT OF EACH SPECIES
       results = molecular_weight(species_name);

       %Identifying the LOCAL TEMPERATURE VALUES
       Z = strfind(tline1,'G '); %finding the string by choosing the delimeter as G along with space
       value = tline1(Z+4 : length(tline1)); %string of values that start with local temperature to the end of the line
       B = strsplit(value,' ');  %splitting the string for every space and assigning it to a cell array

       %Converting the cellarray string to a numerical value using str2double
       local_low_temperature = str2double(B{1}); %identifying the first temperature as low based on numerical value
       local_mid_temperature = str2double(B{3}); %identifying the third temperature as medium on numerical value
       local_high_temperature = str2double(B{2});  %identifying the second temperature as high on numerical value

       %Identifying the COEFFICIENTS
       %Coefficients a1 to a7 are high temperature coefficients
       %Coefficients a8 to a14 are low temperature coefficients
       tline2 = fgetl(f1); %extracting coefficients 1 to 5 from the line under consideration
       b2 = strfind(tline2,'E');%finding the string by choosing the delimeter as G thereby indexing positions
       %By adding appropriate numerical values to the indexed position,the
       %coefficients are obtained in the form of string and are further
       %converted into numerical values using str2double
         a1 = tline2(1:(b2(1)+3));
         A1 = str2double(a1); %high temperature coefficient
         a2 = tline2((b2(1)+4) : (b2(2)+3));
         A2 = str2double(a2); %high temperature coefficient
         a3 = tline2((b2(2)+4) : (b2(3)+3));
         A3 = str2double(a3); %high temperature coefficient
         a4 = tline2((b2(3)+4) : (b2(4)+3));
         A4 = str2double(a4); %high temperature coefficient
         a5 = tline2((b2(4)+4) : (b2(5)+3));
         A5 = str2double(a2); %high temperature coefficient


       tline3 = fgetl(f1); %extracting coefficients 6 to 10 from the line under consideration
       b3 = strfind(tline3,'E');%finding the string by choosing the delimeter as G thereby indexing positions
       %By adding appropriate numerical values to the indexed position,the
       %coefficients are obtained in the form of string and are further
       %converted into numerical values using str2double
         a6 = tline2(1:(b3(1)+3));
         A6 = str2double(a6); %high temperature coefficient
         a7= tline2((b3(1)+4) : (b3(2)+3));
         A7 = str2double(a7); %high temperature coefficient
         a8 = tline2((b3(2)+4) : (b3(3)+3));
         A8 = str2double(a8); %low temperature coefficient
         a9 = tline2((b3(3)+4) : (b3(4)+3));
         A9 = str2double(a9); %low temperature coefficient
         a10 = tline2((b3(4)+4) : (b3(5)+3));
         A10 = str2double(a10); %low temperature coefficient


       tline4 = fgetl(f1); %extracting coefficients 11 to 14 from the line under consideration
       b4 = strfind(tline4,'E');%finding the string by choosing the delimeter as G thereby indexing positions
       %By adding appropriate numerical values to the indexed position,the
       %coefficients are obtained in the form of string and are further
       %converted into numerical values using str2double
         a11 = tline2(1:(b4(1)+3));
         A11 = str2double(a11); %low temperature coefficient
         a12= tline2((b4(1)+4) : (b4(2)+3));
         A12 = str2double(a12); %low temperature coefficient
         a13 = tline2((b4(2)+4) : (b4(3)+3));
         A13 = str2double(a13); %low temperature coefficient
         a14 = tline2((b4(3)+4) : (b4(4)+3));
         A14 = str2double(a14); %low temperature coefficient

         %Calculating the SPECIFIC HEAT, ENTHALPY, ENTROPY values for
         %HIGH and LOW TEMPERATURE RANGES
         %Creating an array starting from local low temperature to local
         %high temperatrue with 1000 intervals in between using linspace
         T = linspace(local_low_temperature,local_high_temperature,1000);
         [c_p,h,s]= values(T,A1,A2,A3,A4,A5,A6,A7,A8,A9,A10,A11,A12,A13,A14,local_mid_temperature);


         %FOLDER CREATION TO SAVE THE PLOTS USING MKDIR COMMAND
         %MKDIR command creates a folder named NASA Species_(name of the
         %species as per the loop)
         mkdir(['C:\Users\laasy\OneDrive\Pictures\Camera Roll\NASA Species_',species_name]);


         %PLOTTING
         %TEMPERATURE VERSUS SPECIFIC HEAT
         figure(1);
         plot(T,c_p,'linewidth',1.5,'color','m');
         title('Temperature versus Specific heat plot of ',species_name);
         xlabel('Temperature (K)');
         ylabel('Specific heat (kJ/kmol-K)');
         %TEMPERATURE VERSUS ENTHALPY
         figure(2);
         plot(T,h,'linewidth',1.5,'color','k');
         title('Temperature versus Enthalpy plot of ',species_name);
         xlabel('Temperature (K)');
         ylabel('Enthalpy (kJ/kmol-K)');
         %TEMPERATURE VERSUS ENTROPY
         figure(3);
         plot(T,s,'linewidth',1.5,'color','g');
         title('Temperature versus Entropy plot of ',species_name);
         xlabel('Temperature (K)');
         ylabel('Entropy (kJ/K)');


         %As it is necessary to save each species data into a separate
         %folder the following steps are followed;

         %cd command is used to create a new folder to acoomodate 3 plots
         cd(['C:\Users\laasy\OneDrive\Pictures\Camera Roll\NASA Species_',species_name]);

         %SAVING THE PLOTS using saveas command
         saveas(1,'Temperature versus Specific heat','png');
         saveas(2,'Temperature versus Enthalpy','png');
         saveas(3,'Temperature versus Entropy','png');

         %To change the current folder back to the original folder,using the stored path.
         %cd command is used and it displays the new current folder.
         cd ..

         %the two dots beside the cd is used to determine one level up from
         %the current folder and IS OPTIONAL
end
 fclose(f1);
EXPLANATION:
- The code begins with the opening if the given file, ‘THERMO.dat’ using fopen command.
FOPEN COMMAND: This command is used to open file or obtain information about open files.
Syntax:
fileID = fopen(filename,permission)
This syntax opens the file , filename, with the type of access specified by permission for binary read access, and returns an integer file identifier equal to or greater than 3. MATLAB® reserves file identifiers 0, 1, and 2 for standard input, standard output (the screen), and standard error, respectively. If fopen cannot open the file, then fileID is -1. Name of the file to open, including the file extension, specified as a character row vector or a string scalar. If the file is not in the current folder, filename must include a full or a relative path.[2]
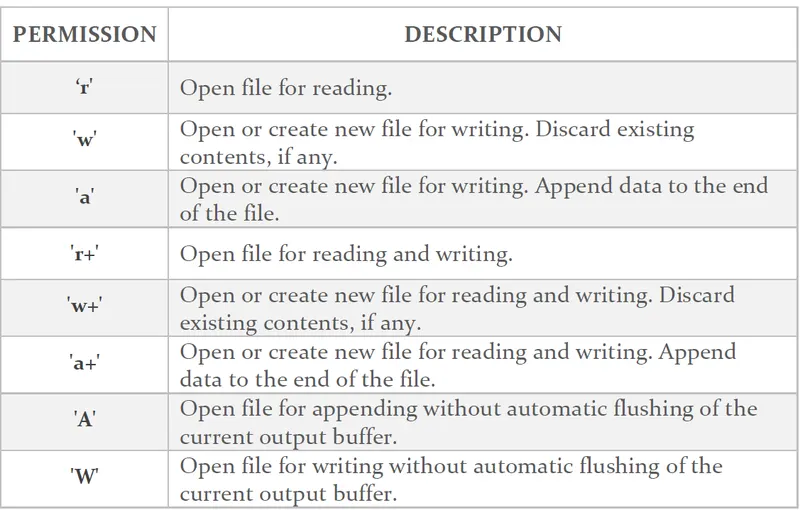
Table 1. Tabulation of various permissions for using fopen command. [2]
- ‘f1’ is the file handler or pointer to the file output, which is in the form of text, and the permission given to fopen is to read the file.
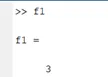
- In command window, f1 displays a positive number which indicates that the desired action is successfully performed as shown below.
- To extract the first line from the file, a command named ‘fgetl’ is used. A pointer named heading is used to store the data from the first line.
FGETL COMMAND: This command is used to read line from file and removing newline characters.
Syntax:
This syntax returns the next line of the specified file, removing the newline characters. If the file is nonempty, then fgetl returns tline as a character vector. If the file is empty and contains only the end-of-file marker, then fgetl returns tline as a numeric value -1. [3]
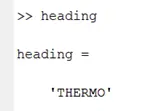
- In command window, heading displays a character vector ‘THERMO’ which indicates that the desired action is successfully performed as shown below.
- To read the next line, fgetl command is used on f1 with a different pointer ‘temp’. The purpose of the pointer temp is to extract the global temperature range of the species available in the file under evaluation.
- Everytime fgetl() is used, it points to the succeeding line.
- A command named strsplit is used to split the character vector/string of data extracted by tline at a desired delimiter.
STRSPLIT COMMAND: This command is used to split string or character vector at specified delimiter.
Syntax:
This syntax splits str at the delimiters specified by delimiter. If str has consecutive delimiters, with no other characters between them, then strsplit treats them as one delimiter. For example, both strsplit('Hello,world',',') and strsplit('Hello,,,world',',') return the same output i.e. [4]
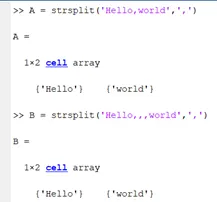
- In the current code, space is used as a delimiter. The reason behind this consideration is that the second line, as shown below, has two types of elements namely space and numerical values. It is necessary to obtain the numerical value which encompass the global temperature range and hence space is used as delimiter.

- After the successful extraction of numerical values, these remain as strings/character vector. This must be converted into a numerical value for further evaluation. Therefore, a command named str2double is used.
STR2DOUBLE COMMAND: This command is used to convert strings to double precision values.
Syntax:
This syntax converts the text in str to double precision values. str contains text that represents real or complex numeric values. str can be a character vector, a cell array of character vectors, or a string array. If str is a character vector or string scalar, then X is a numeric scalar. If str is a cell array of character vectors or a string array, then X is a numeric array that is the same size as str.
Text that represents a number can contain digits, a comma (thousands separator), a decimal point, a leading + or - sign, an e preceding a power of 10 scale factor, and an i or a j for a complex unit. You cannot use a period as a thousand’s separator, or a comma as a decimal point. If str2double cannot convert text to a number, then it returns a NaN value. [5]
- On running the A in the command window, it is observed that A is a 1 x 4 cell array as shown below. A cell array in MATLAB is a special data structure that can store data of different type unlike the arrays that can only accommodate elements of only one type.
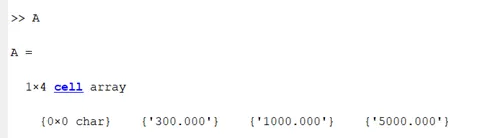
- The first cell has no character and from the data file, it is clearly a space. When str2double command is run on the first cell of A, the following is observed.
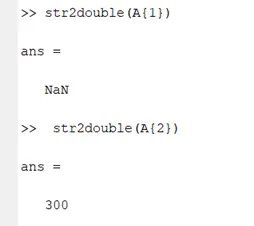
- When the first cell is operated on str2double, the output observed is NaN. This indicates that str2double cannot convert text into a number and thus returns Nan. When the same operation is performed on the second cell the global low temperature is obtained.
- While indexing the positions of the values from A to str2double, the global temperature range is obtained as follows:
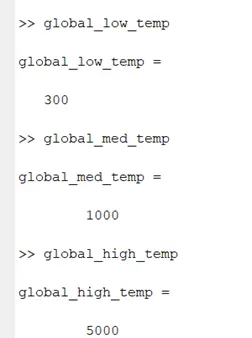
- The next three lines can be read using fgetl() command on file index ‘f1’ using pointers ‘comment1, comment2, comment3’. These lines do not contain any numerical value.
- To evaluate the number of species, a code is written separately as follows:
-
clear close all clc f1 = fopen('THERMO.dat','r'); %LINE 1 heading = fgetl(f1); %extracting global temperature range from LINE 2 temp = fgetl(f1); A = strsplit(temp,' '); global_low_temp = str2double(A{2}); %low global_med_temp = str2double(A{3}); %medium global_high_temp = str2double(A{4}); %high %comments are extracted using the command fgetl comment1 = fgetl(f1); %LINE 3 comment2 = fgetl(f1); %LINE 4 comment3 = fgetl(f1); %LINE 5 %FINDING NUMBER OF SPECIES n = 0; %constant to find total number of species tline1 = fgetl(f1); %assigning each file to tline %While loop is used to check if tline is a character. It returns 1 if tline is a character and 0 if it is not while ischar(tline1) tline1 = fgetl(f1); n = n+1; end total_number_of_species = (n)/4; -
In this program, the first 5 lines are already described. The remaining format of the file has groups of four lines and first line indicating the species and the local temperature range and the consecutive three lines contain the coefficients.
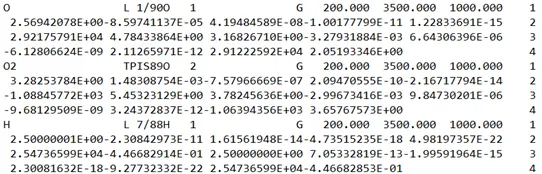
A while loop is implemented to evaluate the number of species in the file. While loop is used to check if the tline1 which is a pointer for fgetl(f1) is a character nor not using ‘ischar’ command.
ISCHAR COMMAND: This command is used to determine if input is character array.
Syntax:
This syntax returns logical 1 (true) if A is a character array and logical 0 (false) otherwise. Input array, specified as a scalar, vector, matrix, or multidimensional array. A can be any data type. [6]
Initially, a constant ‘n’ is assumed and initially, its value is kept at zero. Every time, the while loop executes, the value of n is incremented by a value of 1. This continues till the while loop runs out of lines to evaluate.
By then, the value of n will equal the number of lines that the while loop evaluates excluding the first five lines which are not a part of while loop. ‘n’ will purely indicate the number of lines of species data.
To evaluate the number of species, the value of ‘n’ is divided by 4 and is stored in a variable ‘total_number_of_species’ as shown below.
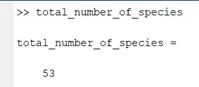
- To extract the coefficients of each species, it is necessary to obtain the number of species. Each species in the data file has 14 coefficients of which the first seven are high temperature coefficients and the second seven are low temperature coefficients. ‘For’ loop is used to extract all the coefficients of every species, which are 53 in number.
- For each iteration in the for loop, it is mandatory to check each line for coefficients and extract them if present. And to achieve this, fget(f1) is used. In one set of species, four lines are read indexing each with a specific pointer.
- As the first line contains the species name and the local temperature range that are necessary, it is split using two delimiters, one being a space and other being the ‘G ‘ (G along with a space).
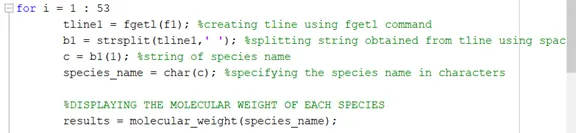
- The first line is described as ‘tline1’ and strsplit command is used along with space as delimiter to identify the species. The output from the strsplit is stored in ‘b1’. On indexing the first location on b1 i.e., b1(1) the species is obtained and is stored in ‘c’. The species is then read as a character array and is stored in ‘species_name’.
CHAR COMMAND: This command is used to describe the character array. A character array is a sequence of characters, just as a numeric array is a sequence of numbers. A typical use is to store a short piece of text as a row of characters in a character vector.
Syntax:
This syntax converts array A into a character array. [7]
- Molecular weight of each of the species is found using the function ‘molecular_weight’ that uses a single input which is the name of the species i.e., species_name. The function to calculate the molecular weight is written as follows:
function mw = molecular_weight(species_name)
elements = ['H' 'C' 'N' 'O' 'S' 'A']; %listing the elements with which the species are made
atomic_mass = [1.0079 12.011 14.0062 15.9994 32.066 39.948]; %array of atomic masses of each element in their monoatomic state except for air
%choosing a constant mw that determines molecular weight
mw = 0; %initializing its value as zero
%choosing a constant 'n' and initializing its value as zero
n = 0;
for i = 1: length(species_name) %Identifying the species
    for j = 1 : length(elements) %Identifying the number of elements of species match the elements
        if strcmp(species_name(i),elements(j)) %comapring the species and elements to identify the commonness
            mw = mw + atomic_mass(j); %while identifying the similarity,calculating the atomic weight
            k = j; %assigning j value to k to identify the pointer that identifies the similarity between species_name and elements
        end

    end

        %When there are numbers in the species, the molecular weight varies
        %accordingly as per the theory. To incorporate that, the numerical
        %admist the formula is identified using str2double in the species
        n = str2double(species_name(i));
        %if there is a number, then the number is assigned to 'n' and if
        %the value of the number is greater than one, the atomic weight of the element is
        %repeated (n-1)
        if n>1
            mw = mw + (atomic_mass(k)*(n-1));
            %fprintf('The Molecular weight of  %d \n',atomic_mass(k))
        end

   end
 fprintf('\n The Molecular weight of %s is %f \n',species_name,mw);
end
Initially, the atoms with which the elements are made are identified and are listed under an array named elements. Their corresponding atomic masses are identified and are listed in an array atomic_mass. A constant ‘mw’ is chosen to determine the molecular weight and initially it is assumed to take the value of ‘0’.
Another constant ‘n’ is chosen to identify the number of times an element in the species is repeated and calculate the molecular weight accordingly and initially its value is set to zero.
The logic to find the molecular weight of the species is described as follows:
Initially, the species and its length is identified then it is compared with the elements array to check the elements that species is made of. Once there is a match, the atomic mass of each individual element that the species is made of is added to obtain the molecular weight. But if there is a number in the species, the number is identified and the element preceding the number is multiplied with required number of times to obtain the missing weight to the already computed molecular weight.
A for loop is used using two loop counter variables as:
For i = 1: length(species_name)
For j = 1 : length(elements)
Since species_name and elements are both character arrays, a command named strcmp is used.
STRCMP COMMAND: This command is used to compare strings.
Syntax:
This syntax compares s1 and s2 and returns 1 (true) if the two are identical and 0 (false) otherwise.
Text is considered identical if the size and content of each are the same. The return result tf is of data type logical.The input arguments can be any combination of string arrays, character vectors, and cell arrays of character vectors. [8]
‘if’ condition is used to evaluate the rightness of the comparison i.e., if there is a similarity in the species_name and elements, the code proceeds to evaluate the molecular weight of the matching elements present in both the arrays. This loop continues until the comparison doesn’t stand true. While in the ‘if’ loop, the value of the loop counter variable is assigned to a variable k. Once the code comes out of the if loop, the next direction is for it to convert the species_name(i) into a number and is performed by str2double and is assigned to n. Again an ‘if’ condition is used to identify the numerical value of n obtained from the string/character vector species_name(i) and if its value is greater than one then, the kth element is selected and its multiplied by (n-1) and is added to the already obtained molecular weight. This results in a revised molecular weight keeping in mind the repetitions of the element in the species name.The kth element is chosen because, k=j and the jth element is the one that undergoes the comparison test under ‘if’ condition. And that stands very appropriate for evaluation. If this element is not chosen, the value of j may indicate the element that would not have passed the comparison test and ultimately reading to the wrong evaluation of molecular weight.
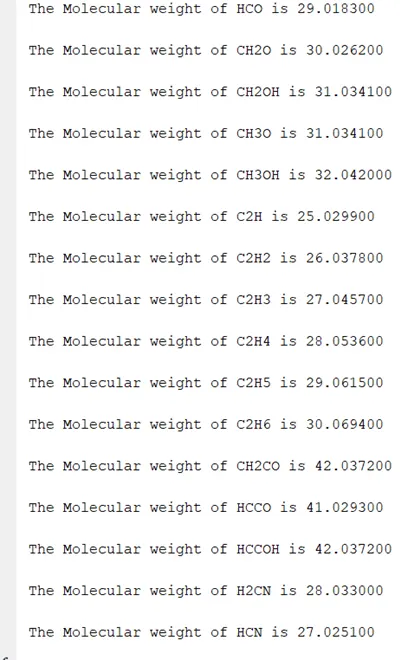
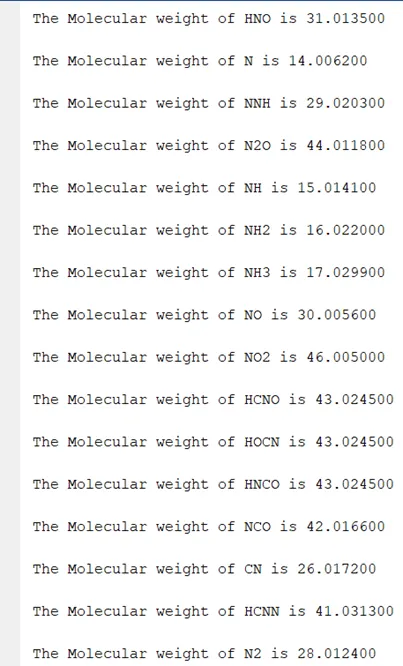
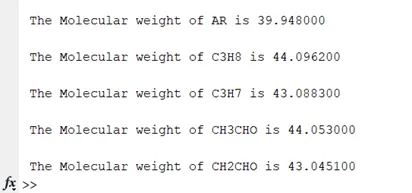
And finally, fprintf is used to print the molecular weight of each species onto the command window as shown below:
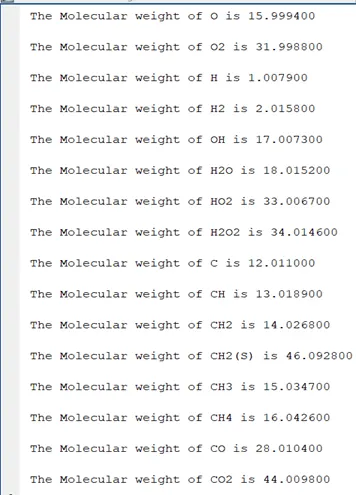
- To identify the local temperature range, the same line i.e., first line of the species is taken, and the delimiter is given as ‘G ‘.
- When observed clearly, in the first line, it takes three spots after G to reach the first value of the local temperature range. i.e. from G, the first local temperature is at fourth position and therefore, it is necessary to start indexing from that position to extract the local temperature range.
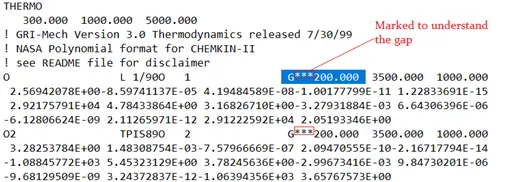
- Therefore, after the string split stored in Z, the tline1 length of evaluation is varied from Z+4 to the remaining length of tline1. As a result, all the local temperatures are extracted as a string and are stored in ‘value’.
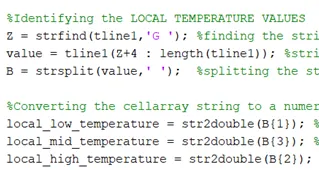
- Now, the string ‘value’ is split using strsplit and space as delimiter and stored in B which is a cell array. The local temperatures are obtained using str2double on B.
- Another line tline2 is created using fgetl on f1. And consequently, the strdfind command is used to find the delimiter ‘E’ in the tline2 which are stored in b2. This is used to extract the coefficients present in the second line that constitute the high temperature coefficients.
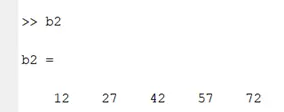
STRFIND COMMAND: This command is used to find strings within other strings.
Syntax:
This syntax searches str for occurrences of pat. The output, k, indicates the starting index of each occurrence of pat in str. If pat is not found, then strfind returns an emptarray, []. The strfind function executes a case-sensitive search. If str is a character vector or a string scalar, then strfind returns a vector of type double. If str is a cell array of character vectors or a string array, then strfind returns a cell array of vectors of type double. [9]
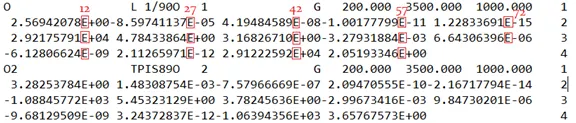
- Since b2 gives the locations of E, it is easy to vary the length of the string to extract coefficients. Therefore, the lengths of the string coefficients will vary as:
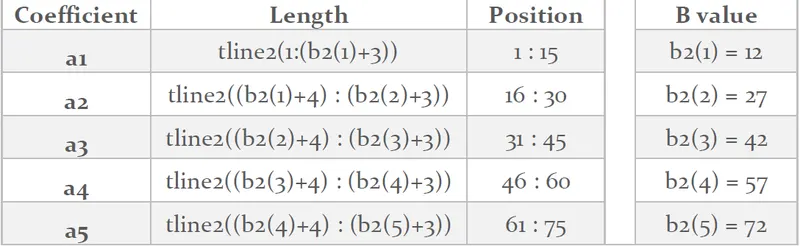
- This will yield the appropriate results as follows:
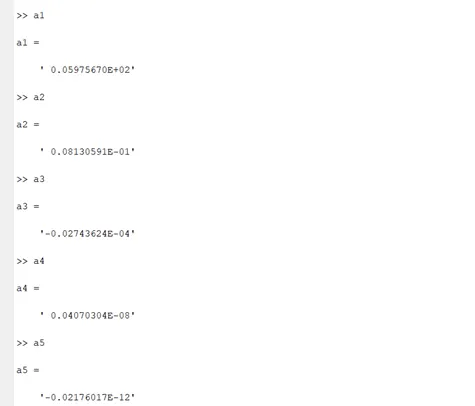
But these values are in the form of strings. Using the command str2double, the following strings are converted into numbers. And are stored in A1, A2, A3, A4 and A5 respectively.
- Moving to the next line, fgetl() command is used under new pointer tline3. The same procedure is followed to obtain the next five coefficients.
- The third line has only 4 coefficients and therefore indexing position is carried upto b(4)+3.
- In this way, all the fourteen coefficients of each species are obtained.
- To evaluate the properties like specific heat, enthalpy and entropy, a numerical array named T is created that contains local low temperature and local high temperature as limits with 1000 divisions.
- A function is invoked that calculates the values of each of the properties for all the species. It has the inputs of local mid temperature and all the fourteen coefficients.
- The function that calculates the specific heat, enthalpy and entropy is written as follows:
%FUNCTION TO CALCULATE SPECIFIC HEAT
function [c_p,h,s] = values(T,A1,A2,A3,A4,A5,A6,A7,A8,A9,A10,A11,A12,A13,A14,local_mid_temperature)
R = 8.314; %universal gas constant in kJ/k-mol-K

for j = 1: length(T)
             if T(j) > local_mid_temperature
                c_p = (A1 + (A2.*T) + (A3.*T.^2) +(A4.*T.^3) +(A5.*T.^4)).*R;
                h = (A1 + ((A2.*T)/2) + ((A3.*T.^2)/2) + ((A4.*T.^3)/3) + ((A5.*T.^4)/4) + (A6.*T)).*T.*R;
                s = ((A1.*log(T)) + (A2.*T) + ((A3.*T.^2)/2) + ((A4.*T.^3)/3) + ((A5.*T.^4)/4) + A7).*R;
             else
                c_p = (A8 + (A9.*T) + (A10.*T.^2) +(A11.*T.^3) +(A12.*T.^4)).*R;
                h = (A8 + ((A9.*T)/2) + ((A10.*T.^2)/2) + ((A11.*T.^3)/3) + ((A12.*T.^4)/4) + (A13.*T)).*T.*R;
                s = ((A8.*log(T)) + (A9.*T) + ((A10.*T.^2)/2) + ((A11.*T.^3)/3) + ((A12.*T.^4)/4) + A14).*R;
             end
         end
end
- An array of c_p,h,s is created. If the temperature from the array T is greater than the local_mid_temperature then it falls into calculating the three properties using the prescribed formula for high temperature coefficients or else the values are computed using the low temperature coefficients. The value of universal gas constant is invoked.
- It is extremely mandatory to use dot product to compute multiplication in the written equations since arrays are used.
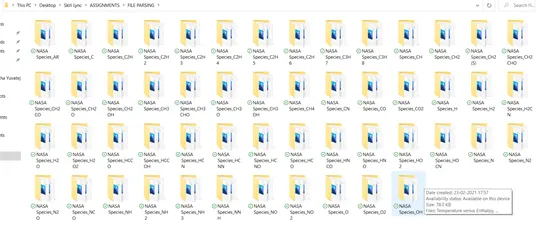
- The objective of the program is make folders for each species saving the variations of specific heat, enthalpy and entropy with temperature. This is achieved by using a new command named mkdir.
MKDIR COMMAND: This command is used to make a new folder.
Syntax:
This syntax creates folderName in parentFolder. If parentFolder does not exist, MATLAB attempts to create it. If folderName exists, MATLAB® issues a warning. If the operation is not successful, mkdir throws an error to the Command Window. [10]
- In the current case, a detailed path of where the folders must be created is chosen based on the comfort of the programmer. Each folder name is named as NASA Species_(name of the species). To achieve this the following is performed:
mkdir(['C:\Users\laasy\OneDrive\Pictures\Camera Roll\NASA Species_',species_name]);
- The path of the folder chosen is quoted along with the name of the folder to be created is written and species name is added at the end of each corresponding folder. This enables better understanding of the location of the plots.
- Following this, three separate plots are created to depict the variation of the desired properties with respect to the temperature.
- To save the required plots of the first species in the first folder, it is necessary to switch to another folder to save the required data accordingly. To perform this task, cd() command is used.
CD COMMAND: This command is used to change current folder.
Syntax:
This syntax changes the current folder to newFolder. Folder changes are global. Therefore, if you use cd within a function, the folder change persists after MATLAB® finishes executing the function. New folder path to which you want to change the current folder, specified as a character vector or string scalar. If newFolder is a string, enclose it in parentheses. For example, cd("FolderName"). Valid values include a full or relative path or one of these values.
If newFolder contains spaces, enclose it in single quotation marks. For example, cd 'Folder Name'. [11]
- After defining the plots, a saveas command is used to save these plots.
SAVEAS COMMAND: This command is used to save figure to specific file format.
Syntax:
saveas(fig,filename,formattype)
This syntax creates the file using the specified file format, formattype. If you do not specify a file extension in the file name, for example, 'myplot', then the standard extension corresponding to the specified format automatically appends to the file name. If you specify a file extension, it does not have to match the format. saveas uses formattype for the format, but saves the file with the specified extension. Thus, the file extension might not match the actual format used. [12]
- The saveas command is used like:
saveas(1,'Temperature versus Specific heat','png');
The figure number is chosen and titled with temperature versus specific heat and saved in png format.
- Similarly the rest two figures are saved.
- To change the current folder back to the original folder using the stored path, cd command is used and it displays the new current folder.
CD COMMAND: This command is used to change current folder. [11]
Syntax:
cd displays the current folder. Adding two dots beside the cd is to determine one level up from the existing folder. It in this current case, is an option feature to be employed.
- The for loop from 1 to 53 is now ended.
- Fclose command is used on f1 to close the file.
RESULT
- A function in MATLAB that extracts the 14 coefficients and calculates the enthalpy,entropy and specific heats for all the species in the data file is successfully writte. Molecular weight of each sepcies is obtained and displayed in the command window.
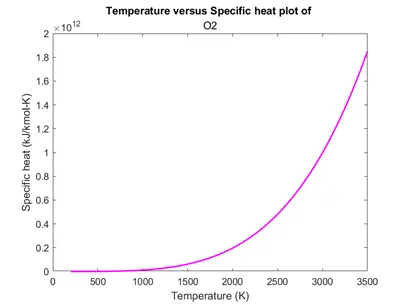
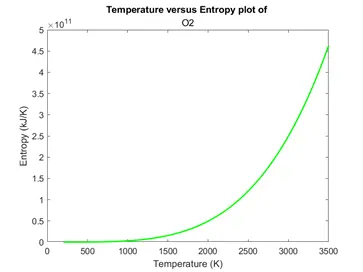
- Plots for varying species heat, enthalpy and entropies with temperature for each species are successfully obtained.
- The plots as images with appropriate names saving them in separate folders for each species with suitable name are generated automatically.
- Screenshot of the window where all the folders are saved is to be submitted.
- Plots for o2, N2 and Co2 species are to be submitted.
BIBLIOGRAPHY
- https://en.wikipedia.org/wiki/Parsing
- https://in.mathworks.com/help/matlab/ref/fopen.html
- https://in.mathworks.com/help/matlab/ref/fgetl.html
- https://in.mathworks.com/help/matlab/ref/strsplit.html
- https://in.mathworks.com/help/matlab/ref/str2double.html
- https://in.mathworks.com/help/matlab/ref/ischar.html
- https://in.mathworks.com/help/matlab/ref/char.html
- https://in.mathworks.com/help/matlab/ref/strcmp.html
- https://in.mathworks.com/help/matlab/ref/strfind.html
- https://in.mathworks.com/help/matlab/ref/mkdir.html
- https://in.mathworks.com/help/matlab/ref/cd.html
- https://in.mathworks.com/help/matlab/ref/saveas.html