Parsing NASA thermodynamic data using MATLAB
Week 4 - File Parsing using MATLAB
AIM:
Write a code logic to exact the co-efficients from a NASA Thermodynamic data using MATLAB and execute the code to plot the graph for Specific heat, Enthalpy and Entropy w.r.t. Temperature. Also, write a logic to calculate the molecular weight of the given species.
OBJECTIVE:
(1) Write a function that extracts the 14 coefficients to calculates the enthalpy, entropy and specific heats for all the species in the data file.
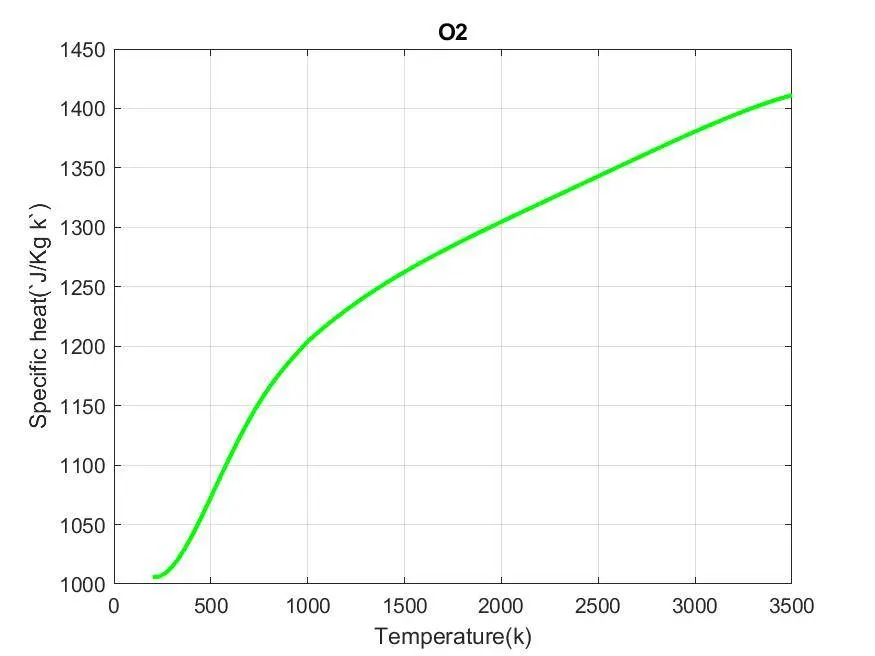
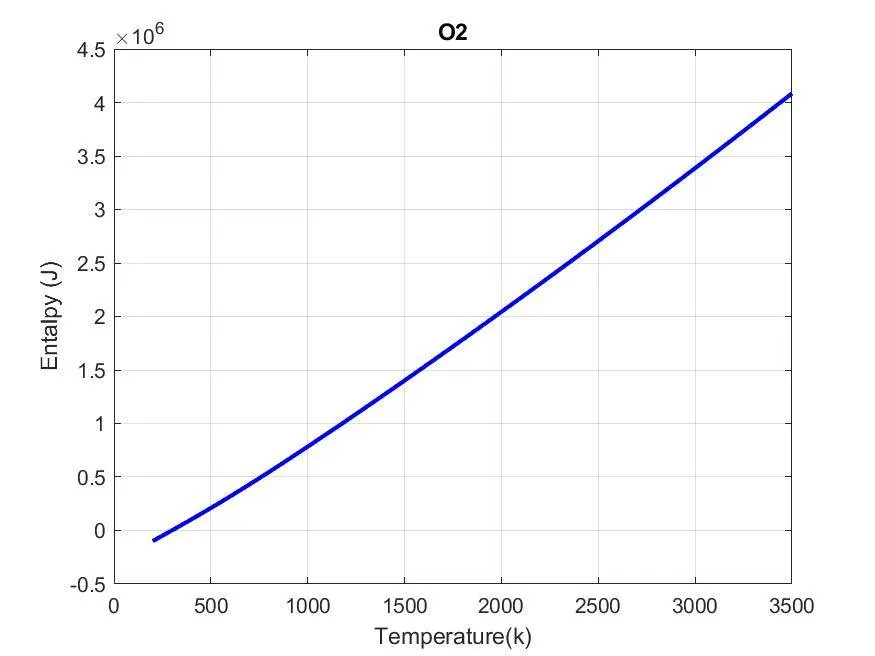
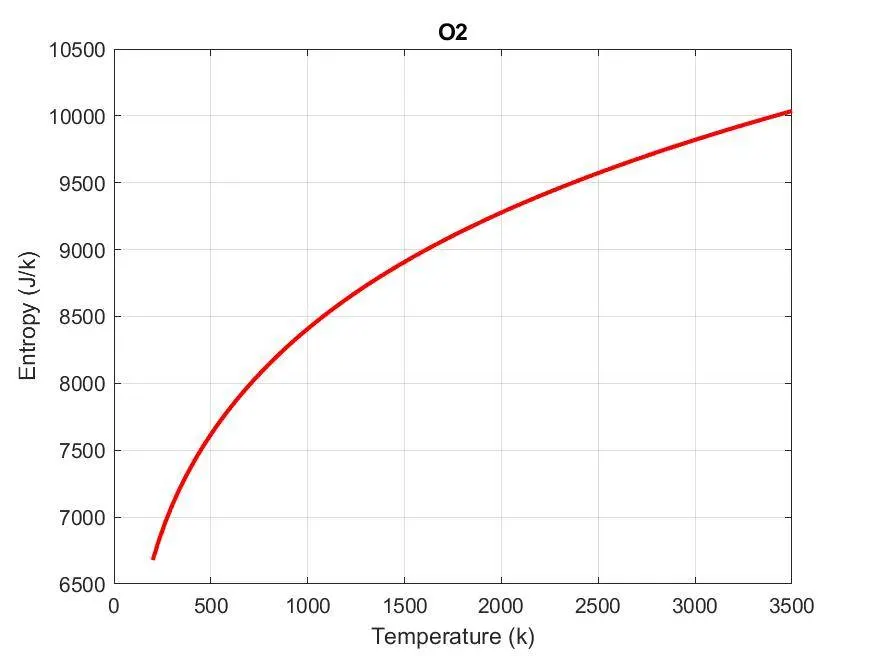
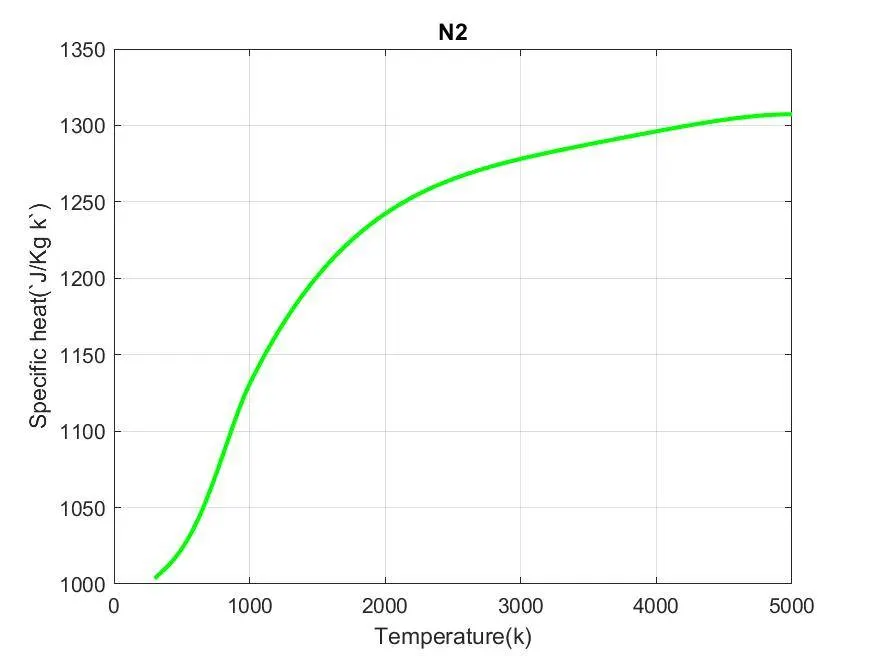
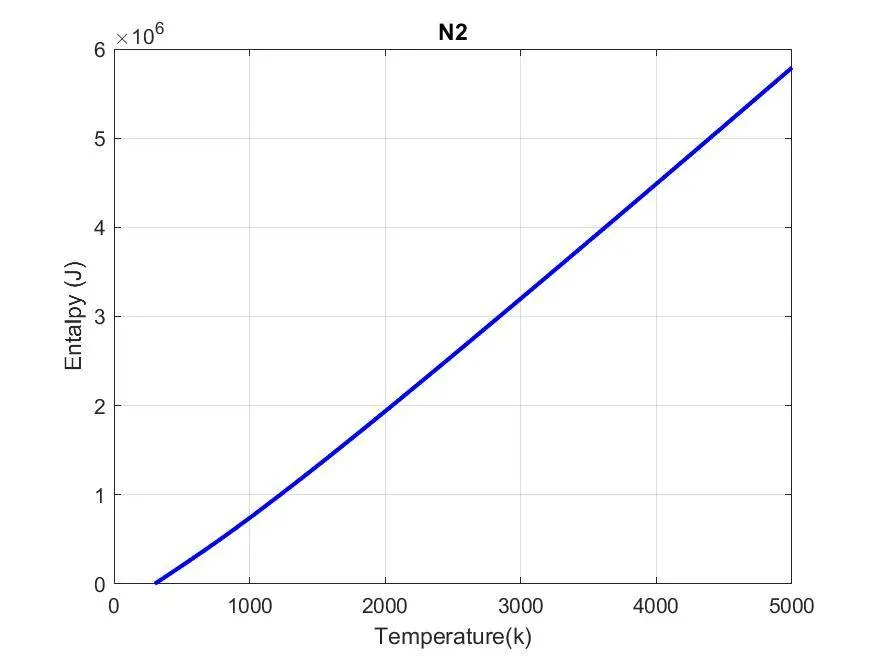
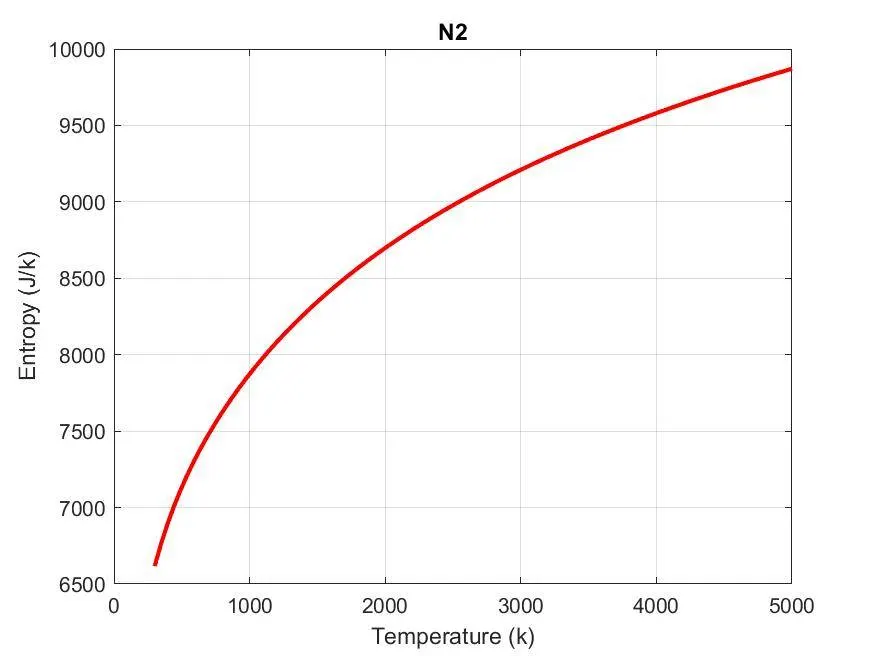
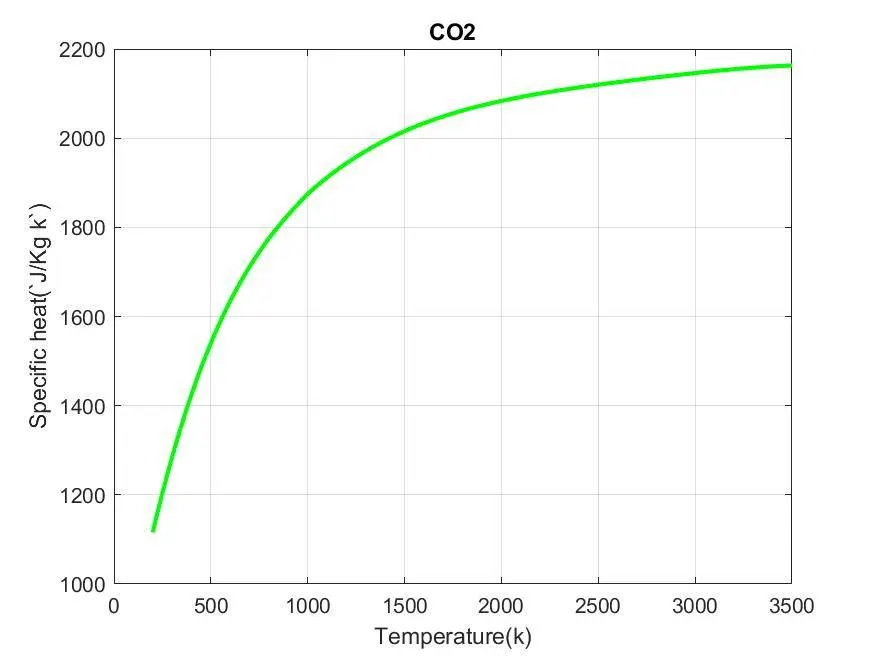
(2) Plot the Cp, Enthalpy and Entropy for the local temperature range (low temperature: high temperature) specific for each species.
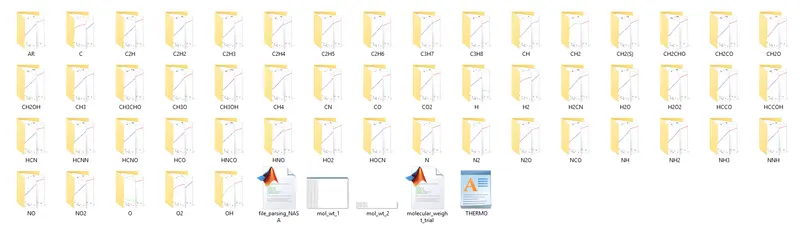
(3) Save the plots as images with appropriate names and dump them in separate folders for each species with a suitable name.
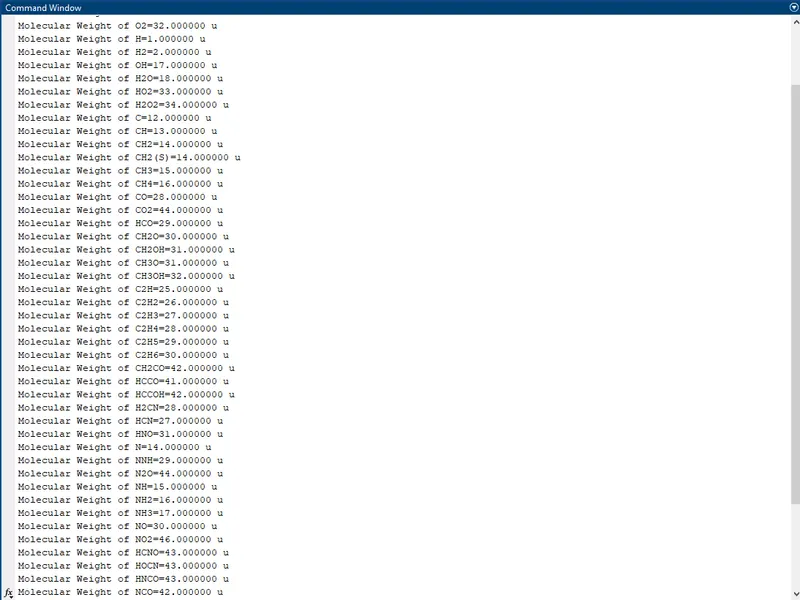
(4) Calculate the molecular weight of each species and display it in the command window.
BRIEF:
File parsing is can be described as reading in a data file of some sort and building an in-memory model or representation of the semantic content of that data, in order to facilitate performing some kind of transformation on the data.
For this challenge, we have been provided with NASA's Thermodynamic data with properties such as Species name, `T`, `C_p`,` H` and `S`. They have also documented the co-efficients that are required to evaluate these polynomials for some species.
We have to extract the co-efficients for the thermodynamic properties for each species and store into a set of variables of `C_p, H & S` with the respective temperature. Using these data we need to plot the graph as asked for this challenge.
To calculate the value of `c_p, H & S`, we can use the following formulas:
`C_p/R = a_1 + a_2T+a_3T^2+a_4T^3+a_5T^4`
`H/(RT) = a_1 + a_2T+a_3T^2+a_4T^3+a_5T^4+a_6T`
`S/R = a_1ln(T) + a_2T+a_3T^2/2+a_4T^3/3+a_5T^4/4+a_7`
where,
`C_p` = Specific heat, `J/(Kgk)`
`H` = Enthalpy, `J`
`S` = Entropy, `J/k`
`R` = Universal Gas constant for air, `J/(Kgk)`
`a` = Co-efficients
`T` = Temperature, `k`
Syntax used:
(1) fopen - This is used to call any file in MATLAB to extract the values or read the file.
(2) fgetl - This command is read the particular line in the data file.
(3) strsplit - It will split the string from an array.
(4) str2num - It will convert the numerical value from string and store into a variable.
(5) strfind - It is used to find a particular character in a string.
(6) linspace - It is used to generate a linearly spaced vector.
(7) plot - It is used to plot a graph for the particular string.
(8) mkdir - It is used to make a new folder
(9) strcmp - It is used to compare the strings.
(10) str2double - It converts the text into double-precision values which contains text that represents real or complex numeric values. A string can be a character vector, a cell array of character vectors, or a string array. If a string is a character vector or string scalar, then the variable is a numeric scalar. If a string is a cell array of character vectors or a string array, then the variable is a numeric array that is the same size as string.
(11) fprintf - Write data to a text file.
(12) sprintf - Format data into string or character vector.
CODE LOGIC:
(1) Firstly, we need to call the file to open in MATLAB by using 'fopen' command.
(2) As we see the data file, we need to tell MATLAB to jump to this line which has to read. For this, we can use 'fgetl' command to read the particular line. This function will start reading the line one by one as until we define the line number. For this, we need to create a for loop to tell MATLAB that we have to read this line number.
(3) After reaching the particular line from which we have to extract the values for Temperatures and the co-efficients which will be store for the further calculation for `C_p, H & S`
(4) Now, store the line into a variable and split the line into a different string. Now, assign a variable for each string. If the string has a numerical value, we need to convert the string to number using command 'str2num' and store the value for each temperature and the 14 co-efficients.
(5) There are 53 species, we can use for loop to extract each co-efficient value for `T, C_p, H & S` and the species name.
(6) Now, calculate the Specific heat `C_p`, Enthalpy `H` and Entropy `S` w.r.t. the temperature range. By using the `if-else` statement divide the co-efficient under the temperature w.r.t. the mid-temperature value.
(7) Plot the `Cp, Enthalpy & Entropy` for the temperature range (low temperature: high temperature) specific species and create a folder for each species.
(8) Now, calculate the molecular weight of each species.
CODE:
clear all            %clear the workspace
close all            %close all the open windows
clc                  %clear the command window

%File reading
f1 = fopen('THERMO.dat','r')

%Reading the 5th line from the doc
n = 5;
for i= 1:n
   fgetl(f1);
end

% Parsing the temperature value for 1st species
% tline_1 = fgetl(f1)
% k = strsplit(tline_1,' ')
% global_low_temp_1 = str2num (k{6})
% global_middle_temp_1 = str2num (k{7})
% global_high_temp_1 = str2num (k{8})

% Parsing the co-effiecients for the 1st species

% fgetl(f2) Next line
% tline_2 = fgetl(f1)
% a_1 = strfind(tline_2,'E')
% a1_1 = tline_2(1:(a_1(1)+3))
% a1_1 = str2num(a1_1)
% a2_1 = tline_2(a_1(1)+4:a_1(2)+3)
% a2_1 = str2num(a2_1)
% a3_1 = tline_2(a_1(2)+4:a_1(3)+3)
% a3_1 = str2num(a3_1)
% a4_1 = tline_2(a_1(3)+4:a_1(4)+3)
% a4_1 = str2num(a4_1)
% a5_1 = tline_2(a_1(4)+4:a_1(5)+3)
% a5_1 = str2num(a5_1)

% fgetl(f2) Next line
% tline_3 = fgetl(f1)
% b_1 = strfind(tline_3,'E')
% b1_1 = tline_3(1:(b_1(1)+3))
% b1_1 = str2num(b1_1)
% b2_1 = tline_3(b_1(1)+4:b_1(2)+3)
% b2_1 = str2num(b2_1)
% b3_1 = tline_3(b_1(2)+4:b_1(3)+3)
% b3_1 = str2num(b3_1)
% b4_1 = tline_3(b_1(3)+4:b_1(4)+3)
% b4_1 = str2num(b4_1)
% b5_1 = tline_3(b_1(4)+4:b_1(5)+3)
% b5_1 = str2num(b5_1)

%  fgetl(f2) Next line
% tline_4 = fgetl(f1)
% c_1 = strfind(tline_4,'E')
% c1_1 = tline_4(1:(c_1(1)+3))
% c1_1 = str2num(c1_1)
% c2_1 = tline_4(c_1(1)+4:c_1(2)+3)
% c2_1 = str2num(c2_1)
% c3_1 = tline_4(c_1(2)+4:c_1(3)+3)
% c3_1 = str2num(c3_1)
% c4_1 = tline_4(c_1(3)+4:c_1(4)+3)
% c4_1 = str2num(c4_1)

% Parsing the temperature value for 2nd species
% tline_5 = fgetl(f1)
% k = strsplit(tline_5,' ')
% global_low_temp_2 = str2num (k{6})
% global_middle_temp_2 = str2num (k{7})
% global_high_temp_2 = str2num (k{8})

% Size of Species
species_size = 53;

%Value of constant R = 287 J/kg.k | Universal Gas constant for air
R = 287;

% Applying for lop to 14 co-efficients from each species
for j = 1:species_size

%Parsing the temperature value for all species & name
tline = fgetl(f1);
k = strsplit(tline,' ');
TL = str2num (k{end-3});
TM = str2num (k{end-1});
TH = str2num (k{end-2});
species_name = k{1};

%Parsing the co-effiecients for the each species

% fgetl(f2) Next line
tline = fgetl(f1);
a = strfind(tline,'E');
a1 = tline(1:(a(1)+3));
A1 = str2num(a1);
a2 = tline(a(1)+4:a(2)+3);
A2 = str2num(a2);
a3 = tline(a(2)+4:a(3)+3);
A3 = str2num(a3);
a4 = tline(a(3)+4:a(4)+3);
A4 = str2num(a4);
a5 = tline(a(4)+4:a(5)+3);
A5 = str2num(a5);

% fgetl(f2) Next line
tline = fgetl(f1);
b = strfind(tline,'E');
b1 = tline(1:(b(1)+3));
A6 = str2num(b1);
b2 = tline(b(1)+4:b(2)+3);
A7 = str2num(b2);
b3 = tline(b(2)+4:b(3)+3);
B1 = str2num(b3);
b4 = tline(b(3)+4:b(4)+3);
B2 = str2num(b4);
b5 = tline(b(4)+4:b(5)+3);
B3 = str2num(b5);

% fgetl(f2) Next line
tline = fgetl(f1);
c = strfind(tline,'E');
c1 = tline(1:(c(1)+3));
B4 = str2num(c1);
c2 = tline(c(1)+4:c(2)+3);
B5 = str2num(c2);
c3 = tline(c(2)+4:c(3)+3);
B6 = str2num(c3);
c4 = tline(c(3)+4:c(4)+3);
B7 = str2num(c4);

% Defining the range of temperature
Temp_range = linspace(TL,TH,100);

% Calculation of the thermodynamic properties
for l = 1:length(Temp_range)
    T = Temp_range(l);
    if (T>TM)
        c_p(l) = (((A1) + (A2*T) + (A3*((T))^2) + (A4*((T))^3) + (A5*((T))^4))*R);
        H(l) = (((A1) + ((A2*(T))/2) + ((A3*((T))^2)/3) + ((A4*((T)).^3)/4) + ((A5*((T))^4)/5) + (A6/(T)))*(R*(T)));
        S(l) = (((A1*log(T)) + (A2*T) + ((A3*(T)^2)/2) + ((A4*(T)^3)/3) + ((A5*(T)^4)/4) + A7)*R);
    else
        c_p(l) = (((B1) + (B2*(T)) + (B3*((T))^2) + (B4*((T))^3) + (B5*((T))^4))*R);
        H(l) = (((B1) + ((B2*(T))/2) + ((B3*((T))^2)/3) + ((B4*((T))^3)/4) + ((B5*((T))^4)/5) + (B6/(T)))*(R*(T)));
        S(l) = (((B1*log(T)) + (B2*T) + ((B3*(T)^2)/2) + ((B4*(T)^3)/3) + ((B5*(T)^4)/4) + B7)*R);
    end

end

%Plotting the graph for Specific heat, Enthaply & Entropy w.r.t. Tempeature for each species
       h1 = figure(1)
       plot (Temp_range, c_p, 'linewidth',2,'color','g')
       xlabel ('Temperature(k)')
       ylabel ('Specific heat(J/Kg k)')
       title (char(species_name))
       grid on

       h2 = figure(2)
       plot (Temp_range, H, 'linewidth',2,'color','b')
       xlabel ('Temperature(k)')
       ylabel ('Entalpy (J)')
       title (char(species_name))
       grid on

       h3 = figure(3)
       plot (Temp_range, S, 'linewidth',2,'color','r')
       xlabel ('Temperature (k)')
       ylabel ('Entropy (J/k)')
       title (char(species_name))
       grid on

%Creatting separte folder for each species & save the graph in the respective folder

       mkdir (char(species_name))
       saveas(h1,sprintf('%s/Fig%d.jpg',char(species_name),1));
       saveas(h2,sprintf('%s/Fig%d.jpg',char(species_name),2));
       saveas(h3,sprintf('%s/Fig%d.jpg',char(species_name),3));

% Molecular weight calculation

element={'O','C','H','A','N'};     %Elements present in each species
atomic_mass=[16,12,1,40,14];       %Respective atomic masses of the element
mol_wt=0;                          %Initialize the molecular weight

% Use for loops to calculate the molecular weight of each species

for m = 1:length(species_name)

     for q =1:length(atomic_mass)
     if strcmp(species_name(m),element(q))
        mol_wt = mol_wt+atomic_mass(q);

        %if the element matches with the species name it will going to get the respective mass.
            flag = q;
     end
     end

     n = str2double(species_name(m));            %It will skip the numerical value in the array

     if n>1
     mol_wt = mol_wt + (atomic_mass(flag)*(n-1));  %It is a number which will be multiplied with the previous letter
     end

end

% Print the values of Molecular weight of each species
fprintf('Molecular Weight of %s=%f u n',species_name,mol_wt)

end

%END of Program
RESULTS: The Molecular weight of each species.

GRAPHS:
(1) The graph for `O_2`
(2) The graph for `N_2`
(3) The graph for `CO_2`
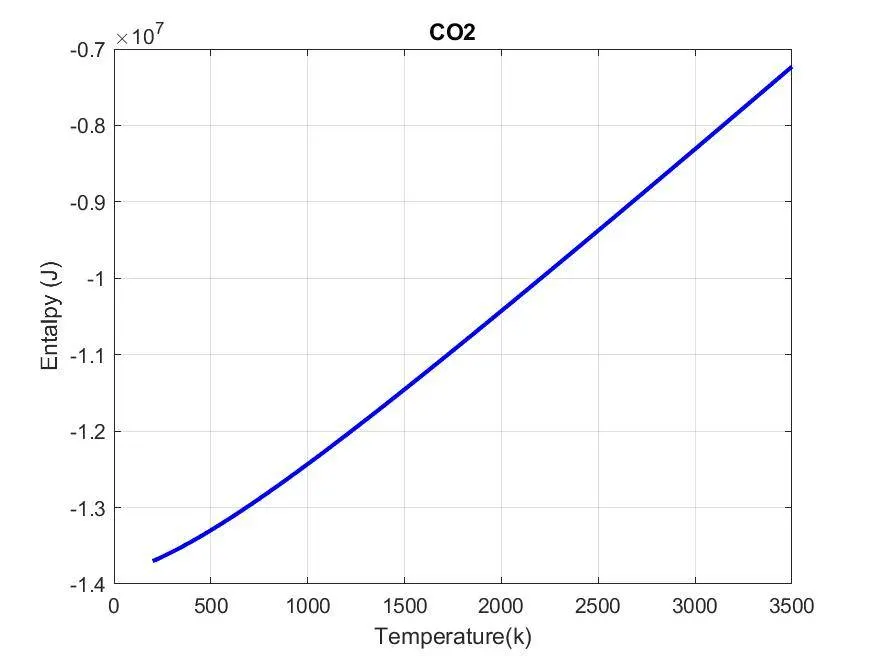
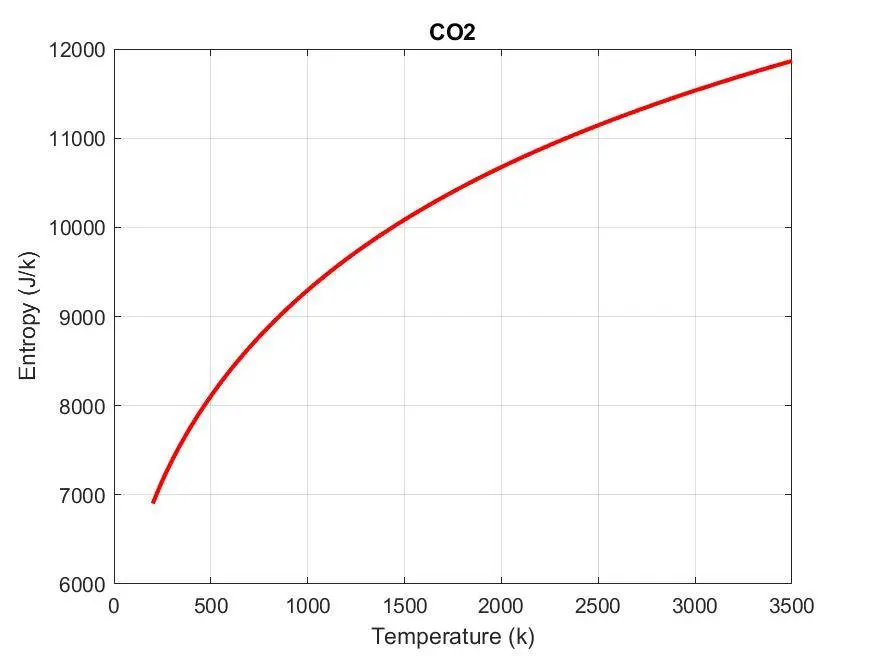
(4) Screenshot of the folders created for each species by MATLAB
CONCLUSION: Successfully executed the code to plot the graphs and calculate the molecular weight of each species.