Project 1 - Parsing NASA thermodynamic data
AIM:
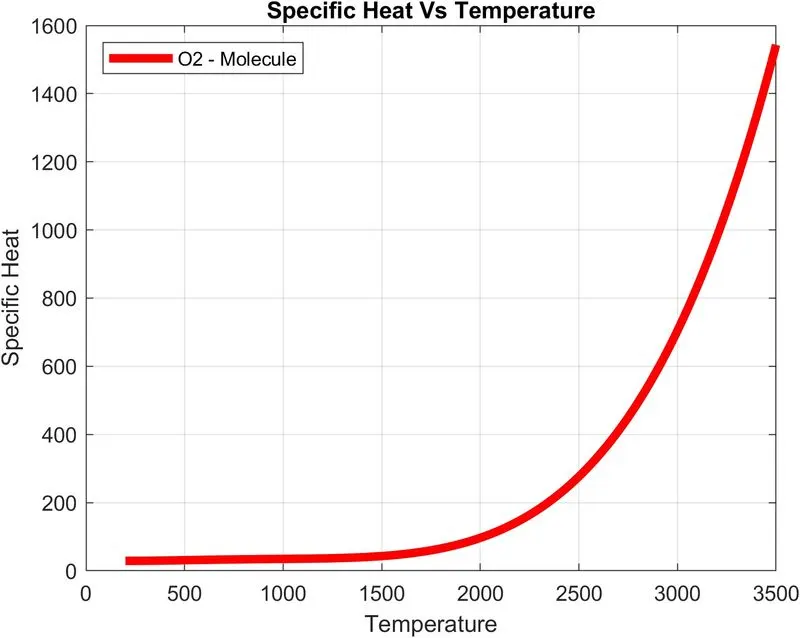
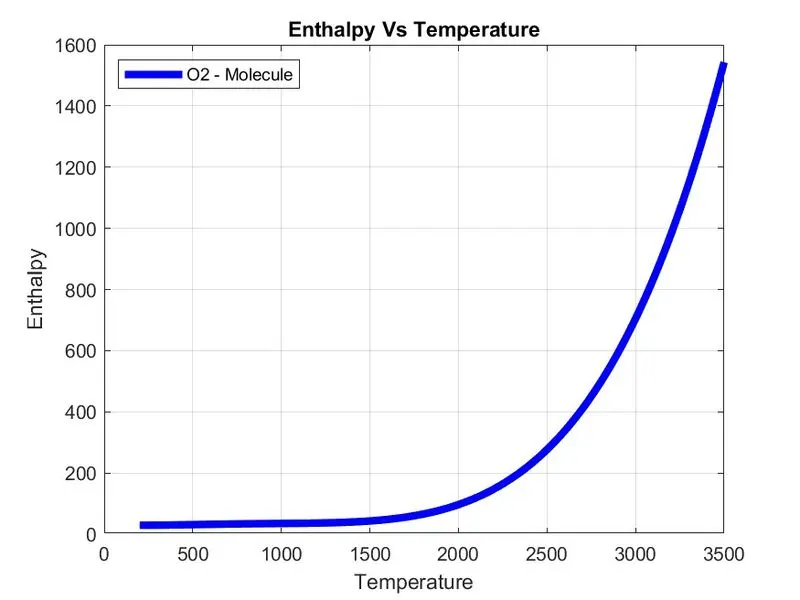
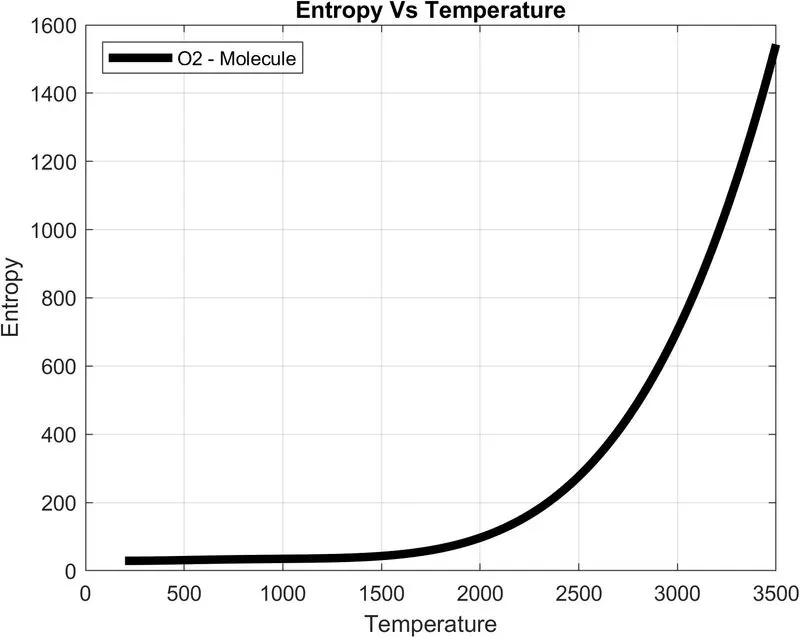
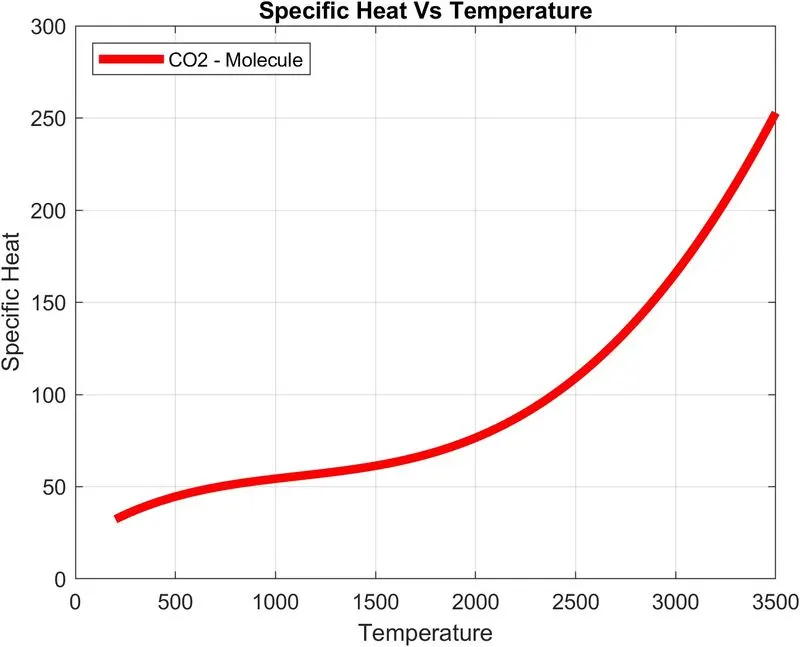
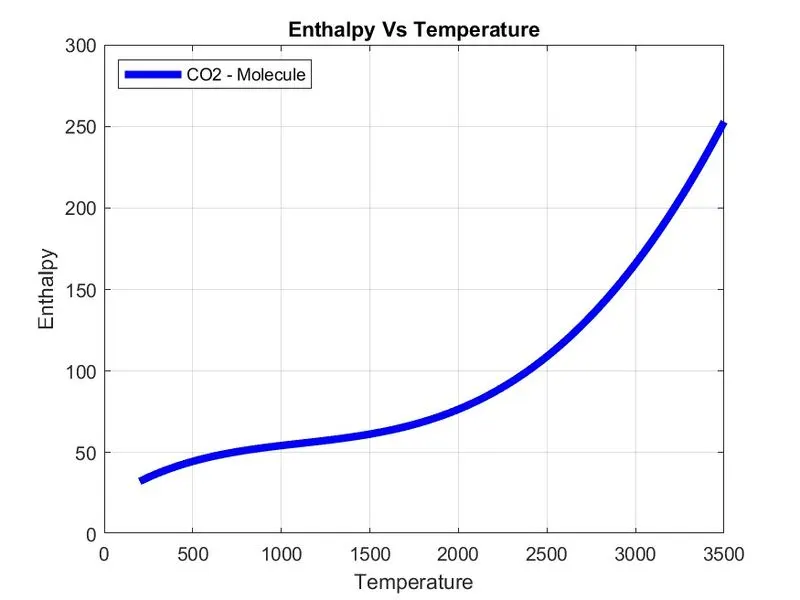
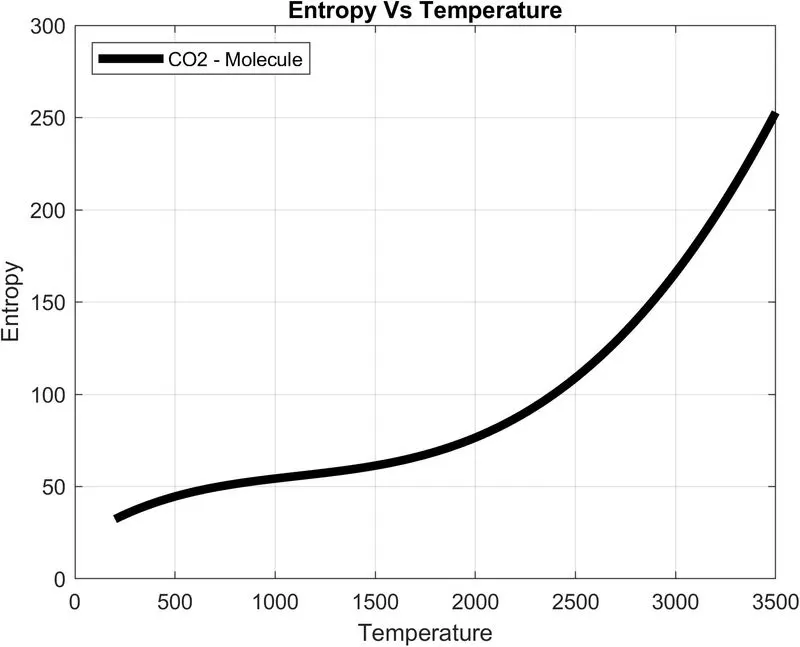
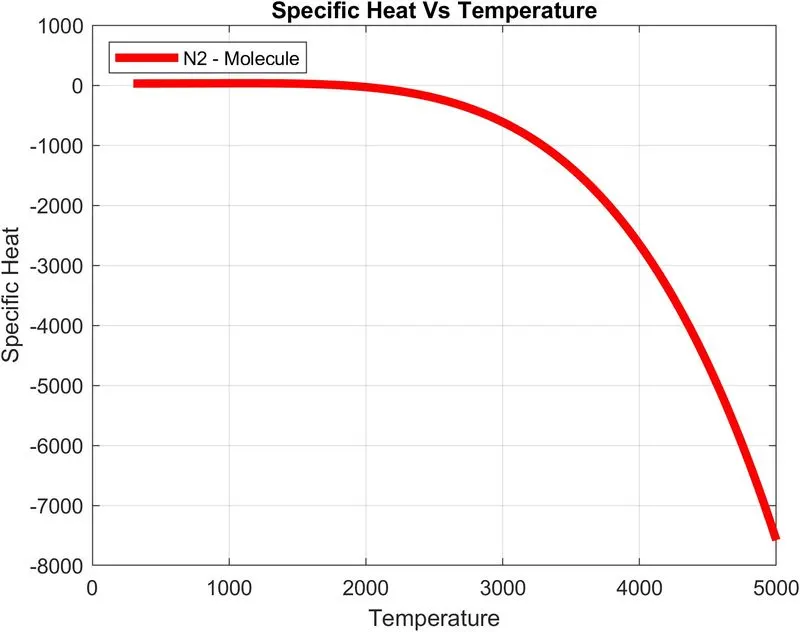
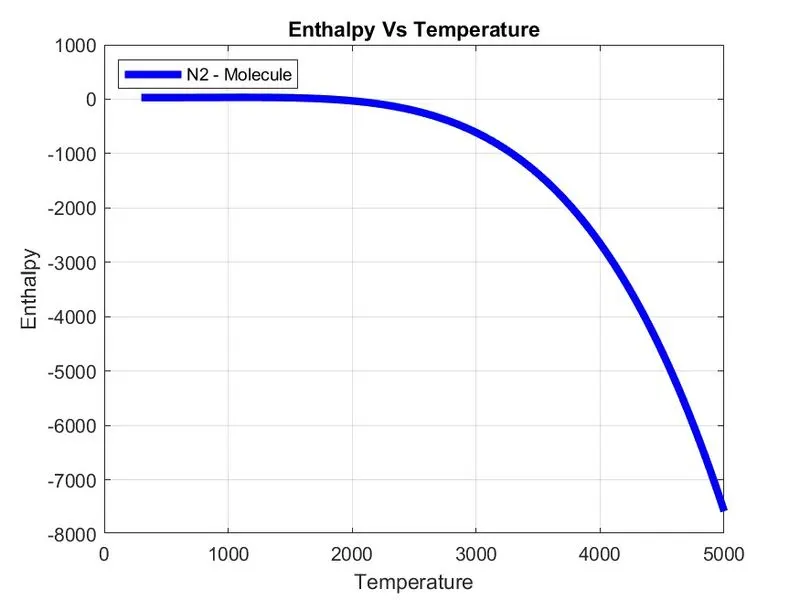
The aim of the project is to do File Parsing with the given data. We have to take the Species Name, Co_efficients value and the Temperature value mentioned in the data. And we have to calculate the Specific Heat, Enthalpy and Entropy for the data taken from the given data. Addition to that we have to write a code to calculate Molecular weight of the Species name mentioned in the data.
PROGRAM:
Program 1 - Function to calculate Specific Heat, Enthalpy and Entropy by the coefficients for each species:
function [c_p,H,S] = NASA_Func(a1,a2,a3,a4,a5,a6,a7,a8,a9,a10,a11,a12,a13,a14,T,Med_Local_Temp,R)


if (T > Med_Local_Temp)
   c_p = R .* (a1+(a2.*T)+(a3.*T.^2)+(a4.*T.^3)+(a5.*T.^4));
   H = R.*T .* (a1+(a2.*T)/2+(a3.*T.^2)./3+(a4.*T.^3)./4+(a5.*T.^4)./5+(a6./T));
   S = R .* (a1.*log(T)+(a2.*T)+(a3.*T.^2)./2+(a4.*T.^3)./3+(a5.*T.^4)./4+a7);
else
    c_p = R .* (a8+(a9.*T)+(a10.*T.^2)+(a11.*T.^3)+(a12.*T.^4));
    H = R.*T .* (a8+(a9.*T)./2+(a10.*T.^2)./3+(a11.*T.^3)./4+(a12.*T.^4)./5+(a13./T));
    S = R .* (a8.*log(T)+(a9.*T)+(a10.*T.^2)./2+(a11.*T.^3)./3+(a12.*T.^4)./4+a14);

end
Code Explanation for Program 1:
- First in the main coding we have to take the values of all co-efficients that is required for calculation.
- Then as per the conditon given the first 7 coefficients is for the Higher temperature and the second 7 coefficients is for the Lower temperature.
- Using the if else() command, I did this code.
Program 2 - Main Coding for the File Parsing :
clear all
close all
clc

%To get the file

File = fopen('THERMO1.txt','r');
Line1= fgetl(File); %To read the Header of the Data
A = readlines("THERMO1.txt"); %This will read every lines in the text

%Global Temperature collection
Line2 = fgetl(File); % To read the Global Temperature readings using fgetl command
Global_temp = A{2}; %to read the string of the data file
Global_temp1 = strsplit(Global_temp);
Low_Global_Temp = Global_temp1{2};
Med_Global_Temp = Global_temp1{3};
High_Global_Temp = Global_temp1{4};

%Skipped reading the intermediate comments

for i=1:3
    Lines_to_be_skipped = fgetl(File);
end

%Code for reading the Species Name and Local Temperature

for i = 1:56
Line6 = fgetl(File); %Get line for Species and Local Temperature
B = strsplit(Line6); %Splitting the string line
Species_Name = B{1}; %Selection of first spring for the species name
C = strfind(Line6,'G'); %Finding G common in all lines for Local temperature location
Local_temp = Line6(C+4 :length(Line6));
D = strsplit(Local_temp);
Low_Local_Temp = str2double(D{1});
Med_Local_Temp = str2double(D{3});
High_Local_Temp = str2double(D{2});

Line7 = fgetl(File); %Get line contains coefficient value 1-5
E = strfind(Line7,'E'); %Finding the particular E in that line
a1 = str2double((Line7(1:E(1)+3))); % Assign the number with respect to that string to mark our outputs
a2 = str2double(Line7(E(1)+4:E(2)+3));
a3 = str2double(Line7(E(2)+4:E(3)+3));
a4 = str2double(Line7(E(3)+4:E(4)+3));
a5 = str2double(Line7(E(4)+4:E(5)+3));

Line8 = fgetl(File); %Get line contains coefficient value 6-10
F = strfind(Line8,'E');
a6 = str2double(Line8(1:F(1)+3));
a7 = str2double(Line8(F(1)+4:F(2)+3));
a8 = str2double(Line8(F(2)+4:F(3)+3));
a9 = str2double(Line8(F(3)+4:F(4)+3));
a10 =str2double(Line8(F(4)+4:F(5)+3));

Line9 = fgetl(File); %Get line contains coefficient value 11-14
G = strfind(Line9,'E');
a11 = str2double(Line9(1:G(1)+3));
a12 = str2double(Line9(G(1)+4:G(2)+3));
a13 = str2double(Line9(G(2)+4:G(3)+3));
a14 = str2double(Line9(G(3)+4:G(4)+3));

%Inclusion of function for calculation
T = linspace(Low_Local_Temp,High_Local_Temp,300); %Temperture values for the input


R = 8.314; %Universal Gas constant

c_p = NASA_Func(a1,a2,a3,a4,a5,a6,a7,a8,a9,a10,a11,a12,a13,a14,T,Med_Local_Temp,R); %Function to formulate data
H = NASA_Func(a1,a2,a3,a4,a5,a6,a7,a8,a9,a10,a11,a12,a13,a14,T,Med_Local_Temp,R); %Function to formulate data
S = NASA_Func(a1,a2,a3,a4,a5,a6,a7,a8,a9,a10,a11,a12,a13,a14,T,Med_Local_Temp,R); %Function to formulate data

mkdir(Species_Name) %Command to create the folder
cd(Species_Name) %Command to write the figure in the particular folder
k = sprintf('%s - Molecule',Species_Name); %Legends of the figure given with the String along with species name
%Plotting of data c_p with temperature
figure(1)
plot(T,c_p,'linewidth',4,'color','r');
xlabel('Temperature')
ylabel('Specific Heat')
legend(k ,'location','Northwest');
title('Specific Heat Vs Temperature')
grid on
f1 = (gcf); %to get the figure
exportgraphics(f1,'Specific Heat.jpg','Resolution',300); %Exported in higher resolution

%Plotting of data Enthalpy with temperature
figure(2)
plot(T,H,'linewidth',4,'color','b');
xlabel('Temperature')
ylabel('Enthalpy')
legend(k,'location','Northwest');
title('Enthalpy Vs Temperature')
grid on
f2 = (gcf);
exportgraphics(f2,'Enthalpy.jpg','Resolution',300);
saveas(f2,'Enthalpy.jpg')

%Plotting of data Entropy with temperature
figure(3)
plot(T,S,'linewidth',4,'color','k');
xlabel('Temperature')
ylabel('Entropy')
legend(k,'location','Northwest');
title('Entropy Vs Temperature')
grid on
f3 = (gcf);
exportgraphics(f3,'Entropy.jpg','Resolution',300);

cd .. %Command to stop the figure to copy on the particular folder

f = Molecular_Weight_Func(Species_Name); %Funciton used for calculation of molecular weight

end
Code Explanation for Program 2:
- Initially I use fopen() command to open the given file. And using the fgetl() command to read the Header that is the first line of the file. Whenever we run the fgetl() command again and again for the consecutive running, it will read the line one by one.
- Here I also tried the readline() command to convert the data into string of 223 columns. By using this command we can select the column of the line for the extraction from the string.
- Then in the Species line, we are having global temperatures. For the collection of the global temperature in that line. We have to use the strsplit() command.
- This command will seperate the string of the line using the delimiters symbol. In that line each string is seperated by space. After that, we have to call the particular number in the program to show the outcome of that string.
- Then I extract the data having the co-efficient line using fgetl() command. In this line the each coefficient is not split by any space. So that we have to choose one character that will be common for all the coefficient value to seperate it.
- Then E is the common character in that line and it is the only character that is equally formatted.
- Then I use strfind() to identify the position of the particular character in that line. Then using the range we can select the value of coefficient.
- After that here one more new command is used. str2double() this command converts the string into number. Here for that line having co-efficient, every element is stored as string.
- We all know that we cant use character to do addition or multiplication. So using str2double(), I convert the string into number for the further calculation.
- Then by using the same method, I extract the data for the 14 coefficients for the single species.
- Then I call upon the function of NASA_Func to calculate the value for Specific heat, Enthalpy and Entropy.
- After that Plotting is done for the Specific heat, Enthalpy and Entropy with respect to the temperature. And as per the instruction I select the temperature using linspace command for the (Low temperature:High Temperature)
- Then i use the gcf command to get the figure. And then I use the command exportgraphics() to export the figure into our targeted path.
- Then using the command mkdir(), I make the directory in the targeted path. And using the command cd(), I write the each figure on the same directory upto for loop ends. In the end I use cd.. command to close the particular directory.
- I wrote all this code inside the for() with the range of 57 as 57 species are there in the data provided.
- Then using the Molecular_Weight_Func in the last, I calculate the Molecular weight for all the species.
Program 3 - Function to calculate the molecular weight :
function [f] = Molecular_Weight_Func(Species_Name)

Molecule = {'O','H','N','C','A'}; %defining the each molecule available in the species
Atomic_Mass = [15.9994,1.00794,14.0067,12.0107,39.948]; %Atomic mass of the each element
Molecular_Weight = 0;
for i = 1:length(Species_Name)
    for j = 1:length(Molecule) %inner loop for the comparision of element molecule
if  strcmpi(Species_Name(i),Molecule(j))
    Molecular_Weight = Molecular_Weight + Atomic_Mass(j);
   z = j;
end
    end
k = str2double(Species_Name(i)); % calculation for the number of element
if k>1
    Molecular_Weight = Molecular_Weight + (Atomic_Mass(z)*(k-1));
end
end
f = Molecular_Weight;
x = sprintf('%s Molecular weight =%f',Species_Name,f); %to print the molecular weight
disp(x) % to display the value
Code Explanation for program 3:
- In the starting, I define the each molecule of the species. And according to that I define the values for the atomic mass.
- Then using the for loop, I did the function. I considered two for loops one is for the selection of the species name. And other one is to compare the each species element to the each element of the molecule.
- Then for calculating the value such as O2. I used the str2double command to convert O2 into the number and I calculate the molecular weight.
PLOT:
Plot 1 - Plot for the O2
Plot 2 - For CO2
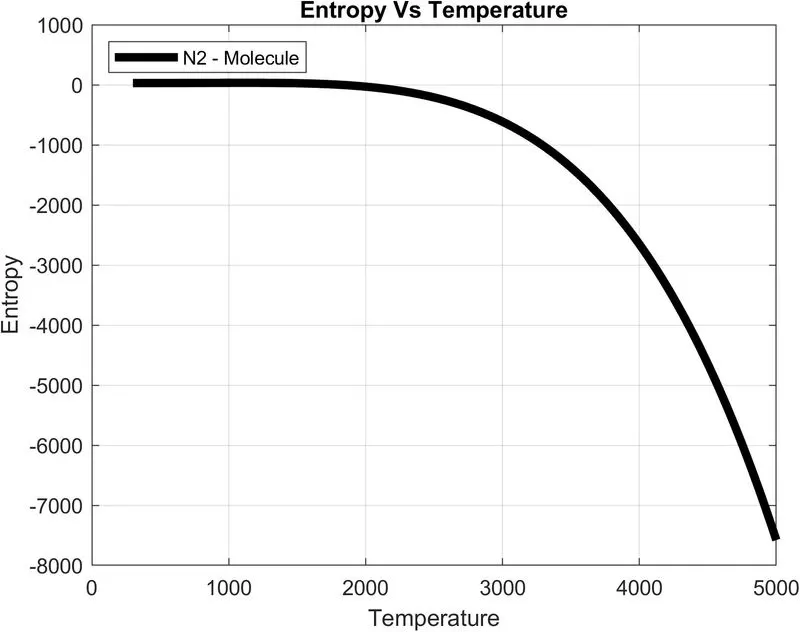
Plot 3 - For N2
Screenshot of the Destination of the saved folder:

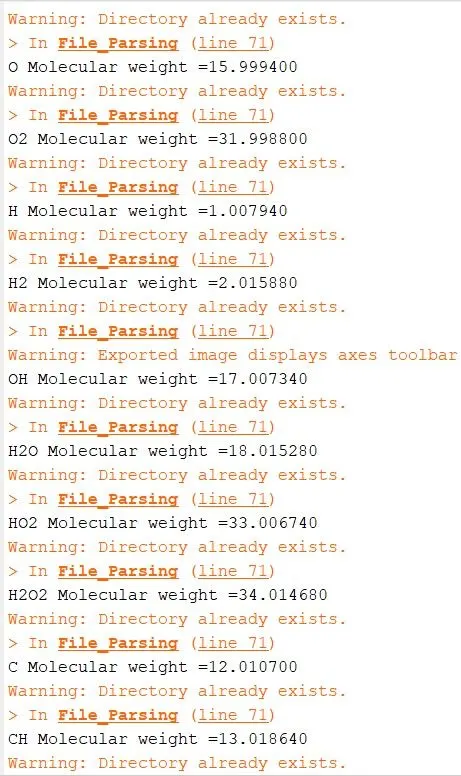
Molecular Weight Data:
REFERENCES:
- Mathworks
RESULT:
Thus the file parsing is done for the provided data. And the molecular weight of the each species is calculated. And the plots are attached as required.