Project 1 - Parsing NASA thermodynamic data
AIM:
To analyse/ parse a NASA thermodynamic data file, extract the coefficients and other characteristics of each species, and compute the specific heat (Cp), entropy (S), and enthalpy for each (H). Plot the values of Cp, H, and S using the local temperatures, and use MATLAB to show the molecular weight of each species.
OBJECTIVE:-
- To create a function that takes the 14 co-efficients as input and computes the enthalpy, entropy, and specific heats for each species in the data file.
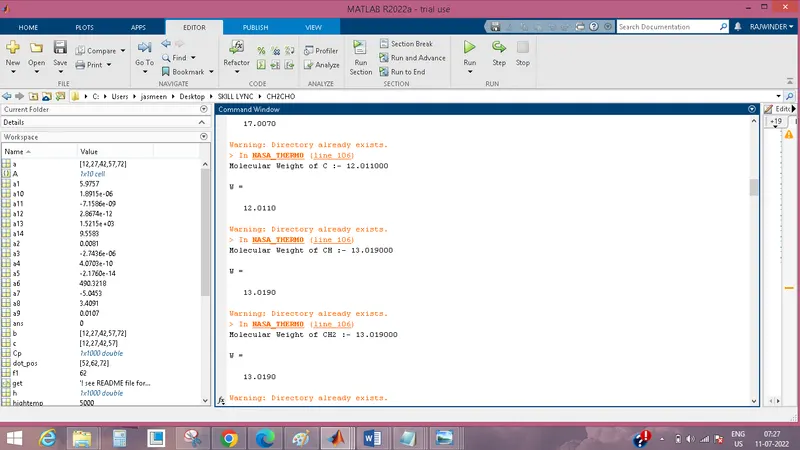
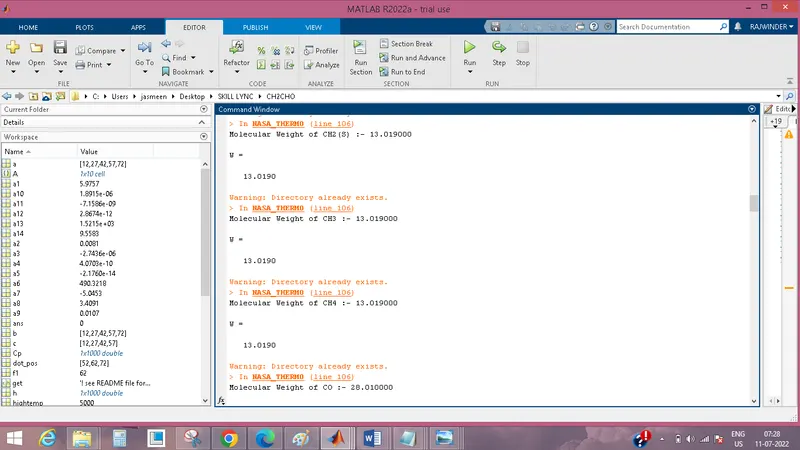
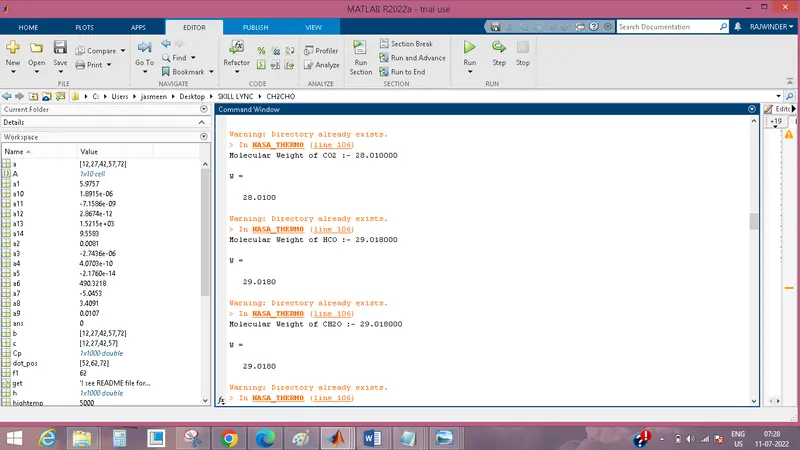
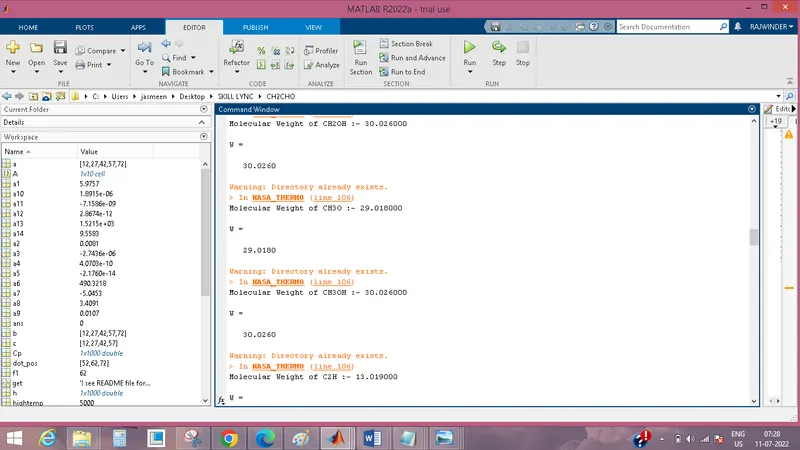
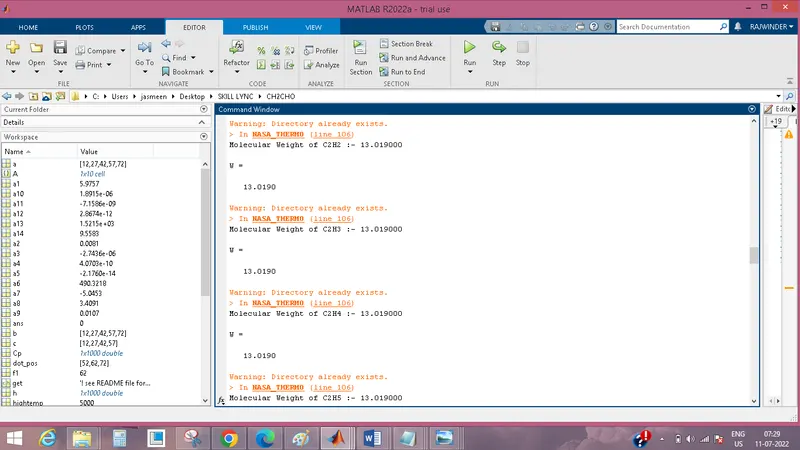
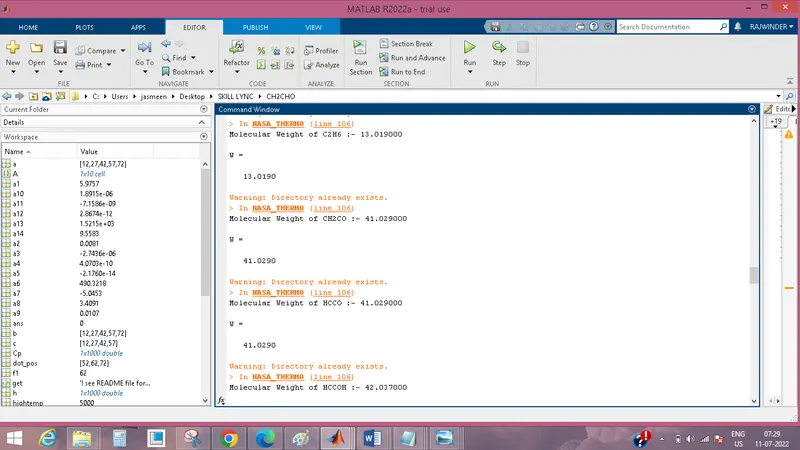
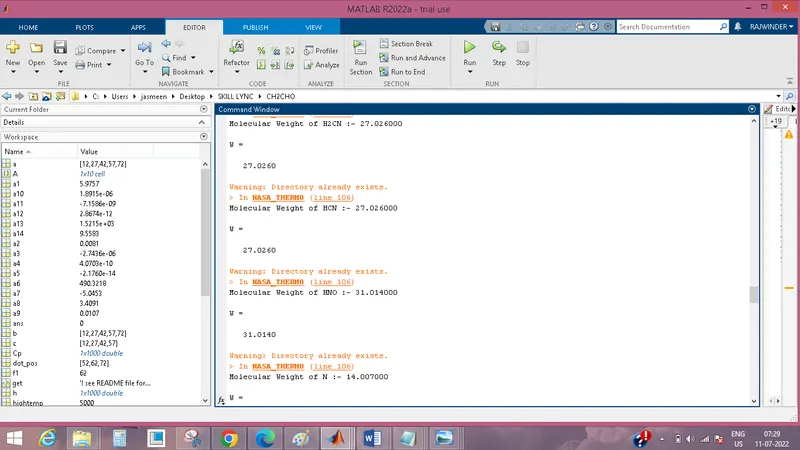
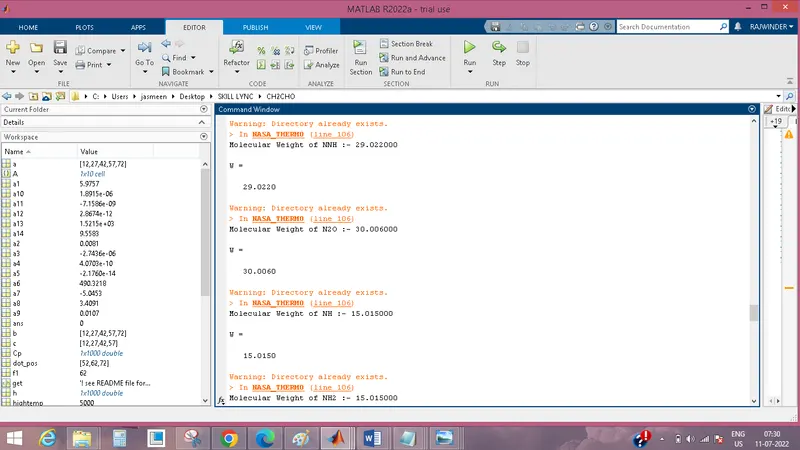
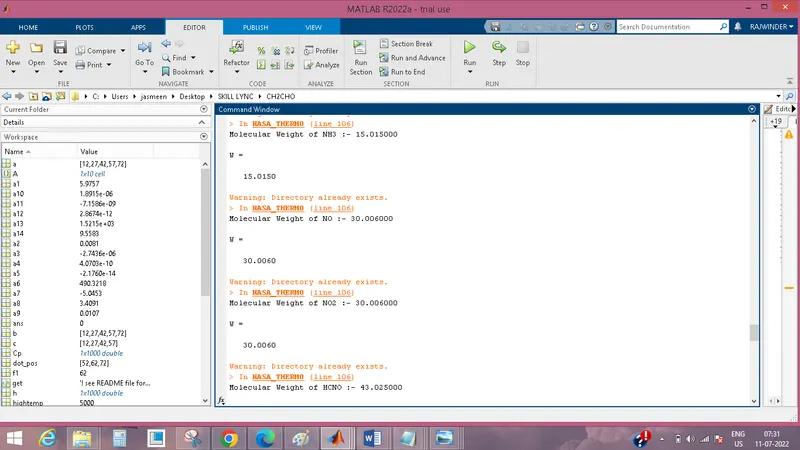
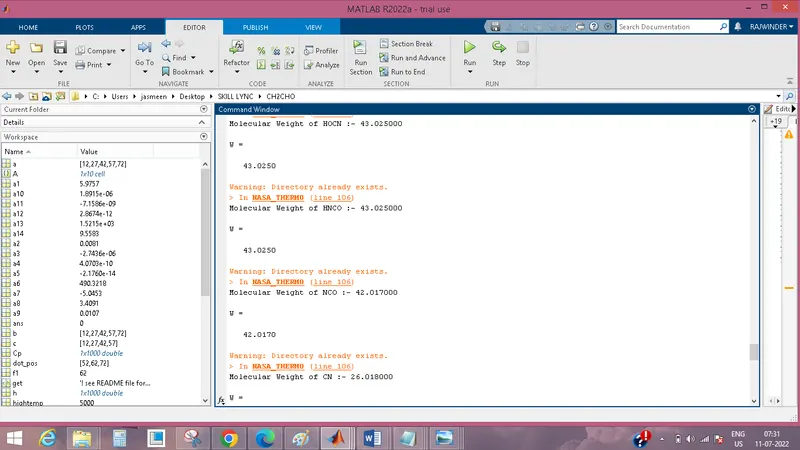
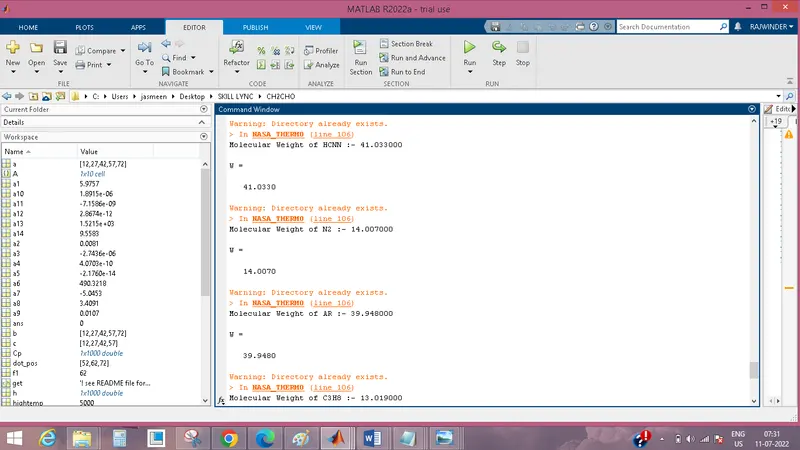
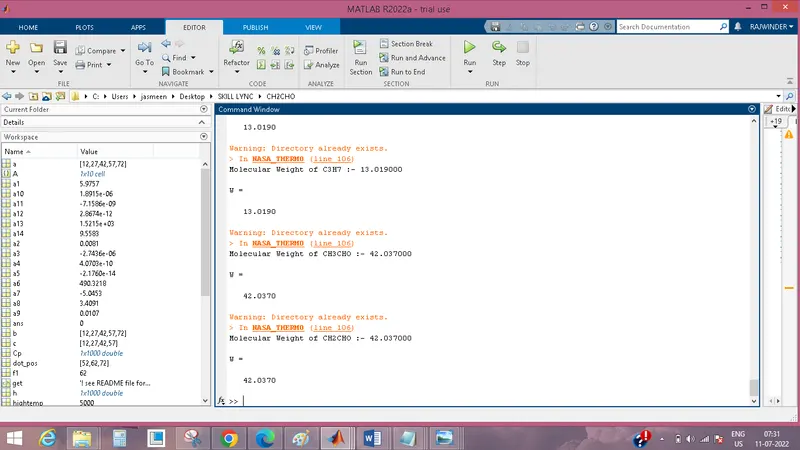
- To determine each species' molecular weight and display it in the command window.
- To Plot the Cp, Enthalpy, and Entropy values for each species' unique local temperature range (low temperature to high temperature).
- The Plots should be saved as pictures with descriptive file names and placed in distinct folders for each species. All of these ought to be produced automatically.
- The main programme you'll provide will simply create Cp, H, and S graphs using the "THERMO.dat" file as input.
File Parsing:
Parsing, syntax analysis, or syntactic analysis is the process of examining a string of symbols that adhere to the norms of a formal grammar, whether they be in normal language, computer languages, or data structures. The word "parsing" is derived from the Latin word pars (orationis), which means, "Part (of speech). The phraseis used in computational linguistics to describe the formal breakdown of a sentence or other string of words into its component parts by a computer, producing a parse tree that illustrates their syntactic relationship to one another and may also include semantic and other information. For a syntactically confusing input, some parsing algorithms may produce a parse forest or collection of parse trees.
A file is parsed by reading in some kind of data stream and creating an in-memory model of its semantic content. This seeks to make it easier to change the data in some way.
Thermodynamic File from NASA:
53 species and temperature ranges are provided in the NASA thermodynacs file (THERMO.dat), and each species has 14 coefficients and temperature ranges. We must parse these 14 coefficients to find Specific heat, Entropy, and Enthalpy using the following formula:-
where as,
R = Universal Gas constant
T = Temperature
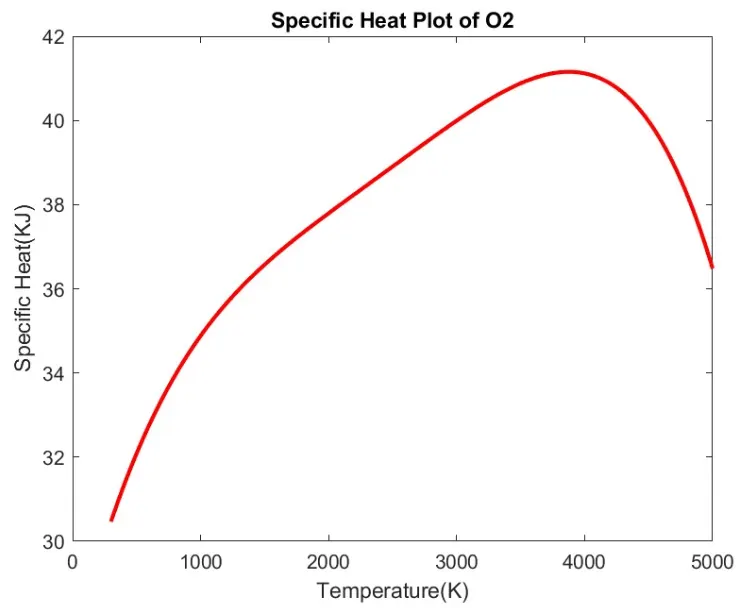
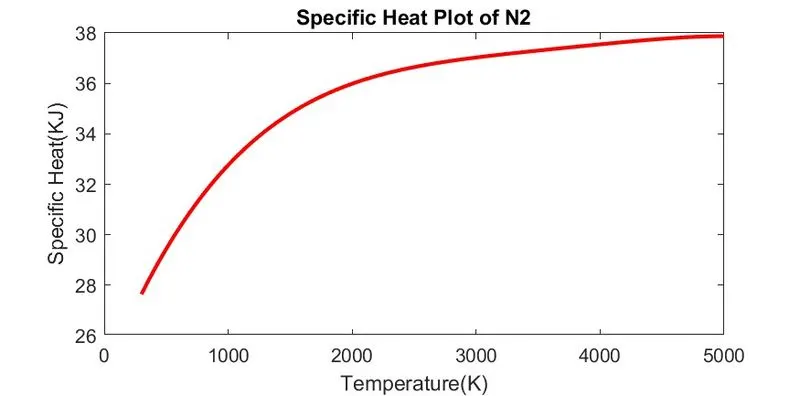
Cp = Specific heat (KJ)
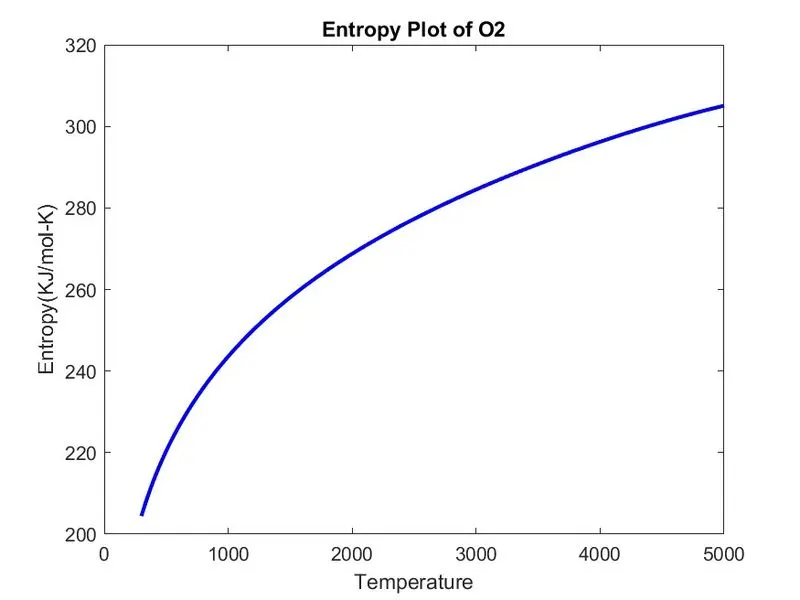
S = Entropy(KJ/mol-K)
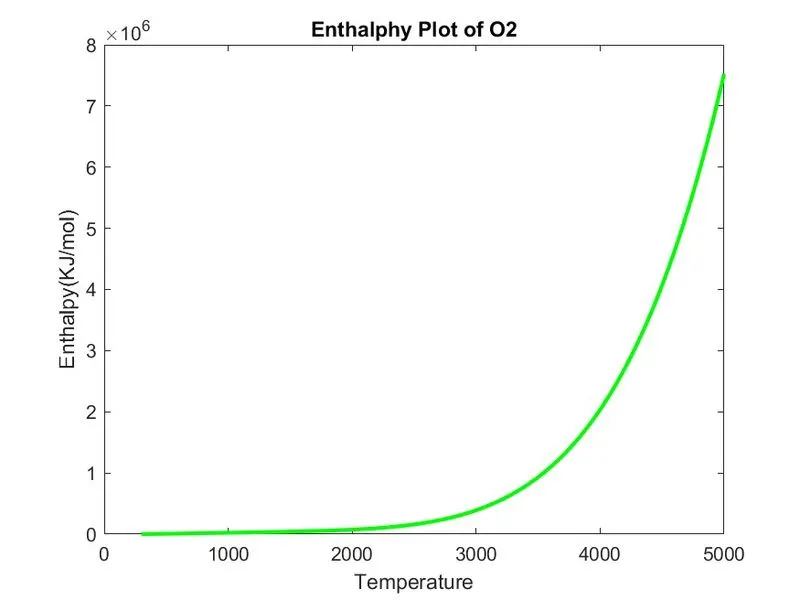
H = Enthalpy(KJ/mol)
a(i) = Coefficients where, i = 1 to 14
Specific Heat:-
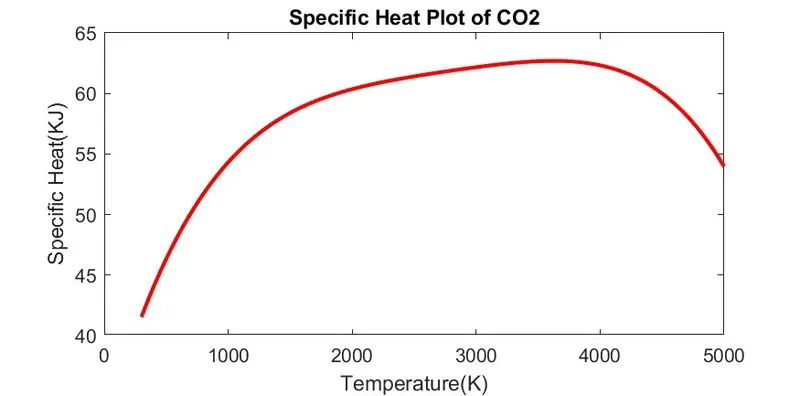
The amount of heat per unit mass needed to raise the temperature by one degree Celsius is known as the specific heat. The formula below, where c is the specific heat, is typically used to explain the relationship between heat and temperature change.
Cp = R*(a1 + (a2*T) + (a3*(T).^2) + (a4*(T).^3) + (a5*(T).^4))
Entropy:-
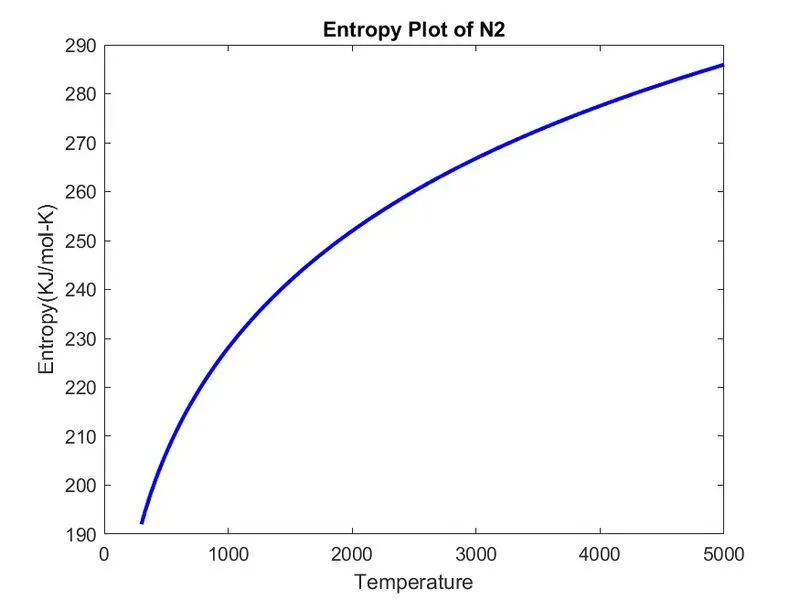
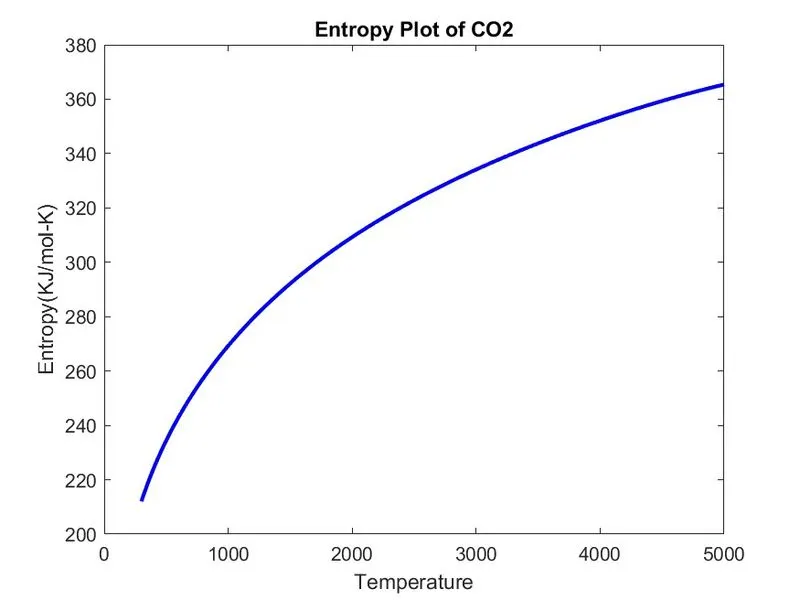
The amount of thermal energy per unit of temperature in a system that cannot be used to carry out beneficial work is known as entropy. Entropy is a measure of a system's molecular disorder or unpredictability since work is produced by organised molecular motion.
S = R*(a1.*log(T) + (a2*T) + ((a3*(T).^2)/2) + ((a4*(T).^3)/3) + ((a5*(T).^4)/4) + a7)
Enthalpy:-
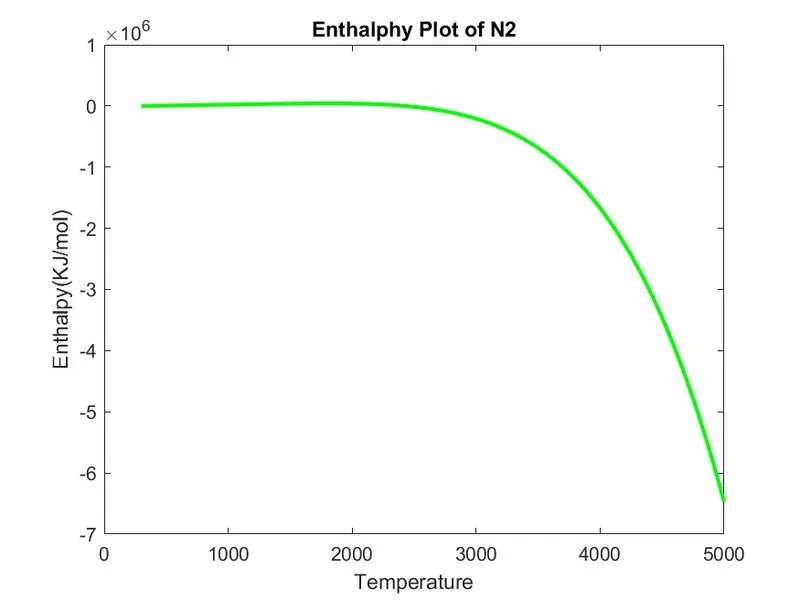
A thermodynamic system's enthalpy property is defined as the internal energy of the system plus the sum of its pressure and volume. For operations occurring at constant pressure in a system that is enclosed to avoid mass transfer, the amount of heat absorbed or released equals the change in enthalpy.
H = R*T.*(a1 + ((a2*T)/2) + ((a3*(T).^2)/3) + ((a4*(T).^3)/4) + ((a5*(T).^4)/5) + ((a6./T)))
Data extraction logic from the "Thermo.dat" file:
- As can be observed, the title is on the first line and comments are on the third, fourth, and fifth lines, which are outside the purview of our parsing
- The global temperatures for the full data set are represented by the three temperature values on the second line.
- This can be kept in a variable and is also irrelevant to our calculations because we plan to plot and compute using the local temperatures of each species separately.
- The species data begins on the sixth line and continues all the way to the end of the dataset. A clear pattern in the distribution of the species data can be seen.
- That is, each species has 4 lines of data
- The local low, high, and mid temperatures are shown on the first species line, correspondingly.
- Conversely, the second to fourth species lines have the 14 coeficient values (unique for each species).
- The first seven coefficients are high temperature coefficients, which means that Cp, H, and S must be calculated using a temperature value over midtemperature.
- The final seven coefficients are low temperature coefficients, requiring that Cp, H, and S be calculated at temperatures below mid-temperature.
Main Code:
clear all
close all
clc

% Reading data file
% open file and reading THERMO.dat file
f1 = fopen('THERMO.dat','r')
get = fgetl(f1)

% Now Reading Temperature from this file
temp = fgetl(f1)

%spliting
s = strsplit(temp,' ')

% converting strings cells into numbers
templow = str2num(s{2});
tempmid = str2num(s{3});
temphigh = str2num(s{4});

% Temperature Range
T = linspace(templow,temphigh,1000);

%Skipping comment lines
for i=1:3
    get=fgetl(f1);
end

% Reading the Species

for j=1:53
    tline=fgetl(f1);

    A = strsplit(tline,' ');  % spliting into cell array
    species =  (A{1});        % To read the name of the species


    dot_pos = strfind(tline, '.');

    lowtemp = tline(dot_pos(1)-3:dot_pos(1)+3);
    lowtemp = str2num(lowtemp);

    hightemp = tline(dot_pos(2)-4:dot_pos(2)+3);
    hightemp = str2num(hightemp);

    mediumtemp = tline(dot_pos(3)-5:dot_pos(3)+3);
    mediumtemp = str2num(mediumtemp);


    tline1 = fgetl(f1);   % getting next line
    a = strfind(tline1,'E');  % Finding the string E

    % Finding First 7 higher and second 7 lower coefficients
    % Finding Higher coefficients
    a1 = tline1(1:a(1)+3);
    a1 = str2num(a1);
    a2 = tline1(a(1)+4:a(2)+3);
    a2 = str2num(a2);
    a3 = tline1(a(2)+4:a(3)+3);
    a3 = str2num(a3);
    a4 = tline1(a(3)+4:a(4)+3);
    a4 = str2num(a4);
    a5 = tline1(a(4)+4:a(5)+3);
    a5 = str2num(a5);

    tline2 = fgetl(f1);
    b = strfind(tline2,'E');
    a6 = tline2(1:b(1)+3);
    a6 = str2num(a6);
    a7 = tline2(b(1)+4:b(2)+3);
    a7 = str2num(a7);

    % Finding Lower coefficients
    a8 = tline2(b(2)+4:b(3)+3);
    a8 = str2num(a8);
    a9 = tline2(b(3)+4:b(4)+3);
    a9 = str2num(a9);
    a10 = tline2(b(4)+4:b(5)+3);
    a10 = str2num(a10);

    tline3 = fgetl(f1);
    c = strfind(tline3,'E');
    a11 = tline3(1:c(1)+3);
    a11 = str2num(a11);
    a12 = tline3(c(1)+4:c(2)+3);
    a12 = str2num(a12);
    a13 = tline3(c(2)+4:c(3)+3);
    a13 = str2num(a13);
    a14 = tline3(c(3)+4:c(4)+3);
    a14 = str2num(a14);

    %Input
    R=8.314; % Gas Constant

    % calculate specific heat
    Cp = Specific_heat(a1,a2,a3,a4,a5,a8,a9,a10,a11,a12,T,R,mediumtemp);

    % calculate Entropy
    S = Entropy(a1,a2,a3,a4,a5,a7,a8,a9,a10,a11,a12,a14,T,R,mediumtemp);

    % calculate Enthalpy
    h = Enthalpy(a1,a2,a3,a4,a5,a6,a7,a8,a9,a10,a11,a12,a13,a14,T,R, mediumtemp);

    %plot

    mkdir(['C:\Users\jasmeen\Desktop\SKILL LYNC\',species]) % changing directory
    % writing molecular weight file
    W = Molecular_weight(species)
    MW_file = fopen('Molecular Weight.txt','w');
    fprintf(MW_file,'Molecular weight of %s is %d ',species,W);
    fclose(MW_file);   % Closing the file''


    %Plotting Cp, H and S with Temperature

    figure(1)
    plot(T,Cp,'linewidth',2, 'color','r');
    title(['Specific Heat Plot of ', species]);
    xlabel('Temperature(K)');
    ylabel('Specific Heat(KJ)');

    figure(2)
    plot(T,S,'linewidth',2,'color','b');
    title(['Entropy Plot of ', species]);
    xlabel('Temperature');
    ylabel('Entropy(KJ/mol-K)');

    figure(3)
    plot(T,h,'linewidth',2,'color','g');
    title(['Enthalphy Plot of ', species]);
    xlabel('Temperature');
    ylabel('Enthalpy(KJ/mol)');


    cd(['C:\Users\jasmeen\Desktop\SKILL LYNC\',species])  %Changing directory to Original matlab path
    saveas(1,'Cp vs T','jpg')
    saveas(2,'S vs T','jpg')
    saveas(3,'h vs T','jpg')
end
Step Wise Explanation of Main Code:
- In order to read the file THERMO.dat, we will first open it using the fopen command and input the option R.
- Then, using the fgetl command to read THERMO, the temperature file, and the strsplit command to split the temperatures into cell arrays, we will then use the str2num command to convert this string to a number in order to get the low, high, and mid temperatures.
- The linspace command will then be used to assign a temperature range.
- The fgetl command is then used inside the loop to bypass command lines in the data file.
- There are totally 53 species as explained below,
- Total lines = 218.
- Irrelevant lines = 6 (For more calarity: The data file's subsequent line is read when the fgetl command is used once again. We may extract the first five lines (title, Global temp, and comments) and save them in variables for our comprehension by running this programme five times.).
- Total relevant species lines = 218-6 = 212.
- Each species has 4 lines of data.
- So, number of species = 212/4 = 53 species.
6. Now, by assigning the fgetl command, splitting into the cell array to find the species line, finding the species name, and then finding the number of temperatures in the species line, we will execute the loop to locate 53 elements in the data file.
7. We then read the next line. Using the strfind command, we will first locate the string "E" in the data file in order to determine the before and after numbers of the coefficients.
8. Next, we will locate the remaining 14 coefficients and convert them from texts to integers.
9. There are two sets of seven coefficients: the first seven are for higher temperatures, while the second seven are for lower temperatures.
10. Now, utilising these 14 coefficients for lower and higher temperatures, we will describe the specific heat Cp, entropy S, and enthalpy H functions to determine these values. Then, in order to determine the Molecular weight of the various species, we will specify the molecular weight W function.
11. The Cp, H, and S values are determined as previously described using nested "for" loops.
12. Using the'mkdir' command, the extracted data is now stored in a directory with the species name.
13. Each species' graphs are created, and using the saveas command, the photos are stored in the directory.
14. A different function called "molecular weight" is used to determine the molecular weight.
15. 8.314 J/mol-K is used as the universal gas constant value.
Specific Heat Function Code :-
function Cp = Specific_heat(a1,a2,a3,a4,a5,a8,a9,a10,a11,a12,T,R,mediumtemp)

    % calculating specific heat
    % calculating specific heat for higher and lower temperature repectively.

    if (T <= mediumtemp)
        Cp = R*(a8 + (a9.*T) + (a10.*(T).^2) + (a11.*(T).^3) + (a12.*(T).^4));
    else
        Cp = R*(a1 + (a2.*T) + (a3.*(T).^2) + (a4.*(T).^3) + (a5.*(T).^4));
    end
end
Step wise explanation of Specific heat function code:
- Assigning its related formula coefficient from 14 coefficients, the gas constant, temperature, and mid temperature will now be used to get the specific heat.
- In order to define lower temperature coefficent in the calculation, we will now create a condition using an if loop and set the temperature less than and equal to mid temperature.
- Then, in the formula, we will utilise an alternative condition to define the higher temperature coefficient.
- After then, the function to compute Specific Heat will be terminated by using end command.
Entropy Function Code :-
function S = Entropy(a1,a2,a3,a4,a5,a7,a8,a9,a10,a11,a12,a14,T,R,mediumtemp)

    % calculating entropy
    % calculating entropy for higher and lower temperature repectively.

    if (T <= mediumtemp)
        S = R*(a8.*log(T) + (a9*T) + ((a10*(T).^2)/2) + ((a11*(T).^3)/3) + ((a12*(T).^4)/4) + a14);
    else
        S = R*(a1.*log(T) + (a2*T) + ((a3*(T).^2)/2) + ((a4*(T).^3)/3) + ((a5*(T).^4)/4) + a7);

    end
end
Step wise explanation of Entropy function code:
- By generating an entropy function and assigning its linked formula coefficient from 14 coefficients, the gas constant, temperature, and midtemperature, we can now determine the entropy.
- In order to define lower temperature coefficent in the calculation, we will now create a condition using an if loop and set the temperature less than and equal to mid temperature.
- Then, in the formula, we will utilise an alternative condition to define the higher temperature coefficient.
- Lastly, put an end to the loop and compute entropy.
Enthalpy Function Code :-
function [H] = Enthalpy(a1,a2,a3,a4,a5,a6,a7,a8,a9,a10,a11,a12,a13,a14,T,R,mediumtemp)
if T>mediumtemp
    H = (a1  +  a2.*(T)./2 +  a3.*(T.^2)./3  +  a4.*(T.^3)./4  +a5.*(T.^4)./5  +  a6./T)*R.*T;
else
    H = (a8.*T + a9.*(T.^2)./2  + a10.*(T.^3)./3 + a11.*(T.^4)./4 + a12.*(T.^5)./5 + a13)*R;
end
end
Step wise explanation of Enthalpy function code:
- We will now build an enthalpy function and assign its related formula coefficient from 14 coefficients, the gas constant, temperature, and midtemperature in order to get the enthalpy.
- In order to define lower temperature coefficent in the calculation, we will now define a condition using an if loop and set the temperature less than and equal to mid temperature.
Moreover, in the formula, we will utilise an alternative condition to define the higher temperature coefficient.- After then, the function to compute enthalpy will be terminated by using end command.
Molecular Function Code :-
function W = Molecular_weight(species)

    % Defining Atomic name of the species

    atomic_name = ['H','C','O','N','Ar'];

    % Defining Atomic masses of main species
    atomic_weight = [1.008 12.011 15.999 14.007 39.948];

    W=0;  % Molecular weight starting range

    for i=1:length(species)   % Loop runs to the length of the species
        for j=1:length(atomic_name)  % Loop runs to the length of the atomic names
            if strcmp(species(i), atomic_name(j))  %function to compare 2 strings
                W = W + atomic_weight(j);
                position = j;
            end
        end
        n = str2num(species);   % Now we will find if there is more element in the species then incrementing atomic weight of the species

        if n>1
            W = W + atomic_weight(position)*(n-1);
        end
    end

    fprintf('Molecular Weight of %s :- ',species);
    fprintf('%f',W);
    disp(' ')
Step wise explanation of Molecular Weight function code:
- The first step is to use an array to assign a value to each element.
- The species name and array items are then compared using the'strcmp' command.
- The atomic weight is then added in accordance with the value of the compared string element.
- The numerical value(n) is retrieved using the str2 num, and the preceding element's atomic weight is then multiplied by "n-1" times to determine the repetition of elements belonging to the same species.
FINAL RESULTS :-
PLOTS :-
Plots of specie O2 :-
Plots of specie N2 :-
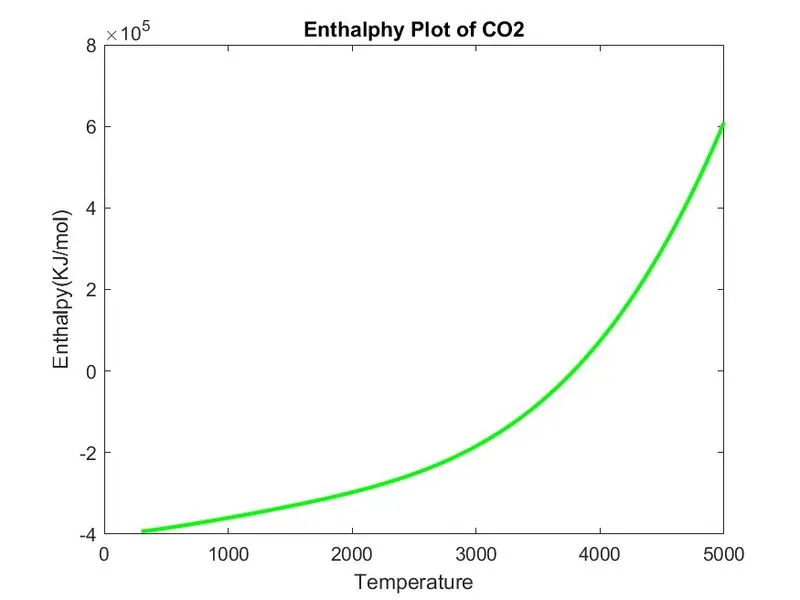
Plot For Co2:-
Screenshot of different species directory:

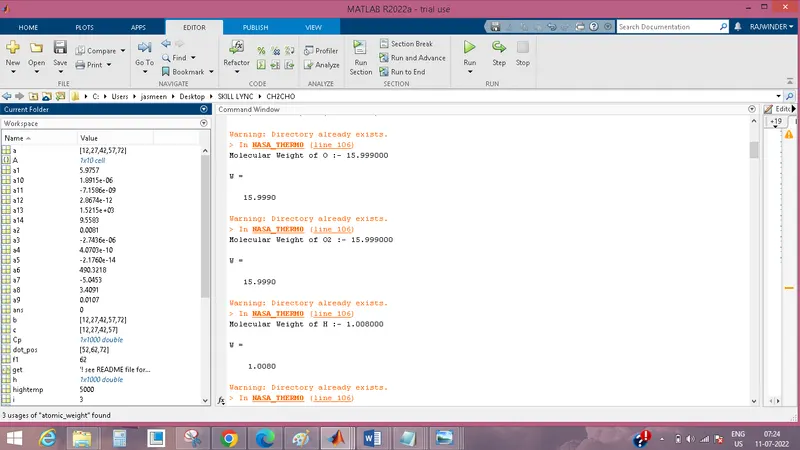
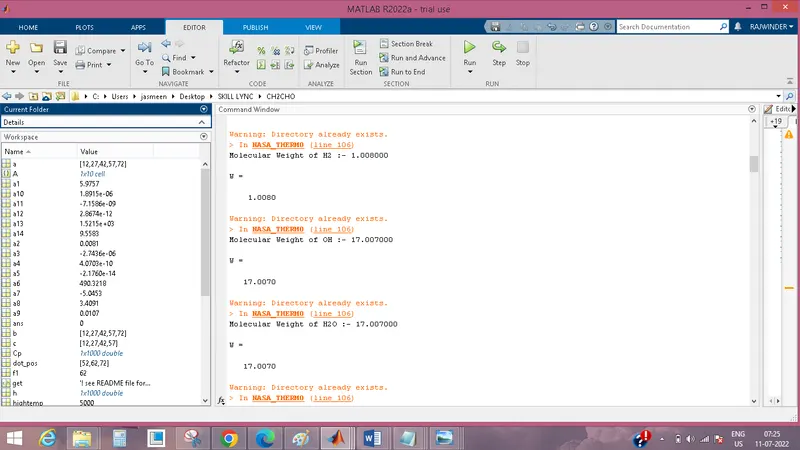
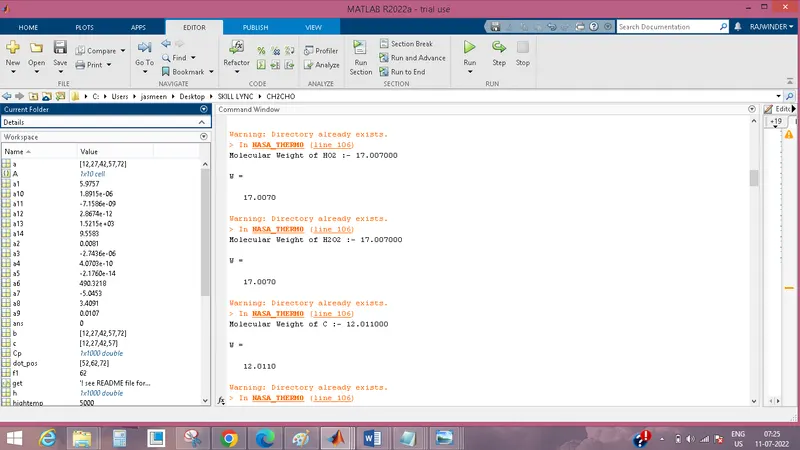
Molecular weight of the Different Species :-
References:
https://www.wikihow.com/Calculate-Molecular-Weight
https://in.mathworks.com/help/matlab/ref/cd.html