Project 1 - Parsing NASA thermodynamic data
Detail Report of Project On File Parsing NASA thermodynamic data
Introduction
In computing, parsing is 'an act of parsing a string or a text'. File parsing in computer language means to give meaning to the characters of a text file as per the formal grammar. Parse is defined as to break something down into its parts, particularly for the study of the individual parts. As we know there are many kinds of research are done in various laboratories across the globe at different places. The research data is stored in different formats and files which can be used by many people and researchers. Here comes the file parsing used to extract data and examine it using different functions. File parsing makes it very easy to do this.
Aim
To understand the file parsing in Matlab.
Objective
- Write a function that extracts the 14 coefficients.
- Calculates the enthalpy, entropy, and specific heats for all the species in the NASA thermodynamic data file.
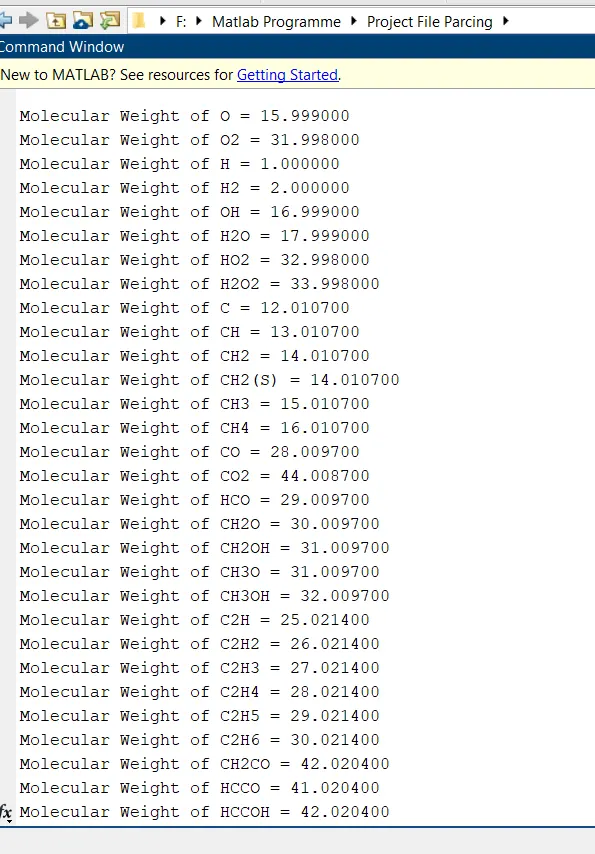
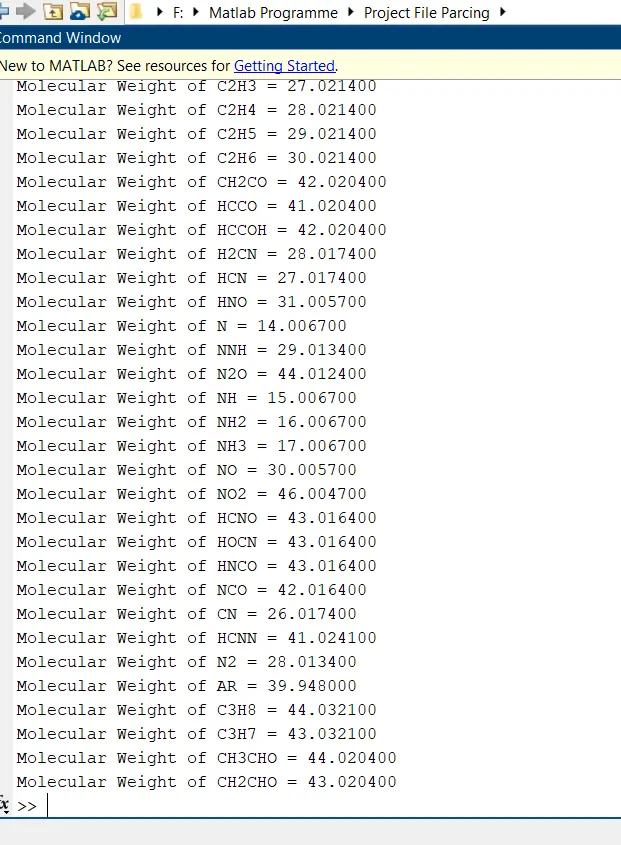
- Calculate the molecular weight of each species and display it in the command window.
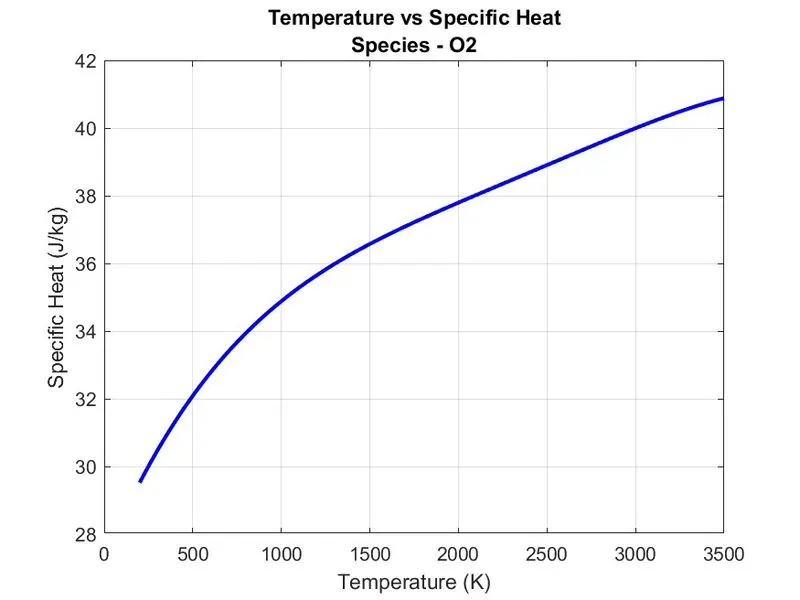
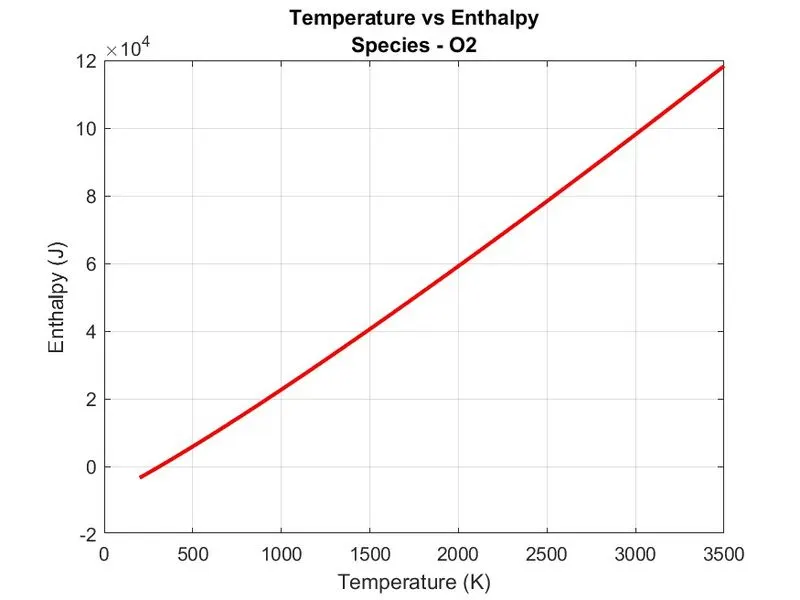
- Plot the Cp, Enthalpy, and Entropy for each species's local temperature range (low temperature : high temperature).
- Save the plots as images with appropriate names and dump them in separate folders for each species with a suitable name. All these should be generated automatically.
Equations
Where R is the Gas constant, Cp is specific heat, H is the enthalpy and T is the temperature. a1, a2, a3, a4, a5, a6, and a7 are the high-temperature co-efficient.
a8 , a9, a10, a11, a12, a13, a14 are low tempearature co-efficient.
Syntax
fileID = fopen(filename,permission) opens the file with the type of access specified by permission.
tline = fgetl(fileID) returns the next line of the specified file, removing the newline characters.
C = strsplit(str,delimiter) splits str at the delimiters specified by delimiter.
k = strfind(str,pat) searches str for occurrences of pat. The output, k, indicates the starting index of each occurrence of pat in str. If pat is not found, then strfind returns an empty array, []. The strfind function executes a case-sensitive search.
X = str2num(txt) converts a character array or string scalar to a numeric matrix. The input can include spaces, commas, and semicolons to indicate separate elements. If str2num cannot parse the input as numeric values, then it returns an empty matrix.
X = str2double(str) converts the text in str to double precision values.
y = linspace(x1,x2,n) generates n points. The spacing between the points is (x2-x1)/n-1).
mkdir folderName creates the folder folderName. If folderName exists, MATLAB issues a warning. If the operation is not successful, mkdir throws an error to the Command Window.
cd displays the current folder.
cd newFolder changes the current folder to newFolder. Folder changes are global. Therefore, if you use cd within a function, the folder change persists after MATLAB finishes executing the function.
fprintf(formatSpec,A1,...,An) formats data and displays the results on the screen.
Explanation
Objective 1: Write the function that extracts 14 co-efficients.
Code:
f = fopen("THERMO.dat",'r');
fgetl(f);                    %skipping header i.e. thermo

tline=fgetl(f);              %reading global temperature line as a string
Global_temp=strsplit(tline,' ');       %splitting string to get values

%reading global temperatures
global_low_temp=str2num(Global_temp{2});      %defining and coverting the tempreture from string to number
global_med_temp=str2num(Global_temp{3});
global_high_temp=str2num(Global_temp{4});

%skipping header information
for i=1:3   %using for loop to do operation 3 times on 3 line comment
fgetl(f);
end

%extracting species and coefficients
for i=1:53
    Line_1 = fgetl(f);          %extracting 1st line
    S = strsplit(Line_1,' ');   %splitting string
    Species_name = S{1};        %extracting species name
    t = strfind(Line_1,'G ');   %extracting local temperature values string
    temp_values = Line_1(t+2:length(Line_1)); %creating string
    local_temp = strsplit(temp_values,' ');    % spliting those strings
    local_low_temp=str2num(local_temp{2});   %coverting string to number
    local_med_temp=str2num(local_temp{4});
    local_high_temp=str2num(local_temp{3});

    Line_2 = fgetl(f);                         %reading 2nd line of data
    a = strfind(Line_2,'E');                   %finding position of E from string line_2
    a1 = str2double(Line_2(1:a(1)+3));         %exatracting coefficient a1 and coverting it to number using str2double
    a2 = str2double(Line_2(a(1)+4:a(2)+3));    %exatracting coefficient a2 and coverting it to number using str2double
    a3 = str2double(Line_2(a(2)+4:a(3)+3));    %exatracting coefficient a3 and coverting it to number using str2double
    a4 = str2double(Line_2(a(3)+4:a(4)+3));    %exatracting coefficient a4 and coverting it to number using str2double
    a5 = str2double(Line_2(a(4)+4:a(5)+3));    %exatracting coefficient a5 and coverting it to number using str2double

    Line_2 = fgetl(f);
    a = strfind(Line_2,'E');
    a6 = str2double(Line_2(1:a(1)+3));        %exatracting coefficient a6 and coverting it to number using str2double
    a7 = str2double(Line_2(a(1)+4:a(2)+3));   %exatracting coefficient a7 and coverting it to number using str2double
    a8 = str2double(Line_2(a(2)+4:a(3)+3));   %exatracting coefficient a8 and coverting it to number using str2double
    a9 = str2double(Line_2(a(3)+4:a(4)+3));   %exatracting coefficient a9 and coverting it to number using str2double
    a10 = str2double(Line_2(a(4)+4:a(5)+3));  %exatracting coefficient a10 and coverting it to number using str2double

    Line_2 = fgetl(f);
    a = strfind(Line_2,'E');
    a11 = str2double(Line_2(1:a(1)+3));       %exatracting coefficient a11 and coverting it to number using str2double
    a12 = str2double(Line_2(a(1)+4:a(2)+3));  %exatracting coefficient a12 and coverting it to number using str2double
    a13 = str2double(Line_2(a(2)+4:a(3)+3));  %exatracting coefficient a13 and coverting it to number using str2double
a14 = str2double(Line_2(a(3)+4:a(4)+3)); %exatracting coefficient a14 and coverting it to number using str2double- Using fopen( ) & fgetl( ) file start extracting the data.
- Extracted data is in string form which is splitted using strsplit( ).
- String data is converted into number value str2num( ) and assigned appropriate value.
- fgetl( ) is used ignore the next three comment lines using for loop.
- Line containing coefficients are extracted. strfind( ) is used to find a pattern which is E.
- Coefficients are converted to a number using str2double( ).
- Same procedure is performed to obtain coefficients from the next two lines.
- For loop is used to the extracted coefficient of all the species.
Objective 2: Calculate the specific heat, Enthalpy, and Entropy.
Code:
 %Real Gas Comstant 'R' [J/K.mol]
   R = 8.3144;

   %defining temperature array
   T = linspace(local_low_temp,local_high_temp,100);

   % Calculating Specific Heat
   cp = specific_heat(a1,a2,a3,a4,a5,a8,a9,a10,a11,a12,local_med_temp,R,T);

   % Calculating Enthalpy
   H = enthalpy(a1,a2,a3,a4,a5,a6,a8,a9,a10,a11,a12,a13,local_med_temp,R,T);

   % Calculating Entropy
   S = entropy(a1,a2,a3,a4,a5,a6,a7,a8,a9,a10,a11,a12,a13,a14,T,R,local_med_temp,local_high_temp);
Function codes:
#FOR SPECIFIC HEAT

function cp = specific_heat(a1,a2,a3,a4,a5,a8,a9,a10,a11,a12,local_med_temp,R,T)

if (T<= local_med_temp)
    cp = R*(a8 + a9*T + a10*T.^2 +a11*T.^3 + a12*T.^4);
else
    cp = R*(a1 + a2*T + a3*T.^2 +a4*T.^3 + a5*T.^4);


end


#FOR ENTHALPY

function H = enthalpy(a1,a2,a3,a4,a5,a6,a8,a9,a10,a11,a12,a13,local_med_temp,R,T)


if (T<=local_med_temp)
    H = (a8+(a9*T)./2+(a10*(T.^20)./3)+(a11*(T.^3)./4)+(a12*(T.^4)./5)+a13./T)*R.*T;
else
    H = (a1+(a2*T)./2+(a3*(T.^2)./3)+(a4*(T.^3)./4)+(a5*(T.^4)./5)+a6./T)*R.*T;

end


#FOR ENTROPY

function S = entropy(a1,a2,a3,a4,a5,a7,a8,a9,a10,a11,a12,a14,T,R,local_med_temp)
if T>local_med_temp
    S = (a1.*log(T)+a2.*T+a3.*(T.^2)./2+a4.*(T.^3)./3+a5.*(T.^4)./4+a7)*R;
else
    S = (a8.*log(T)+a9.*T+a10.*(T.^2)./2+a11.*(T.^3)./3+a12.*(T.^4)./4+a14)*R;
end
end
- Functions are created to calculate Specific Heat, Enthalpy & Entropy.
- In the main Program function are called.
- In functions using if-else we created two formulas with conditions for the calculation of properties of species for local high temperature and local low temperature.
Objective 3: Calculate the molecular weight of each species and display it in the command window.
Code:
%Calculating Molecular Weight
   [W] = molecular_weight(Species_name);
Function code:
function [W] = molecular_weight(Species_name)
atomic_name = ['H','C','O','N','Ar'];
atomic_weight = [1 , 12.0107 , 15.999 , 14.0067 , 39.948];
W = 0;
for i=1:length(Species_name)
    for j=1:length(atomic_name)
        if Species_name(i)==atomic_name(j)
            W=W+atomic_weight(j);
            position = j;
        end
    end
    n=str2num(Species_name(i));
    if n>=1;
        W=W+atomic_weight(position)*(n-1);
    end
end
fprintf('Molecular Weight of %s = %f', Species_name , W)
disp(' ')
end
- For molecular weight calculation we need to create two databases one of the basic atom and another one of their respective atomic weight.
- Initial mass will be zero i.e. 0.
- For species we will create for loop of iterations equal to the species name.
- Within that another loop is created of iterations atomic name.
- Condition is provided with if species name = atomic name if the condition is satisfied then it will calculate W for that and also position is get defined.
- When there is a number in species we convert it into a number from a string and if it is greater than or equal to the one we calculate W with the formula.
- The logic is simple but applying loops is quite difficult.
Results:
Objective 4: Plot the Cp, H, and S for each species over local temperature range (low temperature : high temperature).
Code:
 %plot: Temperature vs Specific Heat
   figure(1)
   plot(T,cp,'LineWidth',2 , 'Color','b')
   title({'Temperature vs Specific Heat',['Species - ',Species_name]})
   xlabel('Temperature (K)')
   ylabel('Specific Heat (J/kg)')
   grid on
   saveas(1,'Specific Heat.jpg')

   %plot: Temperature vs Enthalpy
   figure(2)
   plot(T,H,'LineWidth',2 , 'Color','r')
   title({'Temperature vs Enthalpy',['Species - ',Species_name]})
   xlabel('Temperature (K)')
   ylabel('Enthalpy (J)')
   grid on
   saveas(2,'Enthalpy.jpg')

   %plot: Temperature vs Entropy
   figure(3)
   plot(T,S,'LineWidth',2 , 'Color','g')
   title({'Temperature vs Entropy',['Species - ',Species_name]})
   xlabel('Temperature (K)')
   ylabel('Entropy (J/K)')
   grid on
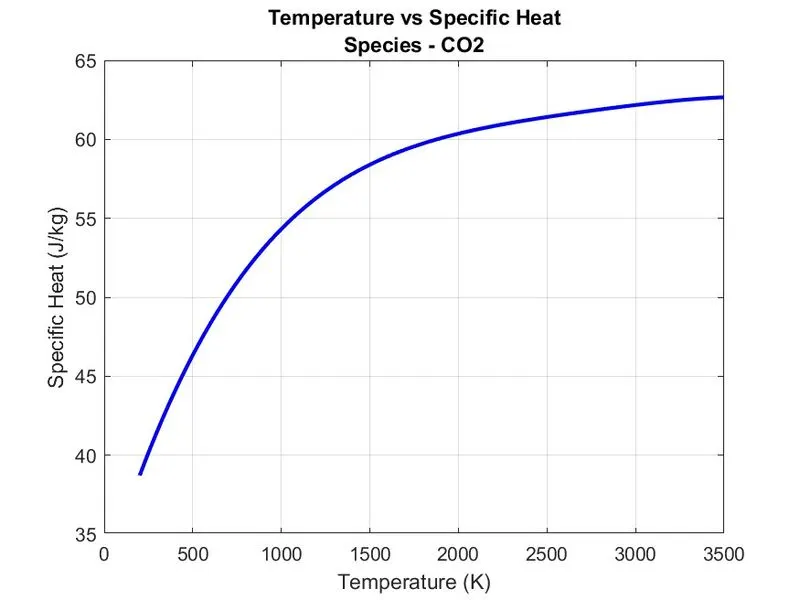
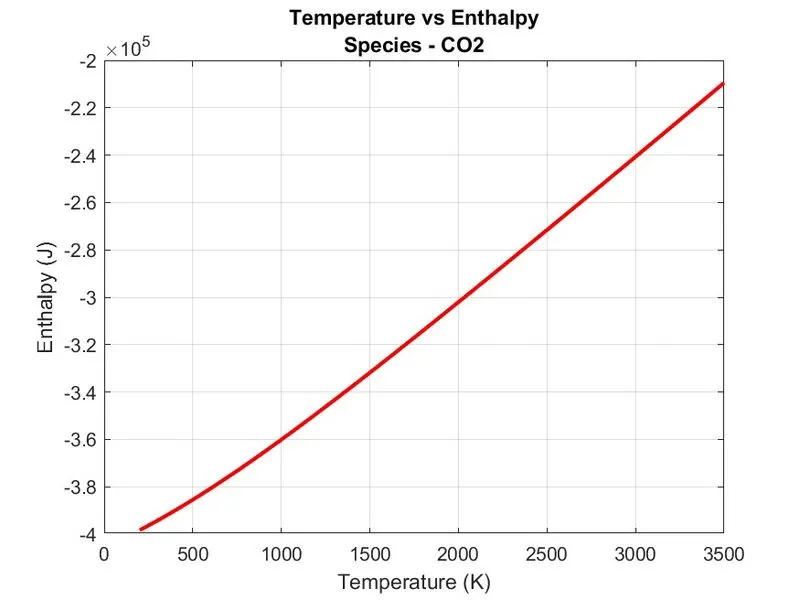
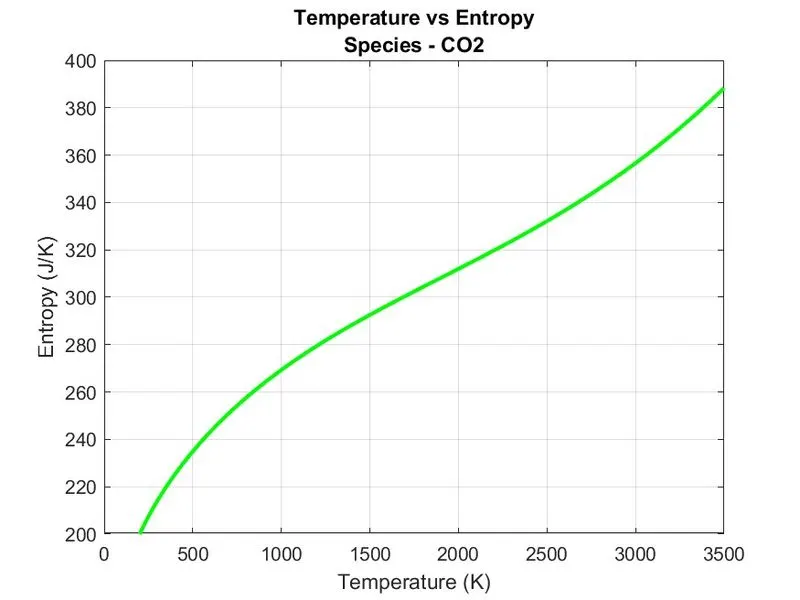
saveas(3,'Entropy.jpg')- The plots are made using the plot( ) function.
- Also figure name is assigned using the figure( ) function.
- Labelled the figure axes in the plot and titled it with graph name and species name.
- Figures are saved using the saveas( ) function.
Objective 5: Save the plots as images with appropriate names and dump them in separate folders for each species with a suitable name. All these should be generated automatically.
Code:
mkdir(Species_name)             %defining directory

   cd(Species_name)              % creating a folder

   %plot: Temperature vs Specific Heat
   figure(1)
   plot(T,cp,'LineWidth',2 , 'Color','b')
   title({'Temperature vs Specific Heat',['Species - ',Species_name]})
   xlabel('Temperature (K)')
   ylabel('Specific Heat (J/kg)')
   grid on
   saveas(1,'Specific Heat.jpg')

   %plot: Temperature vs Enthalpy
   figure(2)
   plot(T,H,'LineWidth',2 , 'Color','r')
   title({'Temperature vs Enthalpy',['Species - ',Species_name]})
   xlabel('Temperature (K)')
   ylabel('Enthalpy (J)')
   grid on
   saveas(2,'Enthalpy.jpg')

   %plot: Temperature vs Entropy
   figure(3)
   plot(T,S,'LineWidth',2 , 'Color','g')
   title({'Temperature vs Entropy',['Species - ',Species_name]})
   xlabel('Temperature (K)')
   ylabel('Entropy (J/K)')
   grid on
   saveas(3,'Entropy.jpg')

   cd ..
- mkdir ( ) function is used to create a directory that creates the folder.
- mkdir(Species_name) creates of species name of getting iterated in a loop
- cd ( ) creates or opens the folder.
- Plots are made using plot command and saved into folder name by species name getting iterated.
- cd .. closes the folder.
- For loop is used over the program to extract co-efficient, calculate Cp, H, S and plot them and dumping them into an appropriate folder of each species.
Main Programme:
close all
clear all
clc

f = fopen("THERMO.dat",'r');
fgetl(f);                    %skipping header i.e. thermo

tline=fgetl(f);              %reading global temperature line as a string
Global_temp=strsplit(tline,' ');       %splitting string to get values

%reading global temperatures
global_low_temp=str2num(Global_temp{2});      %defining and coverting the tempreture from string to number
global_med_temp=str2num(Global_temp{3});
global_high_temp=str2num(Global_temp{4});

%skipping header information
for i=1:3   %using for loop to do operation 3 times on 3 line comment
fgetl(f);
end

%extracting species and coefficients
for i=1:53
    Line_1 = fgetl(f);          %extracting 1st line
    S = strsplit(Line_1,' ');   %splitting string
    Species_name = S{1};        %extracting species name
    t = strfind(Line_1,'G ');   %extracting local temperature values string
    temp_values = Line_1(t+2:length(Line_1)); %creating string
    local_temp = strsplit(temp_values,' ');    % spliting those strings
    local_low_temp=str2num(local_temp{2});   %coverting string to number
    local_med_temp=str2num(local_temp{4});
    local_high_temp=str2num(local_temp{3});

    Line_2 = fgetl(f);                         %reading 2nd line of data
    a = strfind(Line_2,'E');                   %finding position of E from string line_2
    a1 = str2double(Line_2(1:a(1)+3));         %exatracting coefficient a1 and coverting it to number using str2double
    a2 = str2double(Line_2(a(1)+4:a(2)+3));    %exatracting coefficient a2 and coverting it to number using str2double
    a3 = str2double(Line_2(a(2)+4:a(3)+3));    %exatracting coefficient a3 and coverting it to number using str2double
    a4 = str2double(Line_2(a(3)+4:a(4)+3));    %exatracting coefficient a4 and coverting it to number using str2double
    a5 = str2double(Line_2(a(4)+4:a(5)+3));    %exatracting coefficient a5 and coverting it to number using str2double

    Line_2 = fgetl(f);
    a = strfind(Line_2,'E');
    a6 = str2double(Line_2(1:a(1)+3));        %exatracting coefficient a6 and coverting it to number using str2double
    a7 = str2double(Line_2(a(1)+4:a(2)+3));   %exatracting coefficient a7 and coverting it to number using str2double
    a8 = str2double(Line_2(a(2)+4:a(3)+3));   %exatracting coefficient a8 and coverting it to number using str2double
    a9 = str2double(Line_2(a(3)+4:a(4)+3));   %exatracting coefficient a9 and coverting it to number using str2double
    a10 = str2double(Line_2(a(4)+4:a(5)+3));  %exatracting coefficient a10 and coverting it to number using str2double

    Line_2 = fgetl(f);
    a = strfind(Line_2,'E');
    a11 = str2double(Line_2(1:a(1)+3));       %exatracting coefficient a11 and coverting it to number using str2double
    a12 = str2double(Line_2(a(1)+4:a(2)+3));  %exatracting coefficient a12 and coverting it to number using str2double
    a13 = str2double(Line_2(a(2)+4:a(3)+3));  %exatracting coefficient a13 and coverting it to number using str2double
    a14 = str2double(Line_2(a(3)+4:a(4)+3));  %exatracting coefficient a14 and coverting it to number using str2double

   %Real Gas Comstant 'R' [J/K.mol]
   R = 8.3144;

   %defining temperature array
   T = linspace(local_low_temp,local_high_temp,100);

   % Calculating Specific Heat
   cp = specific_heat(a1,a2,a3,a4,a5,a8,a9,a10,a11,a12,local_med_temp,R,T);

   % Calculating Enthalpy
   H = enthalpy(a1,a2,a3,a4,a5,a6,a8,a9,a10,a11,a12,a13,local_med_temp,R,T);

   % Calculating Entropy
   S = entropy(a1,a2,a3,a4,a5,a6,a7,a8,a9,a10,a11,a12,a13,a14,T,R,local_med_temp,local_high_temp);

   %Calculating Molecular Weight
   [W] = molecular_weight(Species_name);

   mkdir(Species_name)             %defining directory

   cd(Species_name)              % creating a folder

   %plot: Temperature vs Specific Heat
   figure(1)
   plot(T,cp,'LineWidth',2 , 'Color','b')
   title({'Temperature vs Specific Heat',['Species - ',Species_name]})
   xlabel('Temperature (K)')
   ylabel('Specific Heat (J/kg)')
   grid on
   saveas(1,'Specific Heat.jpg')

   %plot: Temperature vs Enthalpy
   figure(2)
   plot(T,H,'LineWidth',2 , 'Color','r')
   title({'Temperature vs Enthalpy',['Species - ',Species_name]})
   xlabel('Temperature (K)')
   ylabel('Enthalpy (J)')
   grid on
   saveas(2,'Enthalpy.jpg')

   %plot: Temperature vs Entropy
   figure(3)
   plot(T,S,'LineWidth',2 , 'Color','g')
   title({'Temperature vs Entropy',['Species - ',Species_name]})
   xlabel('Temperature (K)')
   ylabel('Entropy (J/K)')
   grid on
   saveas(3,'Entropy.jpg')

   cd ..


   end
Attachments
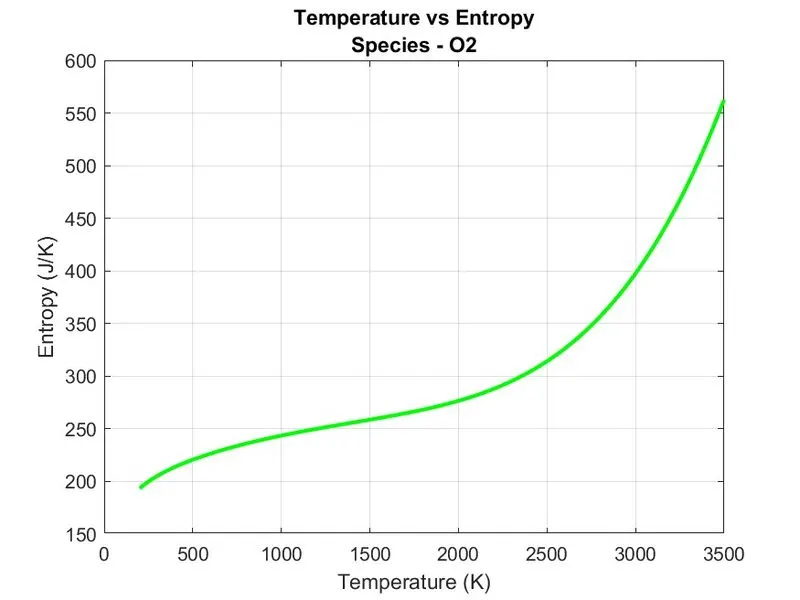
O2 plots:
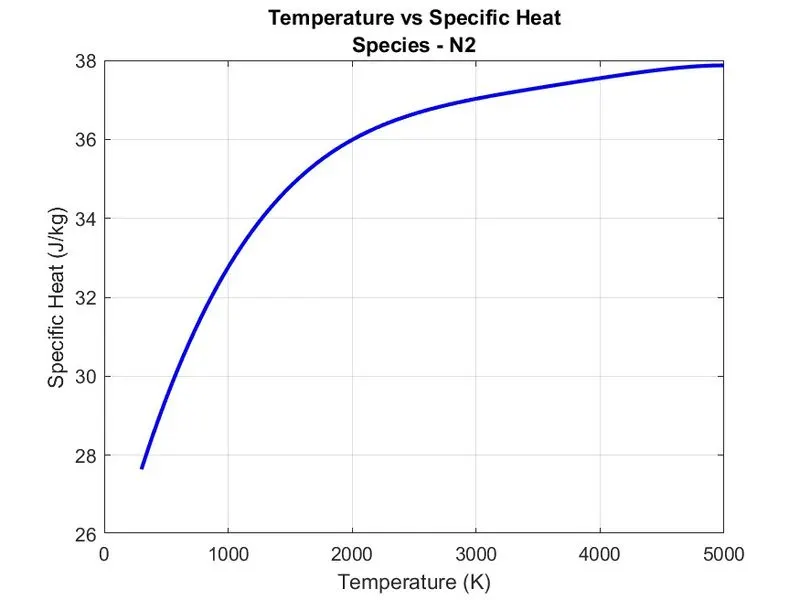
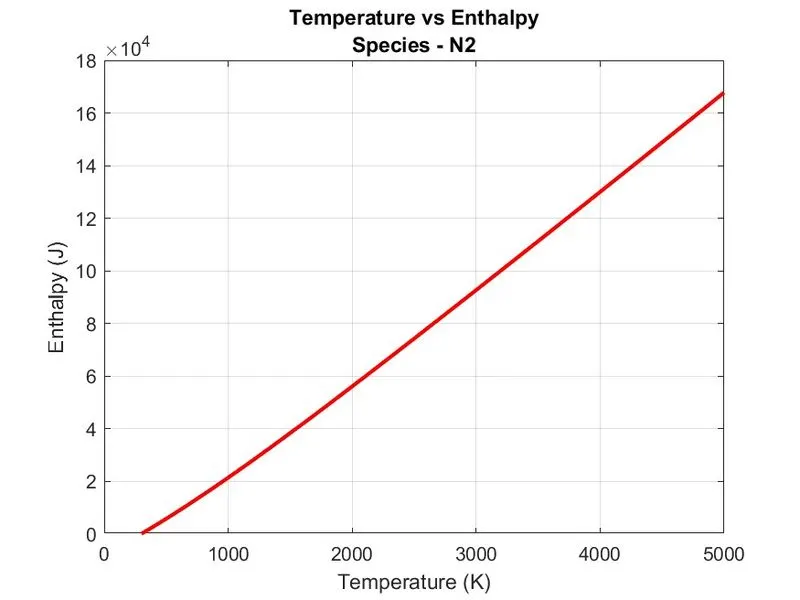
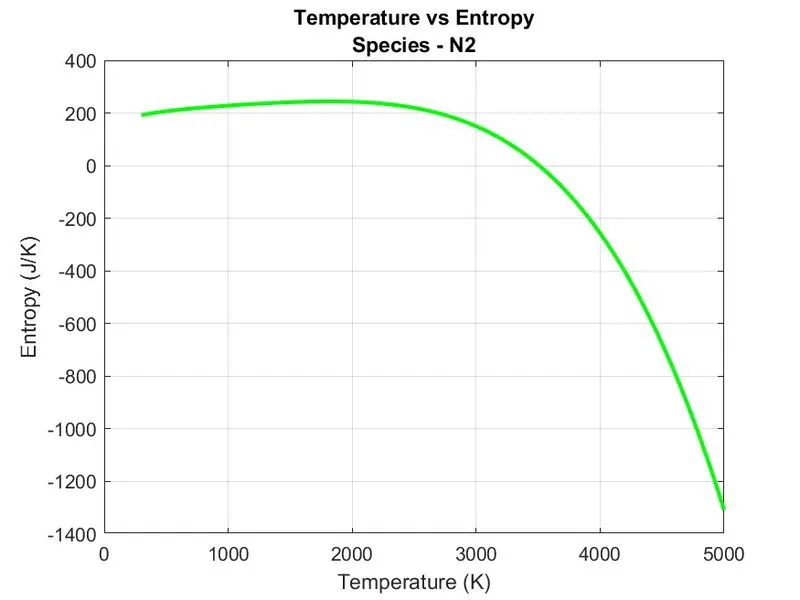
N2 plots:
CO2 plots:
Folders Created

Conclusion
- All five objectives are achieved.
- Each species has a varied graph for properties against temperature.
- The file containing thermodynamic data is extracted easily using Matlab functions.
Reference
- com
- graylog.org/post/log-file-parsing
- Youtube Channel - Matlab
- https://skill-lync.com/student-projects/project-1-parsing-nasa-thermodynamic-data-227
- https://skill-lync.com/student-projects/NASA-THERMODYNAMIC-FILE-PARSING-USING-MATLAB-77644
THANK YOU