Project 1 - Parsing NASA thermodynamic data
AIM: parsing NASA thermodynamic data
parsing:
To parse is to break up a sentence or group of words into separate components, and script it in a high-level language that can be compiled and converted into machine language. so that the user can get the data that he wants.
NASA came up with a polynomial concept to calculate specific heat, enthalpy, and entropy by using the 14 coefficients in which the first 7 coefficient represents for higher temperature range and the second 7 coefficients represent for lower temperature range.
NASA provided the document of coefficients for 1000+ species. so our aim is to parse this data and represent in the form of the script so that data for a particular species can be easily accessible to the end-user.
polynomial equations
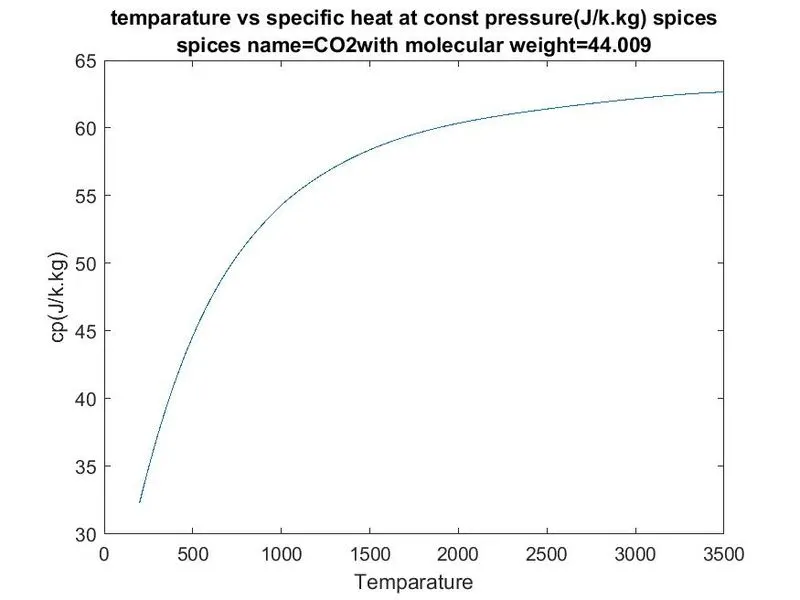
cp=specific heat (j/kg.k)
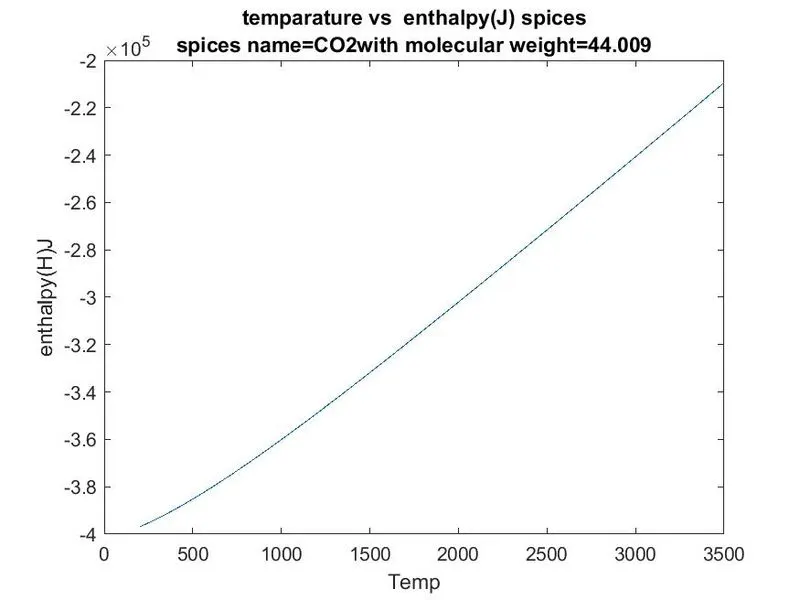
H=enthalpy (j)
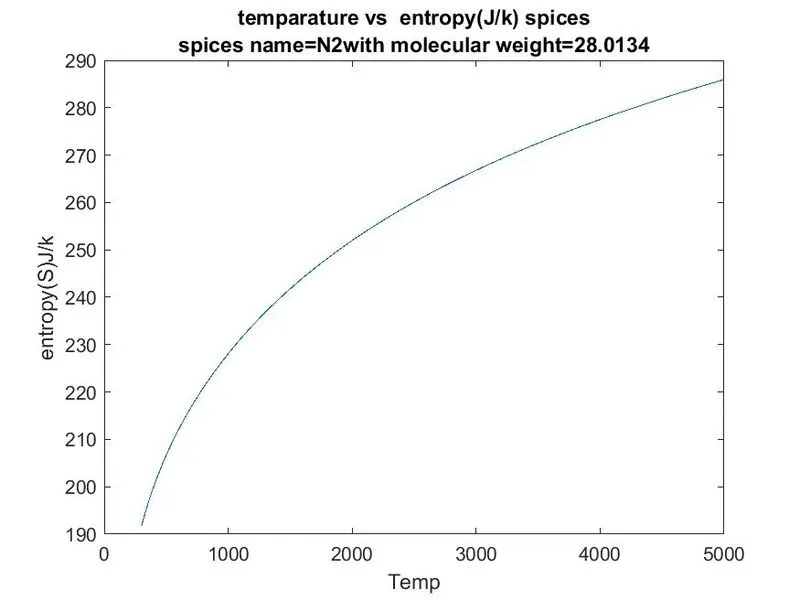
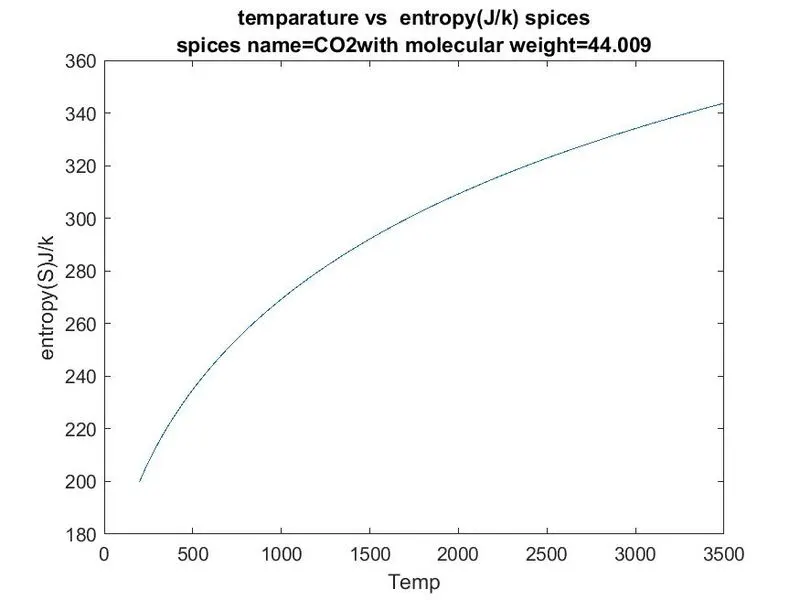
S=entropy (j/k)
R=universal gas constant (j/mol.k)
T(or) t=temparature (k)
specific heat at constant pressure: it can be defined as the amount of heat supplied at constant pressure to increase the temp of unit mass by unit degree of temperature.
enthalpy: The enthalpy H of a thermodynamic system is defined as the sum of its internal energy and the product of its pressure and volume
entropy: entropy, the measure of a system's thermal energy per unit temperature that is unavailable for doing useful work. Because work is obtained from ordered molecular motion, the amount of entropy is also a measure of the molecular disorder, or randomness, of a system
explanation of code:
reading header
step 1:
first we open the file by fopen command and define the file with a variable
step2:
extracting data through fgetl and fscanf commands
fgetl: this command copies the particular line of data into the variable assigned to it in the string data type. this command will copy a new line every time it exegeted depending upon the sequence it runs.
fscanf: this will copy the numerical data and arrange it in the form of arrays in user-defined size
step3: editing of extracted data by using strsplit
this command split extracted data from fgetl command into string elements by eliminating characters and spaces in it and stored in an array format in cell data type.
step4: from the data available after step 3, global maximum, minimum, and higher temperatures are stored separately
step5:
initiating for loop with fgetl command to skip the comment lines
reading species blocks
step6: to read first line of block fgetl command is used and to read remaining co efficents fscanf command is used
step5: after splitting the line from fgetl command the species name is stored in a separate variable for easy identification.
step6:
as the stored species name is cell type therefore it is converted into string data type and the local temperature values are stored in separate variables.
step7:
the co-efficients stored in array are arranged randomlyin co variable these are arranged in proper sequence as identical to data in file by inversing co and stored in col
step8:
for loop is initiated to remove or make zero the unvanted values in ((2,2)and(2,3)) positions results are stored in array of a4*4.
function for calculation of molecular weight is called with inut of species name.and the output is printed with fprintf command
step9:initiating for loop with temperature range in which coefficients are stored in specified variables a1,a2......a7 after checking the if state meant.
step10: after extracting all the coefficients into perticular variables at same time functions of cp,H,S are called into that if statement and the results of functions are stored in array separately.and for loop is ended.
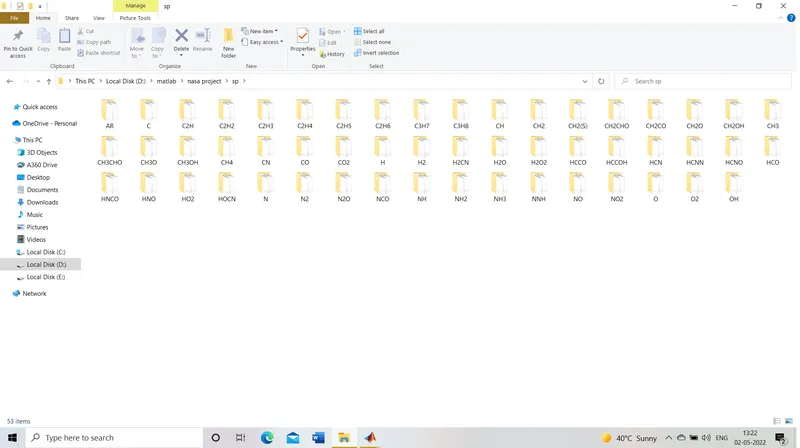
step11:to save the plots a separate directory is created with mkdir('sp') command
to enter into the directory created cd ('sp')command is used .cd means change in directory.
after entering into sp folder we need to create folder for every species with their names so, following syntax is used
mkdir(st2); hear:st2 is avariable containing species name
cd(st2);
step11: plotts of cp,H,S with respect to temperature are coded after getting array of cp,H,S at every temp of perticular species. after plotting every plot it going to be save in present opened directory in .jpg format by using command of saveas
syntax: saveas(fig,filename,formattype)
step12: after saving all plots for a species we need to close the directory with cd .. command
as we opened two directories we need to close two directiies so that it will return in older folder where the main coding is present.
step13: if all the species are exigueted then according to loop it will store last line of data file END into species name .to end the program this END is used in if statement with brake commandwhich is initiated after step6
function for calculation of molecular weight
%  FUNCTION FOR MOLECULAR WEIGHT

function  w=molicular_weight(st2)

atoms =['H','C','N','O','A'];  %molicular species are formed with these atoms
atomic_mass=[1.0078,12.011,14.0067,15.999,39.948]; %mass of each atom as in the order they are considered
w=0;  %initialising molicular weight with zero
n=length(atoms);

 for i=1:length(st2) %reprasents echa letter of the species that obtaines as input fron main code
     for j=1:n %reprasents the each atom stored in atoms
         if isequal(st2(i),atoms(j))  %if first leter maches with atom in atoms variable  molicular weight is added
             w=w+atomic_mass(j);
             pos=j;  %stores the position of last charecter that entered into if statement
         end
     end
     numb=str2num(st2(i));  % as the input is in string it converts number in strng data type to number data type
     if numb>=1
         w=w+atomic_mass(pos)*(numb-1);  % multiplies atomic mas with value after numb-1 and added it to previous molicular weight
     end
 end
these functions are exguted according to the temperature range specified in main code it self and the equations are modified for to get proper output
function for cp
%functions for calculation of specific heat at constant pressure

function  cp =cp1(T,R,a1,a2,a3,a4,a5)
   cp=R*(a1+(a2.*T)+(a3.*T^2)+(a4.*T^3)+(a5.*T^4));
end
function for enthalpy(H)
%function for calculation of enthalpy

function H=enthalpy(T,R,a1,a2,a3,a4,a5,a6)

H=R*T*(a1+((a2*T)/2)+((a3*T^2)/3)+((a4*T^3)/4)+((a5*T^4)/5)+((a6)/T));
end
function for entropy(S)
%function for entropy

function S=entropy(T,R,a1,a2,a3,a4,a5,a7)
S=R*(a1*log(T)+(a2*T)+((a3*T^2)/2)+((a4*T^3)/3)+((a5*T^4)/4)+a7); % usage of log while writting func ln should be log
end
main code which will exiguted taking thermo.data file as input after running the code:
% program to executing every species cp, H, S  plots and printing their molecular weight
%%
close all;  %closes all graphical windows
clear all;  %clears workspace
clc;        %cleares command window
%% file parsing

f=fopen('THERMO.dat','r'); %file parsing started with file opening and it is defined by a vriable

%reading header
x=fgetl(f);                %fgetl command reads the one line once and stores the data in string data type
d=fscanf(f,'%f',[1 3]);    %fscanf command reads the line from defined file and store the values in user-defined  size of array in number datatype

%storing temp in different variables
% storing values in separate variables which are extracted from the previous command

global_low_tem=d(1);
globa_mid_temp=d(2);
global_hig_temp=d(3);
%% skipping comments
%readin of btackets
for i=1:4
q=fgetl(f);
end
%%
E={'END'};  %variable defines the endpoint of the data file
mkdir('sp'); % creating new folder to store plots for each species separately
%% looping for different species

for  k=1:300

    st=fgetl(f);       %as mentioned this command prins next new line after everey exigution ouput is in cell data type
    s1=strsplit(st,' ');  %splitting the line extracted from previous commandby eliminating gaps
    sp=s1(1);           %separating species name(cell data type) to a separate variable
    %% condition for ending loop
    if isequal(sp,E)     %statement exigueted after reaching end of the data file
        break           %  it will terminates the loop
    end
    %%  arranging and extracting constanstants
    co=fscanf(f,'%f',[4 inf]);  %extracts all the coefficient values in array
    st2=strjoin(sp(1));  %converting cell data type to string
    % separating local temp values
    local_low_temp=str2num(s1{length(s1)-3});
    local_high_temp=str2num(s1{length(s1)-2});
    local_medium_temp=str2num(s1{length(s1)-1});
    %re-arranging array of co like values in file
    co1=co';
    %storing coefficients by making unvanted cells zero
       for i=1:(length(co1)-1)
        for j=1:(length(co1)-1)
          if (i==2&&j==2)||(i==3&&j==4)
              continue
          end
              a(i,j)=co1(i,j);
         end
       end
 %% creating loop for calculating cp,H,S at every temp values for each species
l=local_low_temp;
m=local_medium_temp;
h=local_high_temp;
R=8.314;  %universal gas constant j/mol.k
i=1;  %reprasents rows to store calculated values of cp,H,S in the form of arrays
j=1;   %reprasents column for above array

 for t=linspace(l(1),h(1),1000)
   if (t>=m)
    a1=a(1,1);
    a2=a(1,2);
    a3=a(1,3);
    a4=a(1,4);
    a5=a(2,1);
    a6=a(2,3);
    a7=a(2,4);
    % calling functions to calculate cp,H,S
    cp=cp1(t,R,a1,a2,a3,a4,a5);
    H=enthalpy(t,R,a1,a2,a3,a4,a5,a6);
    S=entropy(t,R,a1,a2,a3,a4,a5,a7);
    % array formation for ploting
    result_cp(i,j)=cp;
    result_H(i,j)=H;
    result_S(i,j)=S;

    i=i+1;  %incrementing rows
   else   %if above statemet wrong below commands are exiguted
    a1=a(3,1);
    a2=a(3,2);
    a3=a(3,3);
    a4=a(4,1);
    a5=a(4,2);
    a6=a(4,3);
    a7=a(4,4);
    cp=cp1(t,R,a1,a2,a3,a4,a5);
    H=enthalpy(t,R,a1,a2,a3,a4,a5,a6);
    S=entropy(t,R,a1,a2,a3,a4,a5,a7);
    result_cp(i,j)=cp;
    result_H(i,j)=H;
    result_S(i,j)=S;
    i=i+1;
   end

 end
 %% printing molicular weight values
 %function to calculate molicular weight by taking species name as input
 w=molicular_weight(st2);
 result_w(k,1)=w; %storing values of w in array
 fprintf('molicular weight of %s =%f',st2,w) %displays molicular weight with species name
 fprintf('\n')  %for new line
 %% creating directories
 cd('sp')   %changes current directory to specifies directory
 mkdir(st2)  %creats another folder with different species names for every itteration it runs under new directory
 cd(sprintf(st2)) %changing directory every time to the newly created folder

 %% plotting

 T=linspace(l(1),h(1),1000);  %defining temparature range

 % plot for temparature vs specific heat
 figure(1)
 plot(T,result_cp);
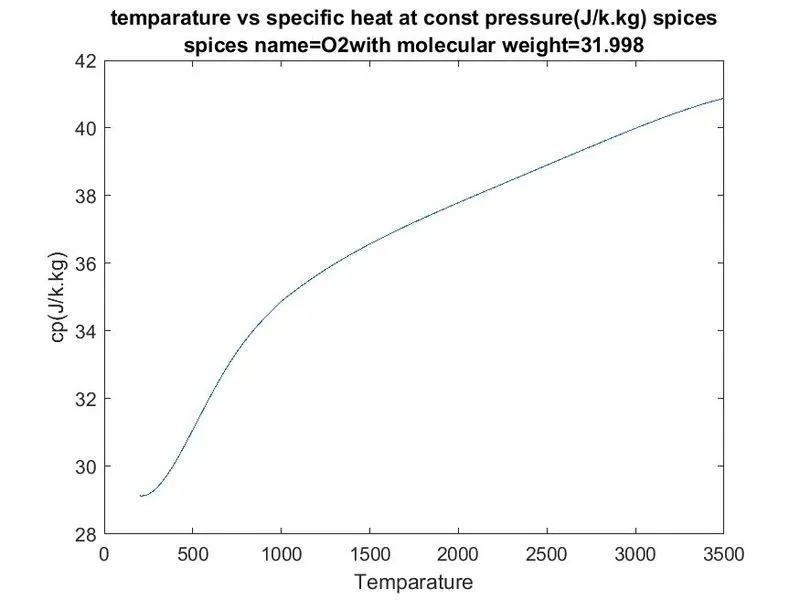
 title({'temparature vs specific heat at const pressure(J/k.kg) spices';['spices name=',st2,'with molecular weight=',num2str(w)]})
 xlabel('Temparature')
 ylabel('cp(J/k.kg)')
 saveas(figure(1),'specific heat.jpg')  %saving plot to the newly crated folders in .jpg format

 % plot for temparature vs enthalpy
 figure(2)
 plot(T,result_H)
 title({'temparature vs  enthalpy(J) spices';['spices name=',st2,'with molecular weight=',num2str(w)]})
 xlabel('Temp')
 ylabel('enthalpy(H)J')
 saveas(figure(2),'enthalpy.jpg'); %saving plot in .jpg format

 % plot for temparature vs entropy
 figure(3)
 plot(T,result_S)
 title({'temparature vs  entropy(J/k) spices';['spices name=',st2,'with molecular weight=',num2str(w)]})
 xlabel('Temp')
 ylabel('entropy(S)J/k')
 saveas(figure(3),'entropy.jpg');   %saving plot in .jpg format
 cd ..  %closing st2 directory e.i.,returning to parent diectory(sp)
 cd ..  %closing sp directory returning to parent directory(old directory(nasa project))


end      %end of the loop
output:
molecular weights of all species
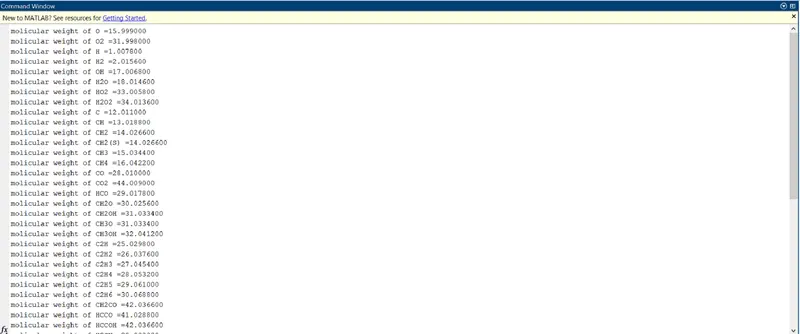
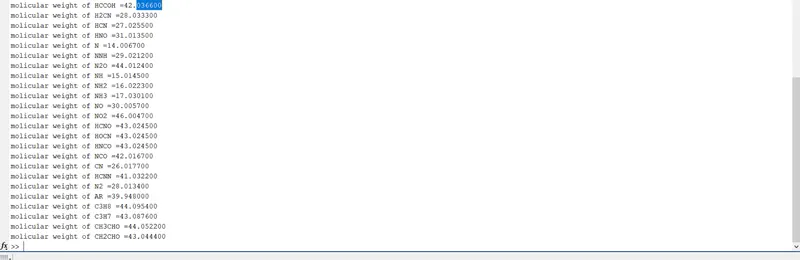
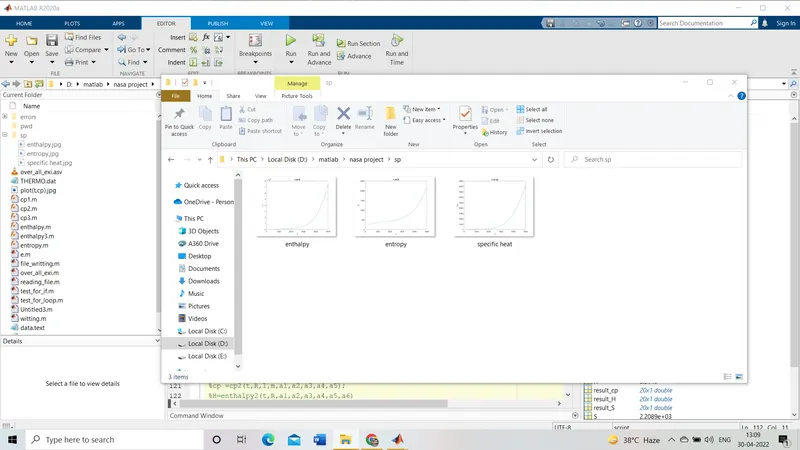
plots for every species store in separate folder
plots of O2
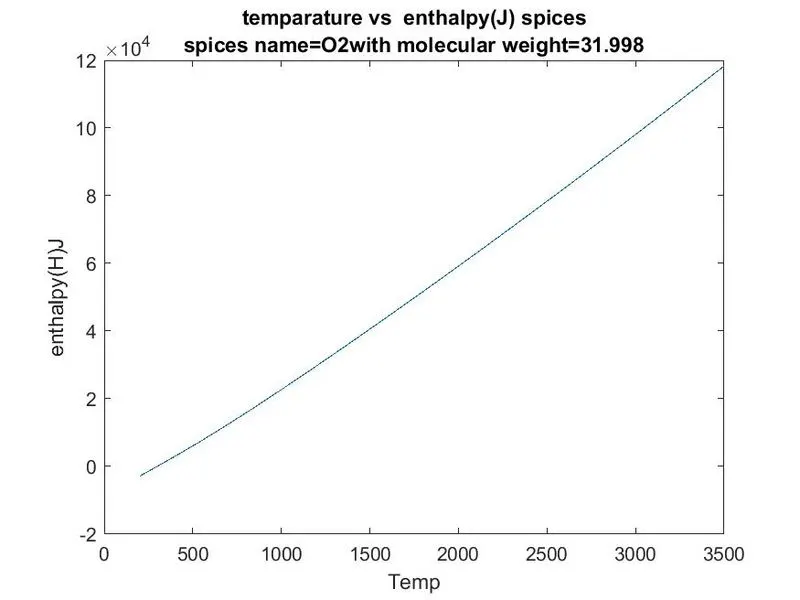
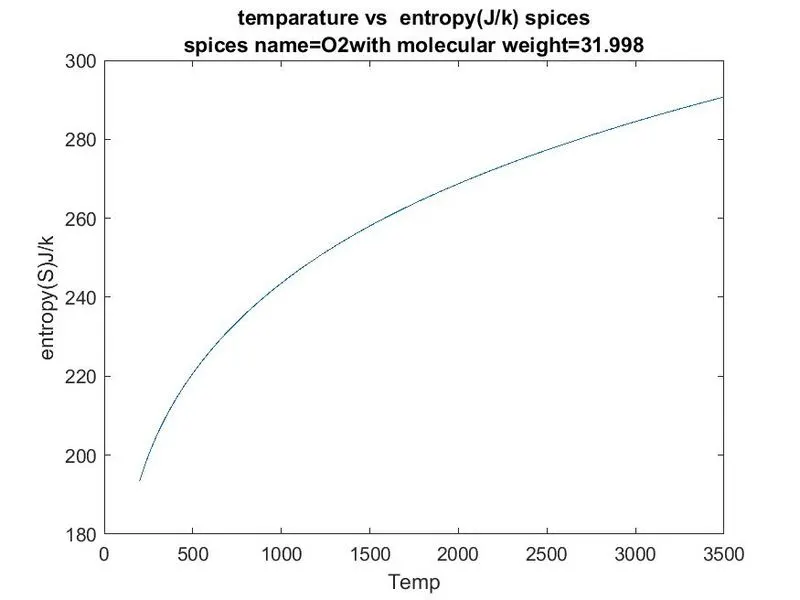
plots of N2
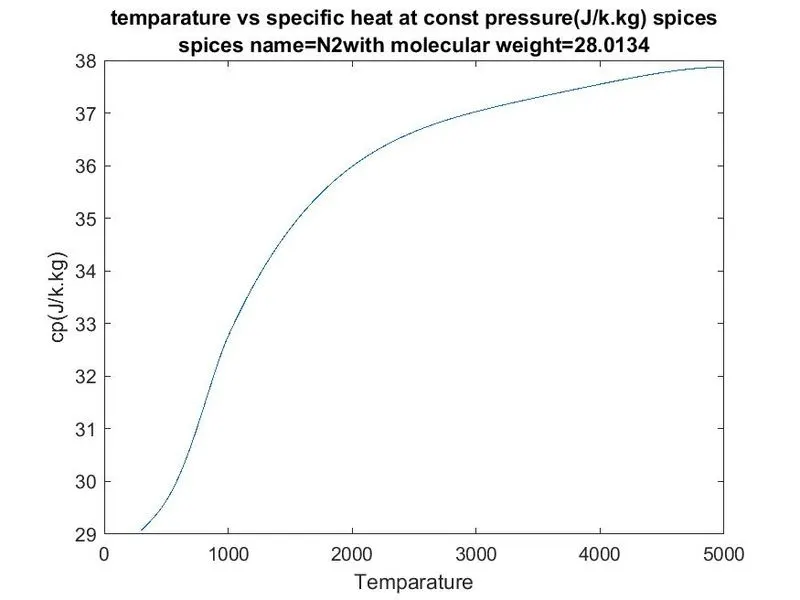
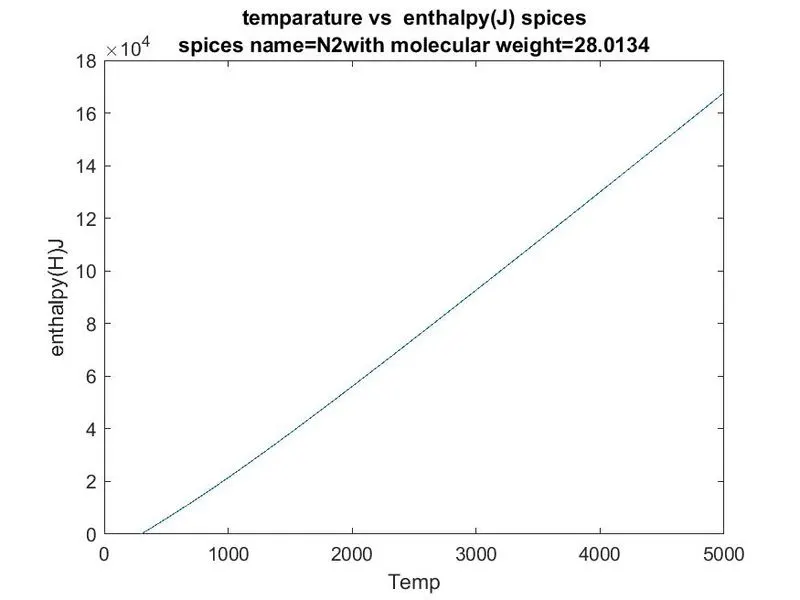
plots of CO2
errors:
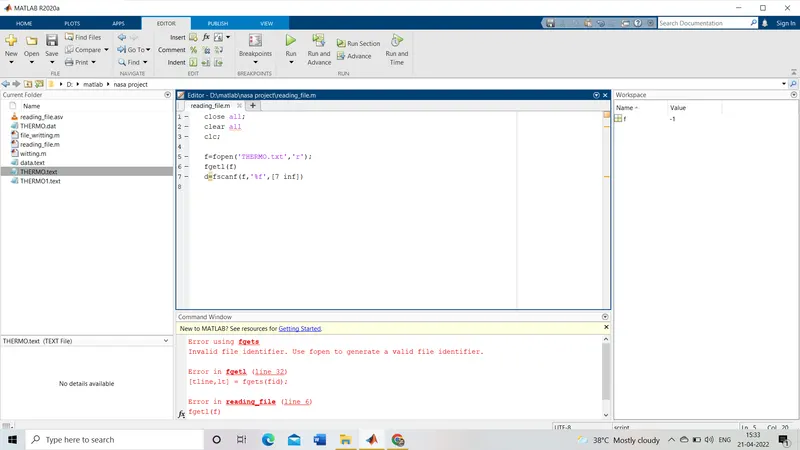
- file to be opened in the form of is taken as .txt instead of .dat
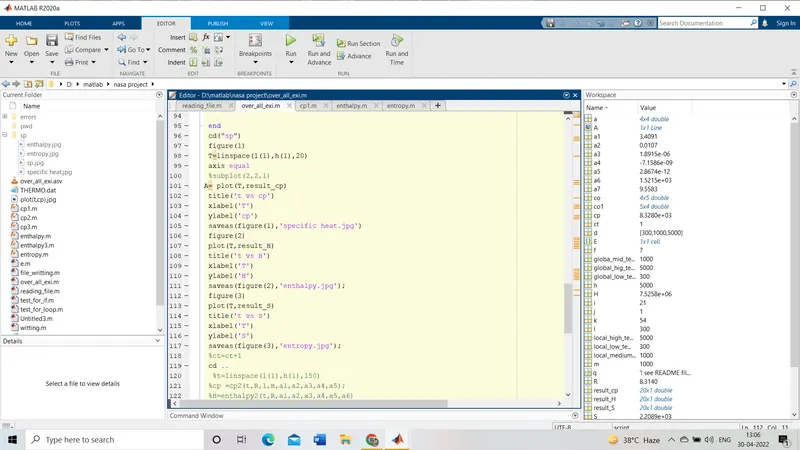
- even though coding going well plots are over writened and stored in created directory directory this is over come by again opening the second directory with species name and changing directory to that species as explained in step11
- graphs obtained by wrong specification of temperature ranges e.i.,first 7 co-efficients are assigned with in lower temperature range and vise versa it is over come by changing temperature ranges to correct order
codes written on own interest
- this code take species name as input only and give results for that species only
this code will take space name from end-user and give results for molecular weight and plots of cp,H,S for specific species and the plots are store in separate folder
logic for this code is same as above but after taking input from end-user .that input is stored in a variable B and check for if state meant if the species name and input is equal or not if equal it will exigute from step6-step13. if statement is not satisfied it will run another loop and check for another species it goes on continuously until stement become correct or till the loop reaches end.
then breack command ends the code from further run then if statement is ended
%% program for displaying results of particular species on the basis of user-defined input
close all;
clear all
clc;
%% file parsing
f=fopen('THERMO.dat','r');%file parsing started with file opening and it is defined by a variable

%reading header
y=fgetl(f);  %fgetl command reads the one line once and stores the data in string data type

d=fscanf(f,'%f',[1 3]); %fscanf command reads the line from defined file and store the values in user defined arraays in number datatype

%storing temp in different variables
% storing values in separate variables which are extracted from the previous command

global_low_tem=d(1)
globa_mid_temp=d(2)
global_hig_temp=d(3)
%% skipping comments
%readin of btackets
for i=1:3
q=fgetl(f);
end
%%
E={'END'};%variable defines the end point of data file
mkdir('sp1');
%% looping for different species
%species
B=inputdlg('enter species name in upper case','s'); %opens a dilog box takes input as species name in CAPITAL LETTERS

for k=1:300
    %%
    st=fgetl(f); %as mentioned this command prins next new line after everey exigution ouput is in cell data type
    s1=strsplit(st,' ');  %splitting the line extracted from previous commandby eliminating gaps
    st1=s1(1);   %separating species name(cell data type) to a separate variable
    if isequal(st1,E)  % if the loop reches end of table and if no maches are found it will show an error
        d=msgbox("no data available for thae species or check the species name you entered","Error","error")
        break
    end
    %% arranging and extracting constants
    co=fscanf(f,'%f',[4 inf]);

      if isequal(st1,B)  % if there is match found below commands are exigueted
       %loading local temparature values
            st2=strjoin(st1);
            fprintf('temp values of  %s',B{1})  %printing species name for identification b contain cell datatype input
            local_low_temp=str2num(s1{length(s1)-3})
            local_high_temp=str2num(s1{length(s1)-2})
            local_medium_temp=str2num(s1{length(s1)-1})
            co1=co';
            %storing coefficients
           for i=1:(length(co1)-1)
             for j=1:(length(co1)-1)
                  if (i==2&&j==2)||(i==3&&j==4)
                   continue
                  end
                   a(i,j)=co1(i,j);
             end
           end
 %% chekking for existance of input temparature with in the range
l=local_low_temp;
m=local_medium_temp;
h=local_high_temp;
%x=inputdlg('enter temparature value ');  %x is in cell type data
%x=cell2mat(x);   %noow x is cover ted to char
%x=str2double(x);% now x is converted to double so that i can use it in if statement because l,m,h are double data types

R=8.314 %univesal gas constant (j/mol.k)
i=1;
j=1;
  for x=linspace(l(1),h(1),1000)
  if (x>=m) %le=less than equal to and ge=greater than equal to
    a1=a(1,1);
    a2=a(1,2);
    a3=a(1,3);
    a4=a(1,4);
    a5=a(2,1);
    a6=a(2,3);
    a7=a(2,4);
    %% calling functions
    cp=cp1(x,R,a1,a2,a3,a4,a5)  %specific heat(j/kg.k)
    H=enthalpy(x,R,a1,a2,a3,a4,a5,a6)  %enthalpy(j)
    S=entropy(x,R,a1,a2,a3,a4,a5,a7)  %entropy(j/k)
    result_cp(i,j)=cp;
    result_H(i,j)=H;
    result_S(i,j)=S;

    i=i+1;
  else
    a1=a(3,1);
    a2=a(3,2);
    a3=a(3,3);
    a4=a(4,1);
    a5=a(4,2);
    a6=a(4,3);
    a7=a(4,4);
    cp=cp1(x,R,a1,a2,a3,a4,a5)
    H=enthalpy(x,R,a1,a2,a3,a4,a5,a6)
    S=entropy(x,R,a1,a2,a3,a4,a5,a7)
    result_cp(i,j)=cp;
    result_H(i,j)=H;
    result_S(i,j)=S;

    i=i+1;

  end
  end
 %% printing molicular weight values
 %function to calculate molicular weight by taking species name as input
 w=molicular_weight(st2);
 fprintf('molicular weight of %s =%f',st2,w) %displays molicular weight with species name
 fprintf('\n')  %for new line
 %% creating directories
 cd('sp1')   %changes current directory to specifies directory
 mkdir(st2)  %creats another folder with different species names for every itteration it runs under new directory
 cd(sprintf(st2))
    %% ploting

 T=linspace(l(1),h(1),1000);  %defining temparature range

 % plot for temparature vs specific heat
 figure(1)
 plot(T,result_cp);
 title({'temparature vs specific heat at const pressure(J/k.kg) spices';['spices name=',st2,'with molecular weight=',num2str(w)]})
 xlabel('Temparature')
 ylabel('cp(J/k.kg)')
 saveas(figure(1),'specific heat.jpg')  %saving plot to the newly crated folders in .jpg format

 % plot for temparature vs enthalpy
 figure(2)
 plot(T,result_H)
 title({'temparature vs  enthalpy(J) spices';['spices name=',st2,'with molecular weight=',num2str(w)]})
 xlabel('Temp')
 ylabel('enthalpy(H)J')
 saveas(figure(2),'enthalpy.jpg'); %saving plot in .jpg format

 % plot for temparature vs entropy
 figure(3)
 plot(T,result_S)
 title({'temparature vs  entropy(J/k) spices';['spices name=',st2,'with molecular weight=',num2str(w)]})
 xlabel('Temp')
 ylabel('entropy(S)J/k')
 saveas(figure(3),'entropy.jpg');   %saving plot in .jpg format
 cd ..  %closing st2 directory e.i.,returning to parent diectory(sp)
 cd ..  %closing sp directory returning to parent directory(old directory(nasa project))

 break %after executing if command this will break the loop from remaining iterations
end
end- this code will take two inputs species name and perticular temperature value and it will return results of molecular weight,cp ,H ,S at perticular temperature only
logic for this code also same as first one conde can be under stood by comments included in it
this code small modified version for above code for loop not initiated for temperature ranges as in above code instead that temparater range specified with in if statement it will check for input from end-user is with in the range or not if not it will show an error with popup box
%% program for displaying results of particular species on the basis of user-defined input
close all;
clear all
clc;
%% file parsing
f=fopen('THERMO.dat','r');%file parsing started with file opening and it is defined by a variable

%reading header
y=fgetl(f);  %fgetl command reads the one line once and stores the data in string data type

d=fscanf(f,'%f',[1 3]); %fscanf command reads the line from defined file and store the values in user defined arraays in number datatype

%storing temp in different variables
% storing values in separate variables which are extracted from the previous command

global_low_tem=d(1)
globa_mid_temp=d(2)
global_hig_temp=d(3)
%% skipping comments
%readin of btackets
for i=1:3
q=fgetl(f);
end
%%
E={'END'};%variable defines the endpoint of the data file
%% looping for different species
%species
B=inputdlg('enter species name in upper case','s'); %opens a dilog box takes input as species name in CAPITAL LETTERS

for k=1:300
    %%
    st=fgetl(f); %as mentioned this command prins next new line after everey exigution ouput is in cell data type
    s1=strsplit(st,' ');  %splitting the line extracted from previous commandby eliminating gaps
    st1=s1(1);   %separating species name(cell data type) to a separate variable
    if isequal(st1,E)  % if the loop reches end of table and if no maches are found it will show an error
        d=msgbox("no data available for thae species or check the species name you entered","Error","error")
        break
    end
    %% arranging and extracting constants
    co=fscanf(f,'%f',[4 inf]);

      if isequal(st1,B)  % if there is match found below commands are exigueted
       %loading local temparature values
            st2=strjoin(st1);
            fprintf('temp values of  %s',B{1})  %printing species name for identification b contain cell datatype input
            local_low_temp=str2num(s1{length(s1)-3})
            local_high_temp=str2num(s1{length(s1)-2})
            local_medium_temp=str2num(s1{length(s1)-1})
            co1=co';
            %storing coefficients
           for i=1:(length(co1)-1)
             for j=1:(length(co1)-1)
                  if (i==2&&j==2)||(i==3&&j==4)
                   continue
                  end
                   a(i,j)=co1(i,j);
             end
           end
 %% chekking for existance of input temparature with in the range
l=local_low_temp;
m=local_medium_temp;
h=local_high_temp;
x=inputdlg('enter temparature value ');  %x is in cell type data
x=cell2mat(x);   %noow x is cover ted to char
x=str2double(x);% now x is converted to double so that i can use it in if statement because l,m,h are double data types

R=8.314 %univesal gas constant (j/mol.k)

  if  le(x,m)&& ge(x,m) %le=less than equal to and ge=greater than equal to
    a1=a(1,1);
    a2=a(1,2);
    a3=a(1,3);
    a4=a(1,4);
    a5=a(2,1);
    a6=a(2,3);
    a7=a(2,4);
    %% calling functions
    cp=cp1(x,R,a1,a2,a3,a4,a5)  %specific heat(j/kg.k)
    H=enthalpy(x,R,a1,a2,a3,a4,a5,a6)  %enthalpy(j)
    S=entropy(x,R,a1,a2,a3,a4,a5,a7)  %entropy(j/k)
elseif ge(x,l)&& le(x,m)
    a1=a(3,1);
    a2=a(3,2);
    a3=a(3,3);
    a4=a(4,1);
    a5=a(4,2);
    a6=a(4,3);
    a7=a(4,4);
    cp=cp1(x,R,a1,a2,a3,a4,a5)
    H=enthalpy(x,R,a1,a2,a3,a4,a5,a6)
    S=entropy(x,R,a1,a2,a3,a4,a5,a7)
else
    disp('your value not in the standard table temparature range')

  end
 %% printing molicular weight values
 %function to calculate molicular weight by taking species name as input
 w=molicular_weight(st2);
 fprintf('molicular weight of %s =%f',st2,w) %displays molicular weight with species name
 fprintf('\n')  %for new line

 break  %after executing if command this will break the loop from the remaining iterations

 end
end
references
https://en.wikipedia.org/wiki/Enthalpy#Definition
https://skill-lync.com/student-projects/File-Parsing-and-Data-analysis-in-MATLAB-78312