Project 1 - Parsing NASA thermodynamic data
Aim:-
Write a code in MATLAB for parse NASA thermodynamic data and calculate the various thermodynamic properties of each species.
Govering Equation :-

Here Cp=Specific Heat
R=Universal Gas Constant
T=Given Local Temperature
H=Enthalpy
S=Entropy
Here From the given NASA thermodynamic data file where First 7 coeffficient temperature is higher temperature coefficient and second 7 coefficient is taken for lower temperature coefficient.
Objective :-
- Write a function that extracts the 14 co-efficients and calculates the enthalpy, entropy and specific heats for all the species from the data file that is 'THERMO.dat'.
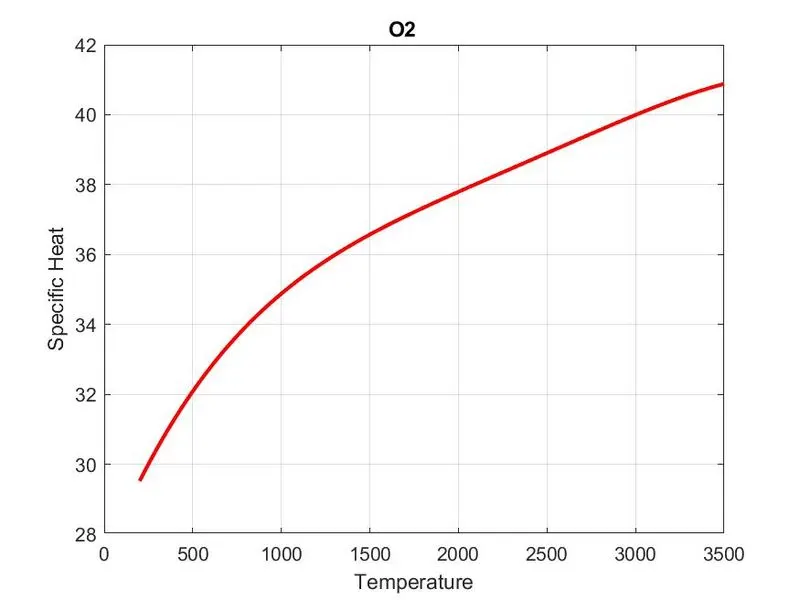
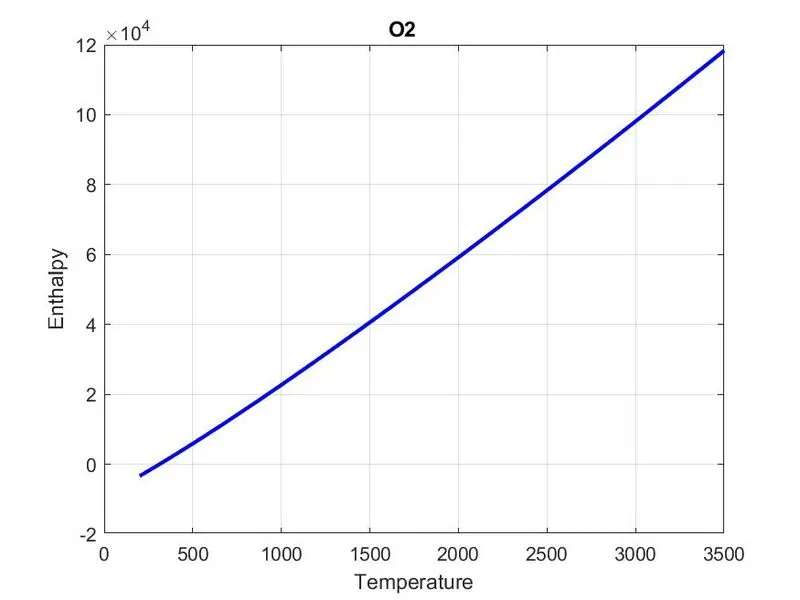
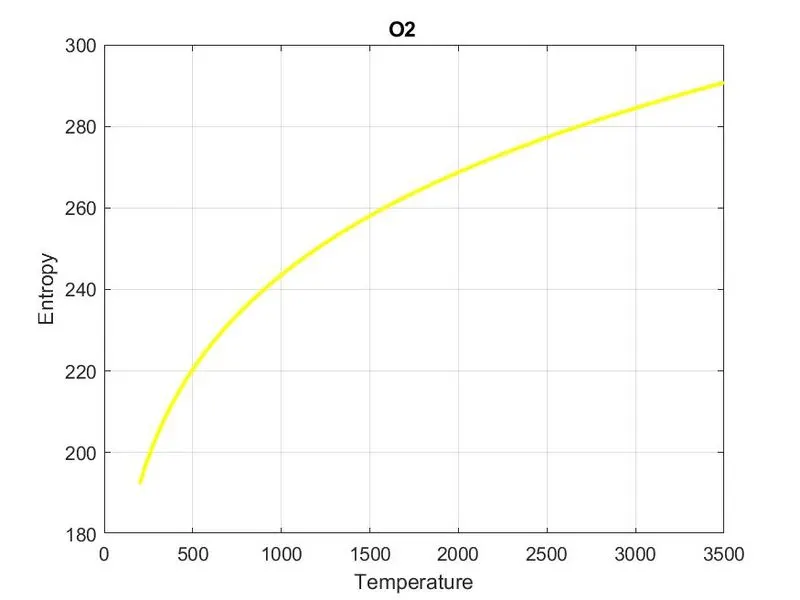
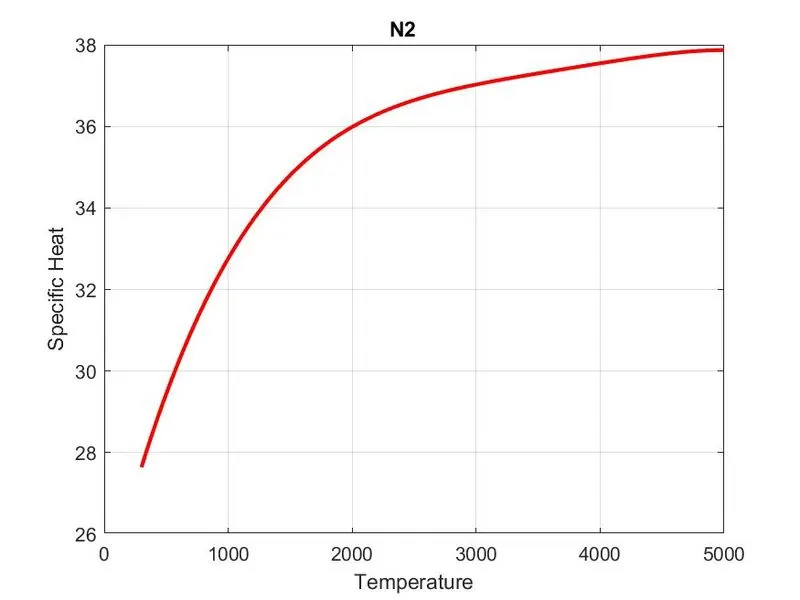
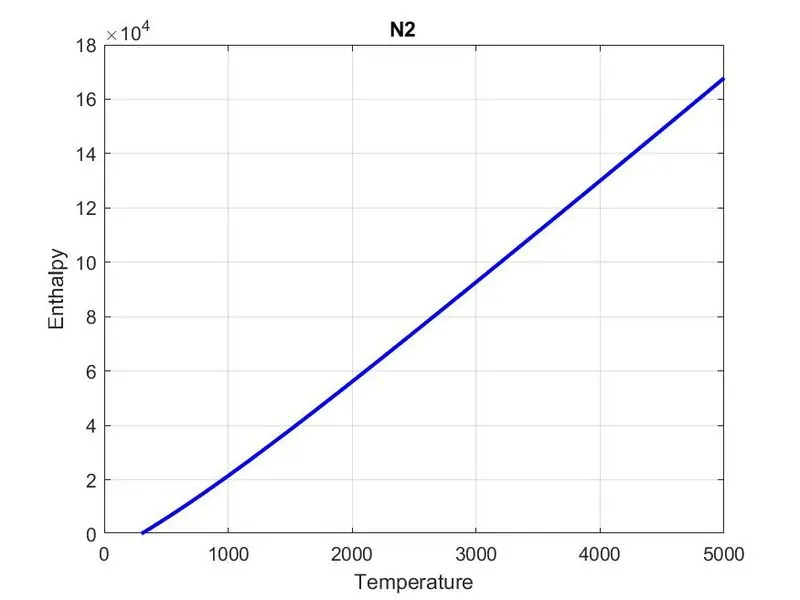
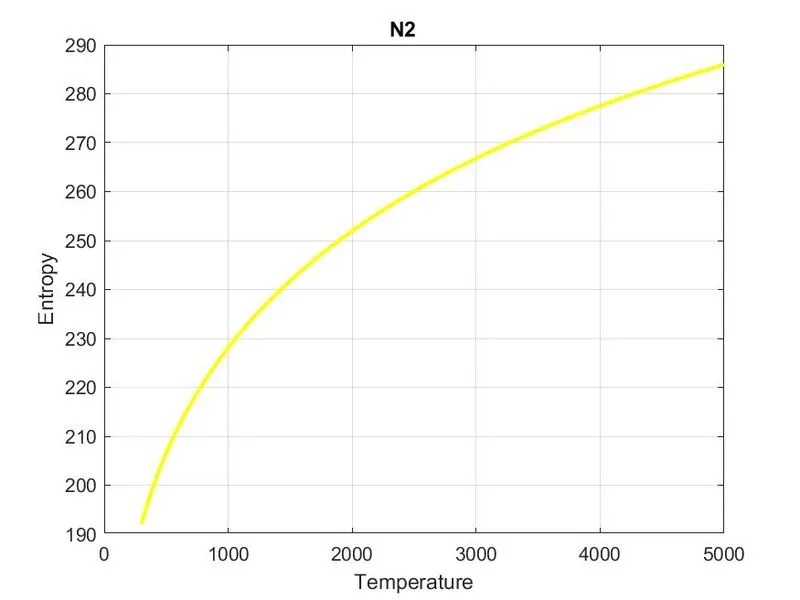
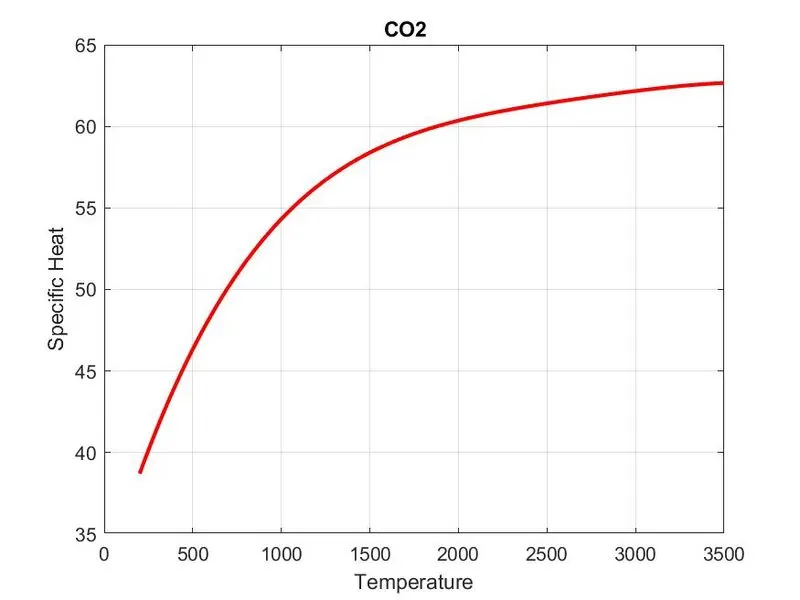
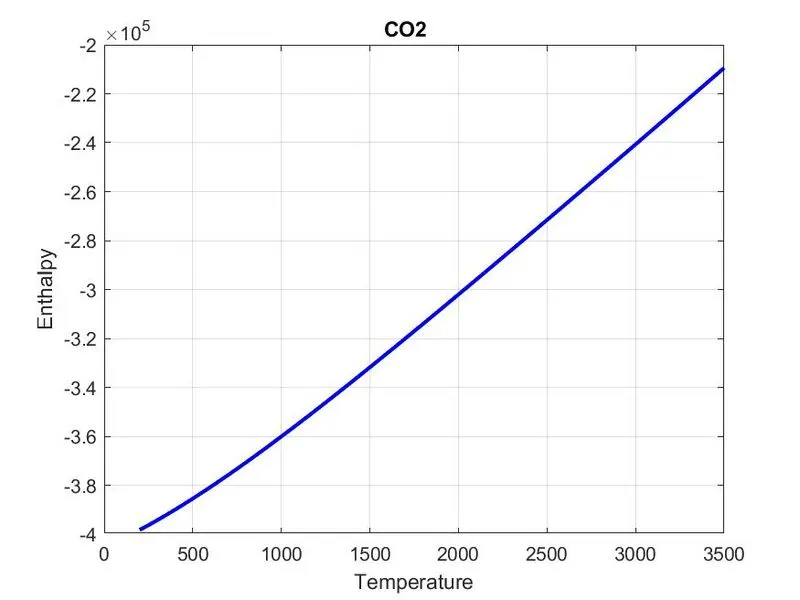
- plot the graph of Specific Heat , Enthalpy, Entropy for all the species with respect to given local temperature and save the plot as a jpg file in a different directory.
- And also calculate the molecular weight for the given each species.
Theory :-
File parsing :-
- The process of "parsing" can be described as reading in a data stream of some sort and building an in-memory model or representation of the semantic content of that data, in order to facilitate performing some kind of transformation on the data.
- Here file parsing referrs to the parse data from a NASA thermodynamic data file and use the data to calculate the various thermodynamic properties.
Specific Heat(Cp) :-
- specific heat is defined as the amount of heat is required to raise the temperature of a unit substance by a unit temperature .
- The unit of specific heat is KJ/kg-K or KJ/Kmol-K .
Enthalpy(H):-
- Enthalpy is a thermodynamic property of a system. It is the sum of the internal energy added to the product of the pressure and volume of the system.
- Enthalpy is denoted as H.
- Enthalpy Si unit is KJ or J.
Entropy(S):-
- Entropy is defined as the measurement of degree of randomness or in other words, it is the increase in the disorganization within a system.
- Entropy is denoted by S.
- Entropy unit is Joule/Kelvin.
Function code for calculate Specific Heat , Enthalpy, Entropy :-
function [Cp,H,S] = inputs(T,R,Tm1,c1,c2,c3,c4,c5,c6,c7,c8,c9,c10,c11,c12,c13,c14)
for i=1:length(T)
    if T(i)>Tm1
Cp= (c1 + c2.*T + c3.*T.^2 + c4.*T.^3 +c5.*T.^4).*R;
H = (c1 + (c2.*T)./2 + (c3.*T.^2)./3 + (c4.*T.^3)./4 +(c5.*T.^4)./5 + c6./T).*T.*R;
S = (c1.*log(T) + c2.*T + (c3.*T.^2)./2 + (c4.*T.^3)./3 +(c5.*T.^4)./4 + c7).*R;
else
Cp = (c8 + c9.*T + c10.*T.^2 + c11.*T.^3 +c12.*T.^4).*R;
H = (c8 + (c9.*T)./2 + (c10.*T.^2)./3 + (c11.*T.^3)./4 +(c12.*T.^4)./5 + c13./T).*T*R;
S = (c8.*log(T) + c9.*T + (c10.*T.^2)./2 + (c11.*T.^3)./3 +(c12.*T.^4)./4 + c14).*R;
 end
end
end- The above polynomial Function is written for caling the function for execute the specific heat , Enthalpy and Entropy from the given NASA thermodynamic Data.
- we take R as universal gas constant that is 8.314 kj/kg-k.
- we took local temperature value according to the species.
- From the NASA therodynamic data file , the first 7 coefficient are used for higher temperature coefficient and second 7 coefficient are used for lower temperature coefficient.
Code for Calculate molecular weight :-
 function [molecular_wt] = mw(sp_name)
elements = ['H','C','N','O','A'];
atomic_wt = [1,12,14,16,40];
molecular_wt = 0;
for i = 1:length(sp_name)
 for j = 1:length(elements)
 if strcmpi(sp_name(i),elements(j))
 molecular_wt = molecular_wt + atomic_wt(j);
 position = j;
 end
 end
 f = str2double(sp_name(i));
 if f>1
 molecular_wt = molecular_wt+atomic_wt(position)*(f-1);
 end
end
 sprintf('The molecular weight of %s is %d',sp_name,molecular_wt)
end
- The above function code is used to caculate Molecular weight of given species.
- we take some common element in the elements array for comapring with the species.
- And also take the atomic weight of the given common element.
- Here 'strcmpi' command is used for comapre the two strings these are species name and given common element so that we can put out the atomic weight of the given common element.
- Initialy we take atomic weight value is 0.
- some species have number string like (c2h2 , h2o, n2o) in this case first we convert the integer string(2) into a real number by using of 'str2double' command.
- Then we put it in a logical calculation for evaluate the atomic weight.
Main command :-
clear all
close all
clc

%open the data from provided file
f1=fopen('THERMO.dat','r');
fgetl(f1);
tline=fgetl(f1);
A=strsplit(tline,' ');
%taking global temperature
global_low_temp=(A{2});
global_mid_temp=(A{3});
global_high_temp=(A{4});

%excluding three comment line
for i=3:5
    b=fgets(f1);
end
%taking temperature and coefficient for each species
for j=1:53
    species=fgetl(f1);
    t=findstr(species,'.');
    %local temperature for all species
    Tl=species(t(1)-3:t(1)+3);
    Tl1=str2num(Tl);
    Th=species(t(1)+6:t(2)+3);
    Th1=str2num(Th);
    Tm=species(t(2)+6:t(3)+3);
    Tm1=str2num(Tm);
    sp_name=species(1:6);
    %coefficient of each species
    coeff_line1=fgetl(f1);
    A11=findstr(coeff_line1,'E');
    a1=coeff_line1(1:A11(1)+3);
    c1=str2num(a1);
    a2=coeff_line1(A11(1)+4:A11(2)+3);
    c2=str2num(a2);
    a3=coeff_line1(A11(2)+4:A11(3)+3);
    c3=str2num(a3);
    a4=coeff_line1(A11(3)+4:A11(4)+3);
    c4=str2num(a4);
    a5=coeff_line1(A11(4)+4:A11(5)+3);
    c5=str2num(a5);
    coeff_line2=fgetl(f1);
    A22=findstr(coeff_line2,'E');
    a6=coeff_line2(1:A22(1)+3);
    c6=str2num(a6);
    a7=coeff_line2(A22(1)+4:A22(2)+3);
    c7=str2num(a7);
    a8=coeff_line2(A22(2)+4:A22(3)+3);
    c8=str2num(a8);
    a9=coeff_line2(A22(3)+4:A22(4)+3);
    c9=str2num(a9);
    a10=coeff_line2(A22(4)+4:A22(5)+3);
    c10=str2num(a10);
    coeff_line3=fgetl(f1);
    A33=findstr(coeff_line3,'E');
    a11=coeff_line3(1:A33(1)+3);
    c11=str2num(a11);
    a12=coeff_line3(A33(1)+4:A33(2)+3);
    c12=str2num(a12);
    a13=coeff_line3(A33(2)+4:A33(3)+3);
    c13=str2num(a13);
    a14=coeff_line3(A33(3)+4:A33(4)+3);
    c14=str2num(a14);
    %make a directory for save the plot
    mkdir(['C:\Users\91700\Ashish\file parsing\pictures\',sp_name]);
    %get the value of specific heat,enthalpy,entropy
    T=linspace(Tl1,Th1,100);
    R=8.314;
    [Cp,H,S]=inputs(T,R,Tm1,c1,c2,c3,c4,c5,c6,c7,c8,c9,c10,c11,c12,c13,c14);

   % Plotting
figure(1)
plot(T,Cp,'linewidth',2,'color','r')
grid on
title(sp_name)
xlabel('Temperature')
ylabel('Specific Heat')
figure(2)
plot(T,H,'linewidth',2,'color','b')
grid on
title(sp_name)
xlabel('Temperature')
ylabel('Enthalpy')
figure(3)
plot(T,S,'linewidth',2,'color','y')
grid on
title(sp_name)
xlabel('Temperature')
ylabel('Entropy')
saving = (['C:\Users\91700\Ashish\file parsing\pictures\',sp_name]);
cd(saving)
saveas(1,'Specific Heat','jpg');
saveas(2,'Enthalpy','jpg');
saveas(3,'Entropy','jpg');

cd(['C:\Users\91700'])
% calculate molecular weight
[molecular_wt]=mw(sp_name)
end
Explanation of code :-
- First we put the clear all command for delete the previous variables which is created in the workspace.
- 'THERMO.dat' file is the given NASA thermodynamic data file through which we evaluate the specific Heat ,Enthalpy, and Entropy.
- we use "fopen" command for read the given THERMO file and every line is read by using 'fgetl' command.
- inorder to get the header information we used 'strsplit' command for get the global temperature value.
- Then we removed three lines of the given data file by using a 'for loop' becasue these lines are irrelevent.
- Now we read the species data, since there are 53 species and using same 'for loop' logic for all the 53 species and the main command is written inside the For loop.
- species first line represent the species name and local temperature of the species.
- A 'strsplit' command is used for get the species name and local temperature of the species.
- Next three lines represent the coefficient of the current species.
- Inorder to get the coefficient value we used 'findstr' command to get the variable E this will be used as reference for get the coefficient value.
- 'mkdir' command is used to create a new directory for save the plot graph of each species.
- For plotting we need a set of local species temperature so we splited it into 100 points by using of linspace command.
- To assign High or Low temperature coefficient each and every temperature is compared with local mid temperature.
- By using of 'input function' which is mentioned in above we calculate the value of Specifi Heat, Enthalpy, Entropy and plotting is carried out.
- For saving the plots 'cd' command is used.
- To find the molecular mass for each and every element atomic weight is assigned now by using the 'strcmpi' command each species elements are compared and molecular mass is stored using two 'for loops', one to evalute the species element and one to compare the elements.
- In some species like HNO3 the element's atomic weight to be added twice (or) thrice, hence flag operator is used to get the position and that element atomic weight is added to the molecular weight by using the 'if' condition.
This is the directory where the species images are saved :-

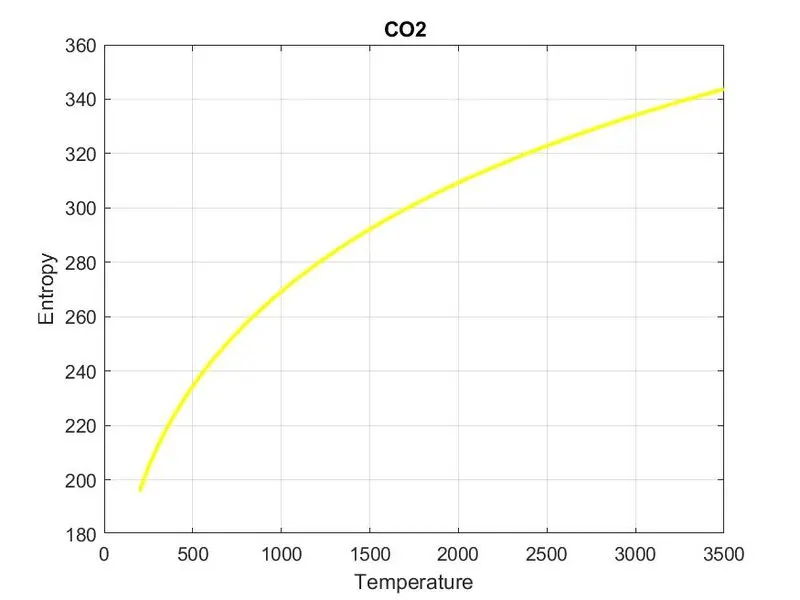
Plot of o2 , n2 and co2 :-
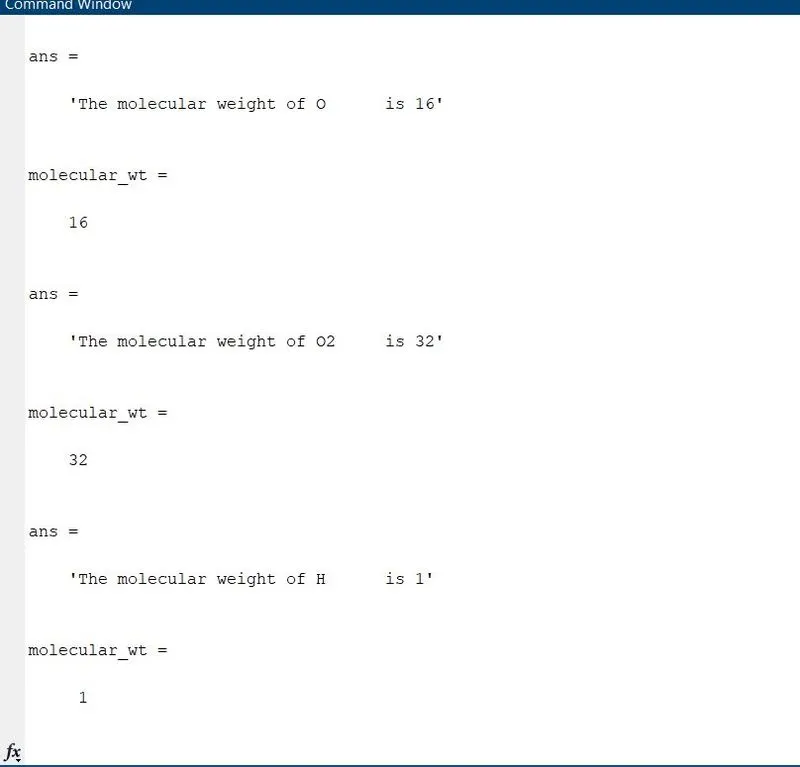
This is the molecular weight in command window :-
Reference :-
- Mathworks.com