Project 1 - Parsing NASA thermodynamic data
Objective:
Write a function to parse NASA’s thermodynamic data file & calculates the enthalpy, entropy & specific heats for all the species in the data file.
Definition of Parsing:
Parsing is the process of analyzing a string of symbols, either in natural language, computer languages or data structures, conforming to the rules of a formal grammar. Within computational linguistics the term is used to refer to the formal analysis by a computer of a sentence or other string of words into its constituents, resulting in a parse tree showing their syntactic relation to each other, which may also contain semantic and other information.
Thermodynamic equations for Specific heat, Enthalpy, Entropy:

Where,
a1 to a14= coefficients from NASA thermodynamic data file.
Cp=Specific heat in J/mol.K
R= Universal gas constant, R=8.314 in J/mol.K
H= Enthalpy in J/mol
S=Entropy in J/mol.K
T= Temperature in Kelvin
Matlab code for defining the thermodynamic properties:
% Calculating thermodynamic properties(Cp, h, s)

function[cp,h,s]=thermodynamic_properties(a1,a2,a3,a4,a5,a6,a7,a8,a9,a10,a11,a12,a13,a14,T)
R=8.314; % R= universal gas constant
for j=1:length(T) % Running a for loop for each value of temperature
    if T(j)<300 % When T(j) is lesser than 300

        cp=(a1+a2.*T+a3.*T.^2+a4.*T.^3+a5.*T.^4).*R;
        h=(a1+(a2.*T)./2+(a3.*T.^2)./3+(a4.*T.^3)./4+(a5.*T.^4)./5+(a6./T)).*R.*T;
        s=(a1.*log(T)+a2.*T+(a3.*T.^2)./2+(a4.*T.^3)./3+(a5.*T.^4)./4+a7).*R;

    else
         cp=(a8+a9.*T+a10.*T.^2+a11.*T.^3+a12.*T.^4).*R;
        h=(a8+(a9.*T)./2+(a10.*T.^2)./3+(a11.*T.^3)./4+(a12.*T.^4)./5+(a13./T)).*R.*T;
        s=(a8.*log(T)+a9.*T+(a10.*T.^2)./2+(a11.*T.^3)./3+(a12.*T.^4)./4+a14).*R;
    end % Ending the 'if' statement
end % Ending the for loop
end % Ending the function
Matlab code for the all-species molecular weights:
% Calculating the molecular weight of species from 'THERMO.dat' file

function [mw]=mole_weight(species_name)

% Creating a character array for all elements
elements={'H','C','N','O','A'};

% Creating an array for storing all the weights of all elements
atom_weight=[1 12 14 16 40];

% Give initial value for molecular weight
molecular_weight=0;

for i = 1:length(species_name) % Running a for loop for each character of species
    for j=1:length(elements)  % Running a for loop for each part of elements
        if strcmp(species_name(i),elements(j))% Comparing the 'i'th character of species with 'j'th character of elements array
            molecular_weight=molecular_weight+atom_weight(j);% Calculating the molecular weight by summation
            u=j; % Assigning the 'j' value in 'u'variable
        end % Ending the if statement
    end % Ending the second for loop

    % Calculating the molecular weight, when there is more than one atom is
    % present in same type

    n=str2double(species_name(i)); % Converting 'i'th character of species to precision values(number)
    if (n > 1)
        molecular_weight=molecular_weight+atom_weight(u)*(n-1);% Calculating the molecular weight by summation
    end % Ending the 'if' statement
    mw=molecular_weight;% Assigning the 'molecular_weight' value in 'mw'variable
end % Ending the 1st for loop
% Printing the molecular weight of each species
fprintf('molecular weight of %s:-',species_name)
fprintf('%d',mw)
fprintf('')
fprintf('amu')
fprintf('\n')
end % Ending the function
Matlab code for the main program:
clear all
close all
clc

% Reading 'THERMO.dat' file

f1=fopen('THERMO.dat','r');
filename=fgetl(f1);

% Assigning the global temperature values
t_line=fgetl(f1);

A=strsplit(t_line);

% Defining the temperature extracted from THERMO.dat' file

global_low_temp=str2double(A{2});% Assigning the global low temperature from array
global_mid_temp=str2double(A{3});% Assigning the global mid temperature from array
global_high_temp=str2double(A{4});% Assigning the global high temperature from array

fgetl(f1)
fgetl(f1)
fgetl(f1)

%Species Information

% No. of. Species=53

for i=1:53 % Running a for loop for every molecule

    % Extracting species name
    line1=fgetl(f1);% Assigning the heading to line1.
    species_name=line1(1:6);% Assigning the molecule data's 1st line from the data file to species

    local_temp1=line1(49:55);
    low_temp=str2double(local_temp1);

    local_temp2=line1(58:65);
    high_temp=str2double(local_temp2);

    local_temp3=line1(68:75);
    mid_temp=str2double(local_temp3);

    % Extracting the co efficient
    line2=fgetl(f1);
    line3=fgetl(f1);
    line4=fgetl(f1);
    l1=strfind(line2,'E');
    l2=strfind(line3,'E');
    l3=strfind(line4,'E');

    % Extracting the high temperature coefficients

    a1=str2double(line1(1:(l1(1)+3)));
    a2=str2double(line1((l1(1)+4):(l1(2)+3)));
    a3=str2double(line1((l1(2)+4):(l1(3)+3)));
    a4=str2double(line1((l1(3)+4):(l1(4)+3)));
    a5=str2double(line1((l1(4)+4):(l1(5)+3)));

     % Extracting the high temperature coefficients

    a6=str2double(line2(1:l2(1)+3));
    a7=str2double(line2(l2(1)+4:l2(2)+3));

    % Extracting the low temperature coefficients

    a8=str2double(line2(l2(2)+4:l2(3)+3));
    a9=str2double(line2(l2(3)+4:l2(4)+3));
    a10=str2double(line2(l2(4)+4:l2(5)+3));


    % Extracting the low temperature coefficients

    a11=str2double(line3(1:l3(1)+3));
    a12=str2double(line3(l3(1)+4:l3(2)+3));
    a13=str2double(line3(l3(2)+4:l3(3)+3));
    a14=str2double(line3(l3(3)+4:l3(4)+3));


    % Assum temperature ranges for calculation purpose
    T=linspace(low_temp,high_temp,500);

    % thermodynamic properties function
   [cp,h,s]=thermodynamic_properties(a1,a2,a3,a4,a5,a6,a7,a8,a9,a10,a11,a12,a13,a14,T);

   % For creation of a folder  save the plots
   data=strcat('Properties of...',species_name);
   mkdir(data);
   file=pwd;


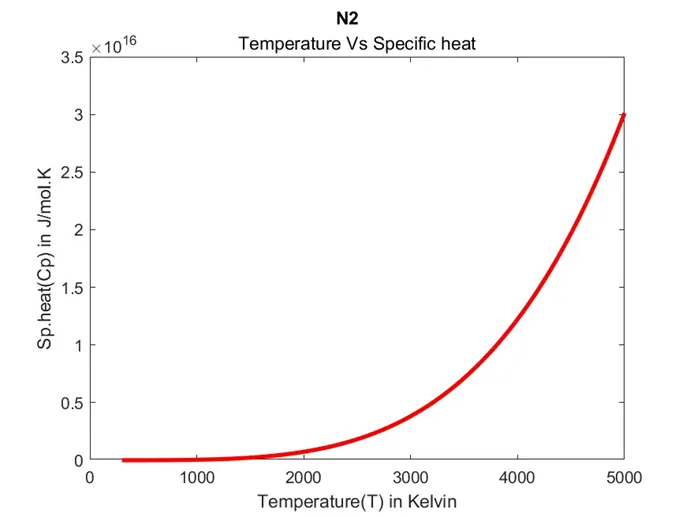
   % Plot b/w Temperature Vs Sp.Heat
   figure(1)
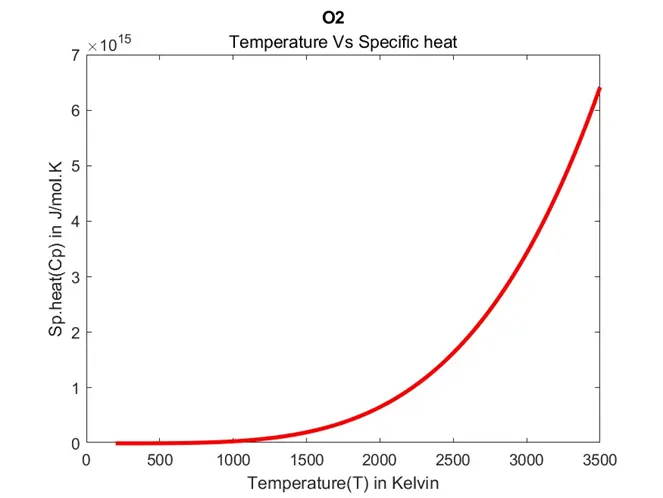
   plot(T,cp,'linewidth',2.5,'color','r')
   title(species_name,'Temperature Vs Specific heat')
   xlabel('Temperature(T) in Kelvin')
   ylabel('Sp.heat(Cp) in J/mol.K')
   f=fullfile(data);
   cd(f)
   saveas(1,'Specific heat.jpg')
   cd(file)


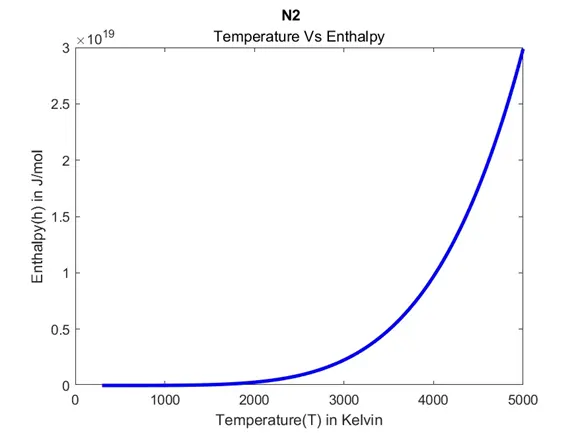
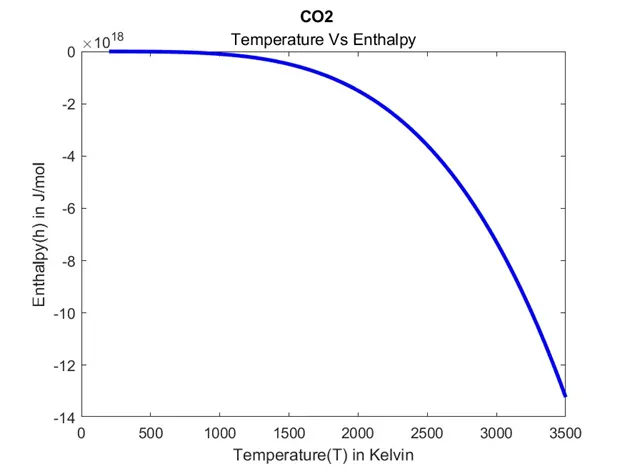
    % Plot b/w Temperature Vs Enthalpy
   figure(2)
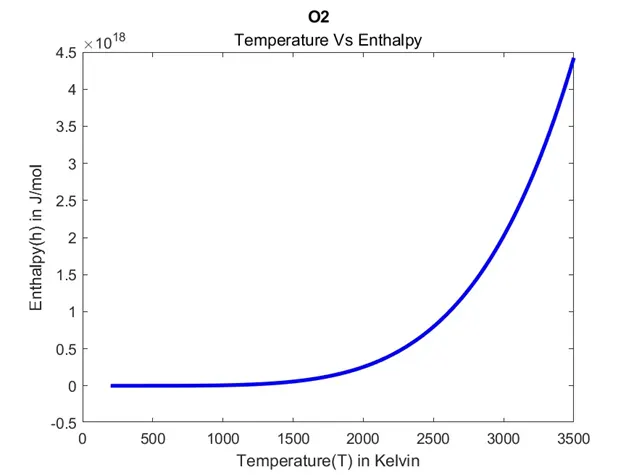
   plot(T,h,'linewidth',2.5,'color','b')
   title(species_name,'Temperature Vs Enthalpy')
   xlabel('Temperature(T) in Kelvin')
   ylabel('Enthalpy(h) in J/mol')
   cd(f);
   saveas(2,'enthalpy.jpg')
   cd(file)

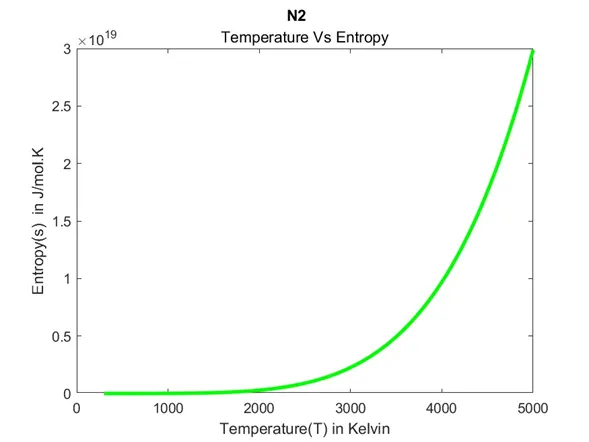
    % Plot b/w Temperature Vs Entropy
   figure(3)
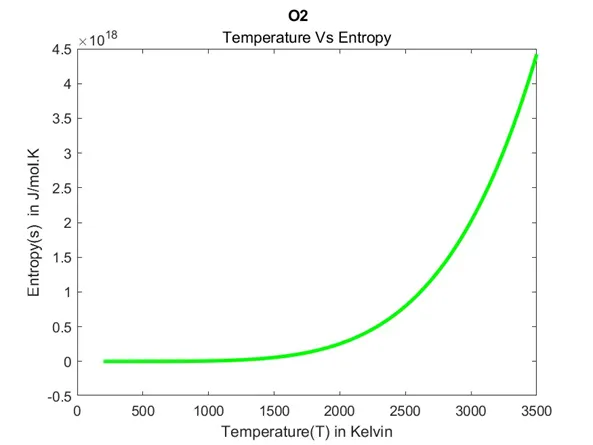
   plot(T,h,'linewidth',2.5,'color','g')
   title(species_name,'Temperature Vs Entropy')
   xlabel('Temperature(T) in Kelvin')
   ylabel('Entropy(s)  in J/mol.K')
   cd(f)
   saveas(3,'entropy.jpg')
   cd(file)


   mw=mole_weight(species_name);

   k=sprintf('%s molecular_weight = %f',species_name,mw);
   disp(k)
end
fclose(f1); % closing the file
Step wise procedure:
Step-1:
Click Windows Startà Search ‘Matlab’ application. Once it appears on the window screen & Clicks the ‘Matlab” icon.
Then Matlab application will be opened. Now open the editor column & save the file name as ‘main_program.
Add another tab in the editor window & save another file as ‘mole_weight’ for calculating the molecular weight of species from ‘THRMO.dat’ file.
Step-2:
Enter ‘clear all, close all, ctc commands.
The usages of the commands are shown below.
‘clear all’ command is used to clear all the data stored in the workspace.
‘close all’ command is used to cleart all graphs & plots.
‘clc’ is used to clear the command window.
Step-3:
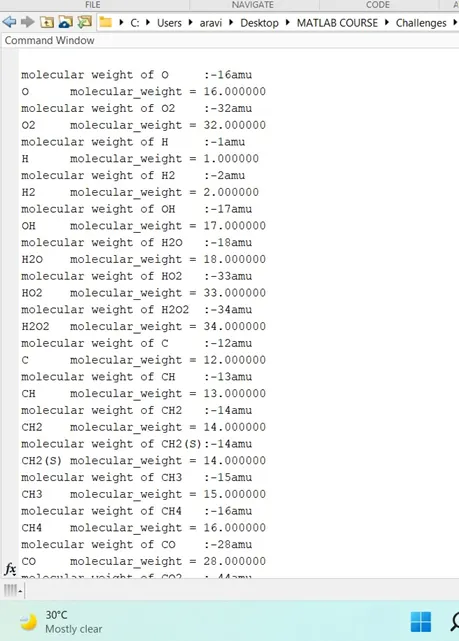
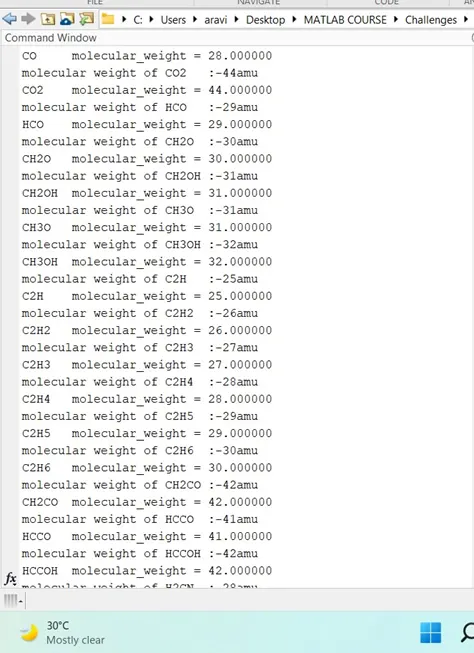
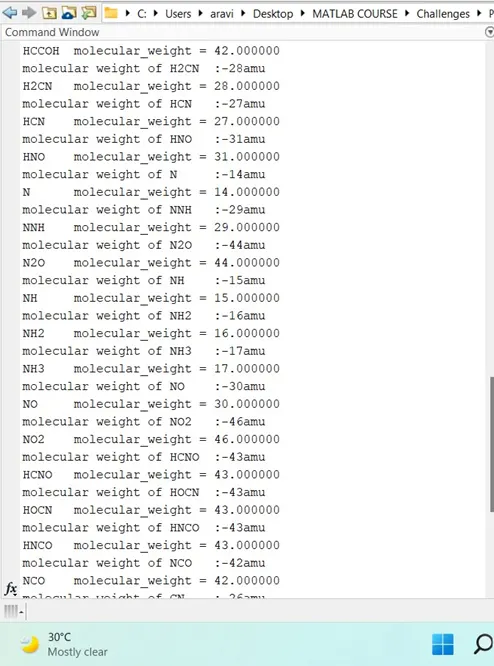
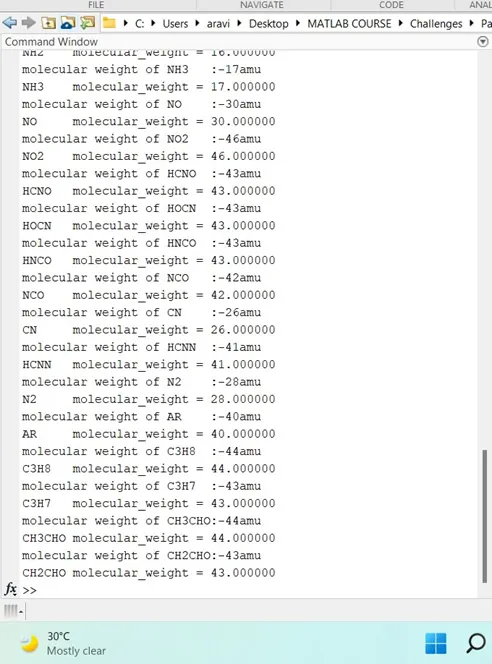
Assign the below values to calculate the molecular weight of species from data file from molecular weight function.
Result: Molecular weights of each species are displayed below.
Step-4:
Assign the below values to calculate specific heat (Cp), enthalpy(h) & entropy(s) from the data file.
Step-5:
- ‘THERMO.dat’ file is opened & read thru fopen('THERMO.dat','r') command.
- Then read the headings, global temperature and next three lines.
- Run a for loop for every species to get species name, local temperatures, 14 coefficients.
- And then calculate the Specific heat, enthalpy & entropy by using the given equations for 2 temperature range.
- Plot the various graphs (T-s, T-Cp, T-h) for species & save in folder.
- Close the file.
Result:
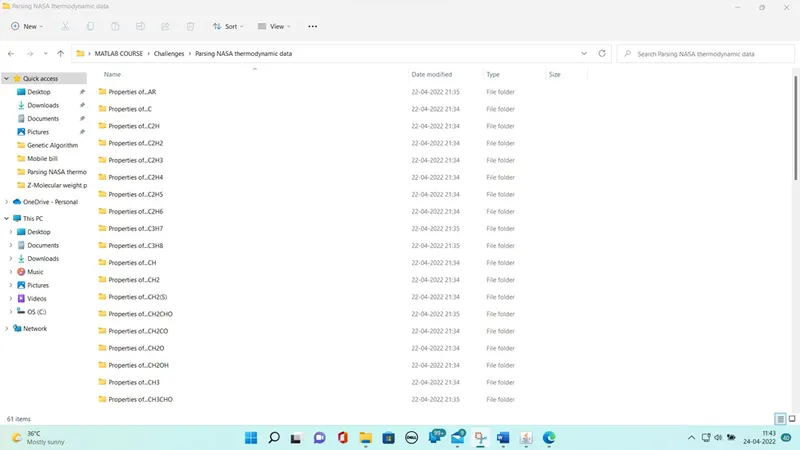
Screenshot of various plots save in folder.
O2 Graphs:
N2 Graphs:
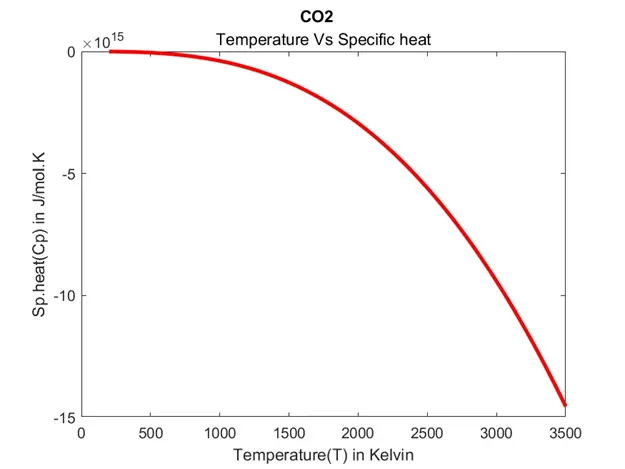
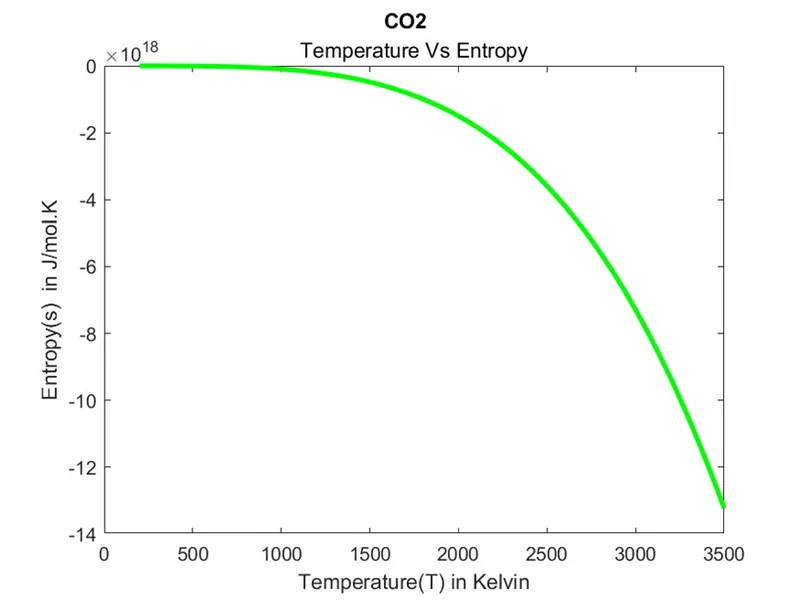
CO2 Graph:
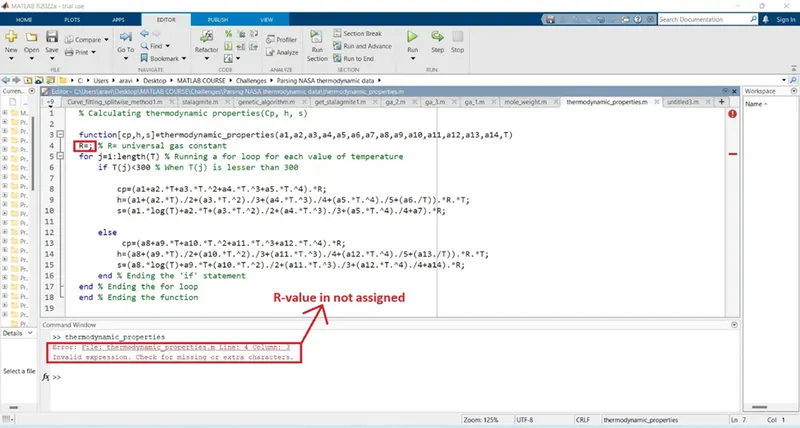
Error faced while programing:
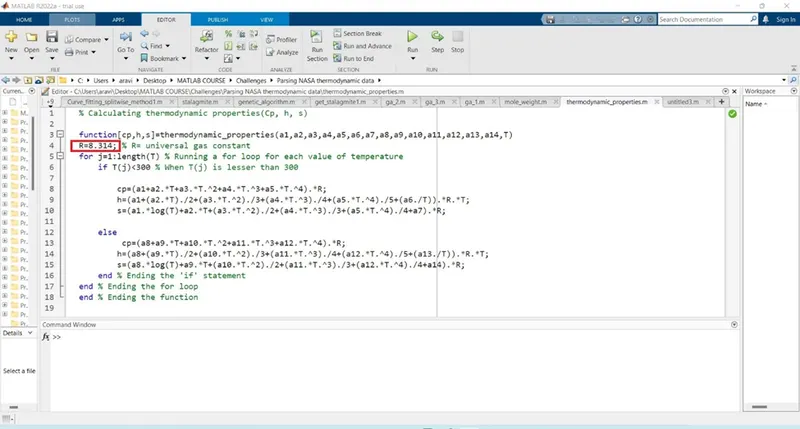
Step taken to correct the error:
R (Universal gas constant) value 8.134 assigned.
Reference Materials:
- https://en.wikipedia.org/wiki/Parsing
- https://in.mathworks.com/help/matlab/matlab_prog/parse-function-inputs.html#:~:text=%20Parse%20Function%20Inputs%20%201%20Step%201.,Input%20Parser%20makes%20assumptions%20about%20case...%20More%20
- https://in.mathworks.com/matlabcentral/answers/453086-parsing-text-file-with-matlab