Project 1 - Design and Develop a IOT based Wireless Wearable Health Monitoring System or a Home Healthcare System to monitor the physiological parameters of ECG, Heart Rate, Pulse Oximetry, Cuffless Blood Pressure and Body Temperature.
IoT-Based Wearable smart health Parameters Monitoring System:
IoT-Based Physiological Parameters Monitoring System measures the health parameters such as body temperature, ECG signal, heart rate, cuffless blood pressure, and SPO2.
The system consists of several Internet of Things (IoT)-based sensors connected to an Arduino microprocessor, which thus measures the vital body signs of the patients. The measured readings are then transmitted to an Android application on a smartphone via a Bluetooth module. The sensors are connected to analog inputs. These sensors measure analog data, which is amplified by the microprocessor after being sorted. Doctors can also carry out the diagnosis of ailments using the data collected remotely from the patient. An Android-based mobile application that interfaces with a web-based application are implemented for efficient patients-doctors dual real-time communication. The Android application, which is connected to a MySQL database, updates the said database, which updates and displays the readings on a website accessible by both doctors and patients.
Block diagram of proposed android UI implementation
The microcontroller is at the center of the entire hardware process. It receives analog signals from the sensors, and then, the Arduino code is written such that the data are sorted from each sensor and then digitized. The sorted data are then passed on to a Bluetooth module which transmits the data to the mobile android application. The android application displays the readings and simultaneously updates the MySQL database connected to the website. From the website, patients and doctors should be able to access the information simultaneously.
Flow diagram of proposed patient UI implementation
When patients open the application, they should be prompted to register and open a new account with their personal details, which will be passed on to the database. The application system will always check the database for these login details to allow patients for future logins. Once logged in, patients should be able to do the following: They should be able to view their past readings to compare, they should be able to take new measurements, or they should be able to check their doctor’s prescription that was given since the last time they took readings. After the patient logs in, patients can choose between two options. One alternative is to upgrade the data of patients by giving data approximately title, age, crisis email, and ID, which is really the device ID, and, of course, the interesting id for each persistent.
Specialists would be able to view all of the patient's records after clicking on a single patient. He’ll still be able to see if some form of signal or warning is sent to specialists. Specialists may recommend specialists based on their findings. There is an option called “delete permanent records.” It means, that if a specialist needs it, he can erase a few past records of a persistent person.
The probable flow of server implementation is shown below. The Bluetooth module can be utilized as equipment, and it’ll be set up with Arduino so that it can exchange information over the Internet. A computer interface can handle questions utilizing http, the most well-known convention for trading information on the World Wide Web. The information will be put away, handled, and sent to clients. A Bluetooth module will be utilized to exchange information with the app, and a web server will be utilized to store data. The Android interface was selected for the smartphone gadget. Android encompasses a world-class stage for creating apps and diversions for Android clients all over the world, as well as a free commerce center for disseminating them right away
Block diagram of the proposed server implementation
Block diagram for the entire health monitoring process
DESIGN AND IMPLEMENTATION:
Heart rate sensor
The heart pulse rate sensor (MAX30102) is a non-invasive optical device used for achieving two main functions, detecting the heartbeats and peripheral capillary oxygen saturation (Spo2). There are two non-invasive methods for calculating the heart rate and Spo2 values, transmitted mode and reflected mode
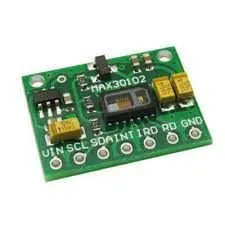
Max30102 sensor Non-invasive spo2 measurement
For measuring the reflected light, this sensor utilizes two types of light, red and infrared. Red light
has a wavelength of 650 nm and infrared light has a wavelength of 950 nm. Oxygen-saturated
hemoglobin (oxygenated blood) and non-oxygen-saturated hemoglobin (deoxygenated blood) absorb
different amounts of each light. So, the reflected light will be received by the sensor and through an
algorithm, the final value for the Spo2 will be deducted.
For calculating the heart beats per minute another approach is used. The blood needs high pressure to
be pumped out of the heart to other body members. It occurs with the heartbeat and it causes the arteries to
feel an amount of strain (blood pressure) when the blood flows in them. Arteries are responsible for
carrying the blood out of the heart. So, the blood pressure leads to swelling and contracting of arteries,
therefore the volume of the artery in the body parts (fingertip in this project) increases and reduces. When
the volume increases, there will be more hemoglobin in the section area and consequently, the amount of
absorbed infrared light will rise and the reflected signal back to the heart rate sensor will be reduced.
These variations in the reflected light will result in a fluctuated signal called a photo plethysmogram (PPG).
a flowchart describing the process of calculating the heart rate beats per minute is given below. For achieving this task, the PPG wave is filtered by a low pass filter, so we can obtain noise-reduced waves to measure the heart pulse rate. Then the maximum and minimum peaks of these waves are detected. By checking their peaks, the validity of an actual heart pulse is determined. In order to measure the interval between pulses, at least two consecutive heart pulses must be correctly detected. Then the last twelve intervals will be stored in an array and the median of these intervals is calculated. In this project instead of calculating the average, the median calculation is used, because the median function will result in a more accurate final value if there are some anomalies in the results. Then the median value is converted to the heartbeats per minute (BPM) and the Spo2 value is sent to the Blynk cloud server.
Flowchart of the heart pulse and Spo2 sensor
ECG Sensor
The electrocardiogram (ECG signal) represents the electrical potential of the human heart. This signal is
started from a specific spot which is called the “S-A node (sinoatrial node)” which is located on the upper left
side of the atrium. Then, the signal reaches to “A-V node (atrioventricular node)” which is located in the
middle of the heart approximately. Next, the electricity goes “bundle of His”. The ECG signal consists of
P: atrial depolarization, QRS complex: ventricular depolarization and atrial repolarization, and T:
ventricular repolarization. The ECG amplitude is in the microvolts range and its frequency is within the 0.01 HZ to 100 HZ range.
Therefore, to display it, a bandpass filter and an amplifier should be applied to the signal. The bandpass
filter range is 0.5 HZ – 40 HZ [16].w The most important things to diagnose via ECG signal are the
intervals between the pulses, the shape of each pulse. The normal intervals are: R-R interval (0.6 - 1.2)
seconds, P-R interval (0.12 – 0.2) seconds, QRS complex (0.08 - 0.12) seconds, Q-T interval (0.35 – 0.45)
seconds.
“Single-Lead ECG sensor AD8232” which is an analog sensor with 3.3V operating volt manufactured by Sparkfun company. It includes three electrodes(RA, LA, and RL) which can be placed under clothes confidentially (figure 10) RA (Right Arm), LA (left arm), and RL (Right Leg). This sensor includes two analog filters, the first one is a high pass filter with an off frequency of 0.48Hz and the second one is a low pass filter with a cutoff frequency of 40Hz to achieve the required bandpass filter. Sensors’ pins are 3.3V, GND, Output, LO-, LO+, and SDN. The output pin gives the ECG signal. LO- and LO+ pins are connected to the microcontroller to inform it if one of the three electrodes loses its connection to the patient’s chest and they send a HIGH signal to the microcontroller if the disconnection occurs. Therefore, the microcontroller can send a warning message automatically based on that. Finally, the SDN pin is used to shut down the sensor to save the battery. It is an active low pin and the microcontroller can shut down the sensor automatically. The main issue with this sensor which is very sensitive to motion. So, it requires a rest position to read perfectly
AD8232 single-lead ECG sensor ECG electrodes suitable positions
The ECG code partition is executed firstly by checking the electrode attachment case. Then, the
microcontroller reads the analog input signal and performs a smoothing process on the signal. After that,
the samples were buffered in an array before sending them periodically to the Blynk cloud server.
Flowchart of the ECG sensor
Body Temperature Sensor
Maintaining the body temperature is essential to having a health condition because catalyzing the chemical
reactions is the responsibility of enzymes in body cells and these enzymes must have the appropriate
temperature to be capable to do this task. High body temperature can result in heat stroke, dehydration,
and death if it is not treated. Also, low body temperature can lead to hypothermia and death if it is not
dealt with.
Therefore, obtaining instantaneous information about body temperature helps to avoid the mentioned
problems. LM35 analog temperature sensor (figure 13) is used to measure body
temperature. This sensor is able to read temperatures from −55˚ to +150˚C and has a 0.5˚C tolerance.
This sensor is put under the body arm (axilla) and is connected to the analog input of the Arduino UNO as
The Arduino imports the analog data from the sensor to its analog pin and it converts the data to
a digital value using an internal analog to digital (A/D). Then the digital value is converted to a Celsius
temperature. Afterward, this temperature is transmitted to the NodeMCU to be sent to the Blynk Cloud
Server using an ESP8266 WI-FI chip included in the NodeMCU module.
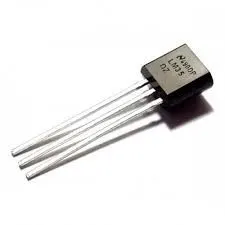 LM35 sensor (body temperature)
Communication between Arduino UNO and NodeMCU
For sending the data to the Blynk cloud server, a chip with Wi-Fi technology is required. Therefore, in this
paper, a NodeMCU module is chosen for satisfying this purpose. Nonetheless, some problems cannot be
solved by using this chip alone. The first challenge is that the NodeMCU has only one analog input and in
this project more than just one is required. The second issue is some libraries are just dedicated to just
some specified microcontrollers not all of them. Thus, Arduino UNO is selected to connect to the
NodeMCU to establish a communication of data between them and to approach the challenges which are
mentioned.
Method of communication between NodeMCU and UNO.
For ensuring that the NodeMCU serial communication is properly connected to the Arduino UNO, a very
short message from the former device is sent to the latter one. Afterward, the Arduino verifies the
incoming message and prepares the JSON document to be sent to the NodeMCU. JSON is a structured
text-based format used for the exchange of data. Its structured design helps to be certain that the received
data is in the appropriate format without losing or overlapping data. In this paper, the values of
heart BPM, Spo2, and the body temperature sensor are sent to the NodeMCU using the Json document
while the ECG sensor is directly connected to the NodeMCU. After receiving data by this device, there is
a function that ensures that all the data have been received, after that the received information is checked
to confirm that data is in an appropriate format. Consequently, the received data is sent to the Blynk cloud
server.
Blynk
For illustrating the patient’s information an IOT platform called Blynk is used. Blynk cloud service
enables live monitoring of the patient’s condition in an elegant and professional environment. It also has
the ability to be run on a local server for example inside or nearby a hospital and the cloud service secures
a live stream of information about the patient’s condition outside the hospital.
Blynk app design layout
at the top of the page, a live graph for illustrating a live ECG signal is inserted,
while below it there are three gauges for live visualization each of heart rate in BPM, Spo2 in percentage
and the Celsius body temperature
 Design layout of live health monitoring app
The procedure to be followed to launch the product in the market
Once the idea has been generated and polished, and customers have been identified, it’s time to develop and refine the plans for the features or characteristics of a product. Most health care IoT product development companies will utilize an agile project management tool to break down and divvy up individual tasks.
These to-dos are prioritized and executed in sprints so that all areas of development — hardware, embedded software, the mobile application, and cloud interface — can progress in parallel instead of serially via sprints, the repeatable schedule blocks that make up a project’s completion process. This step entails assembling the hardware and software components according to engineering designs, models, or renderings. Additionally, to ensure real-world functionality and that features are operating as expected, any necessary connections to a user interface or the cloud, security, and third-party integrations are integrated during this phase.
Ideally, each feature is tested as it is developed. When a ticket is assigned to the QA (quality assurance) team, a QA engineer tests that feature. If a feature passes, then the developer closes the ticket; but in the event the feature fails, the QA tester annotates the defect and how to recreate it, then reassigns the ticket to the developer. At the end of every sprint, QA teams should execute limited regression testing to confirm that all functionality remained intact when new features were added by the development team. By tailoring testing to target audiences when developing new IoT health care devices, product builders can improve engagement and accelerate time to market.
Once the product design has been created, and the health-tech device has been developed, optimized and tested, it needs to be packaged and launched to market. Effectively introducing a health care IoT product to the public requires decisions about when and where to launch and approaches for pricing and marketing. Done right, health care IoT can unlock data to create interoperability and allow organizations to realize business value propositions.
To help ensure success in the long term, your IoT health care product design partner should either transfer the technology to your team or manage ongoing support. By building a scalable and robust solution that can be enhanced on occasion, medical IoT device makers both help ensure that systems don’t go down and conceive new ideas to improve existing solutions and add new features to them.
Almotiri et al. proposed a system of m-health that uses mobile devices to collect real-time data from many patients in and store it on network servers connected to the internet enabling access only to certain specific clients. This data can be used for the medical diagnosis of patients and is achieved by using a number of wearable devices and body sensor networks.
References:
2. https://www.researchgate.net/figure/Design-layout-of-live-health-monitoring-app_fig5_343586676