Project 1
AIM:
To develop a basic hydraulic model of a river using HECRAS.
OBJECTIVE:
In this challenge, the task is to develop a basic hydraulic model of a major river using HECRAS and other supporting softwares without considering any obstruction in water course.
PROCEDURE:
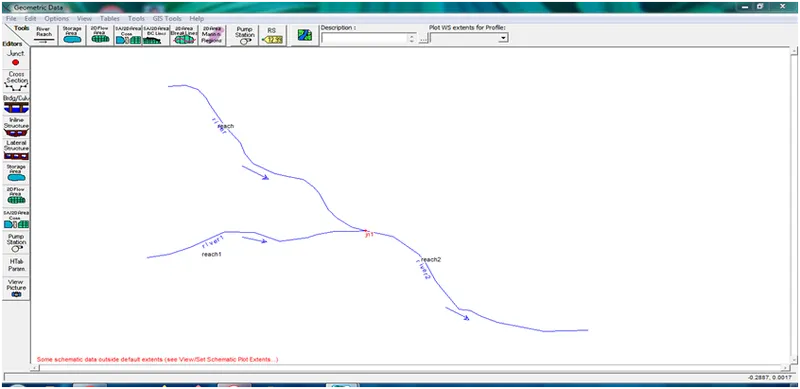
- Open HECRAS and start a new project. Draw a river of 10 km reach using geometric data editor tool.
2. Enter the given cross section datas using Cross Section in geometric data editor by following the given procedure:.
- To enter the cross section data, open the cross section data option in the geometric data editor.
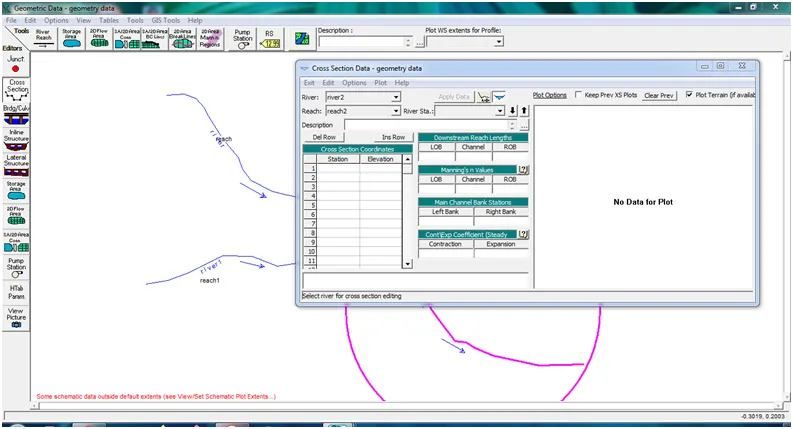
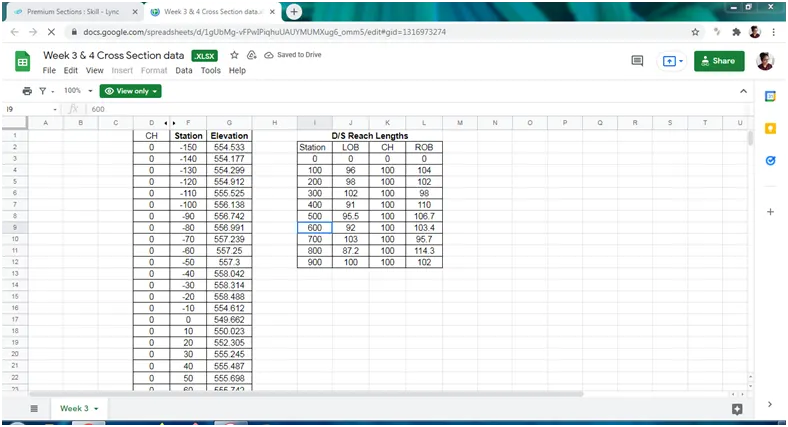
- Along side this, open the excel sheet containing the cross section data details and the downstream reach lengths.
- Now select the river and reach for zero chainage (downstream).
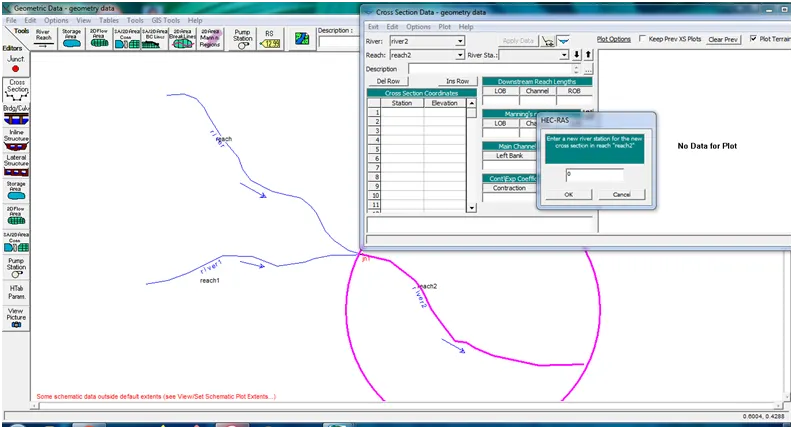
- Click on ‘Options’, ‘Add a new cross section’, type ‘0’ in the dialog box, click ok. In the description type ‘ D/S Confluence of reach 2’.
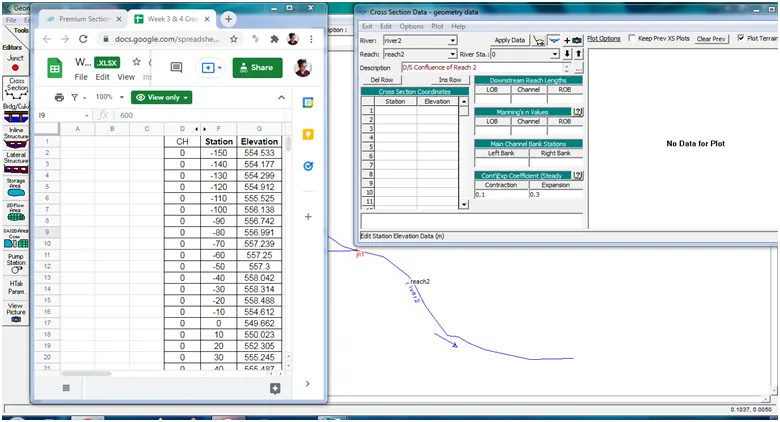
- Now, from the exel sheet, copy the station and elevation data and paste it (CTRL V) in the cross section coordinates table.
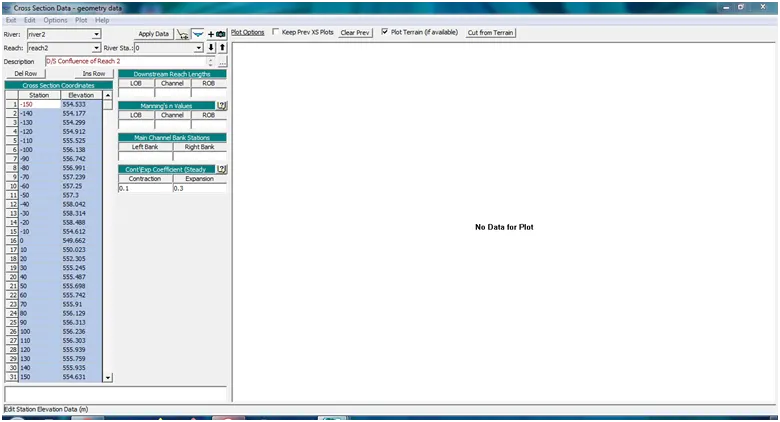
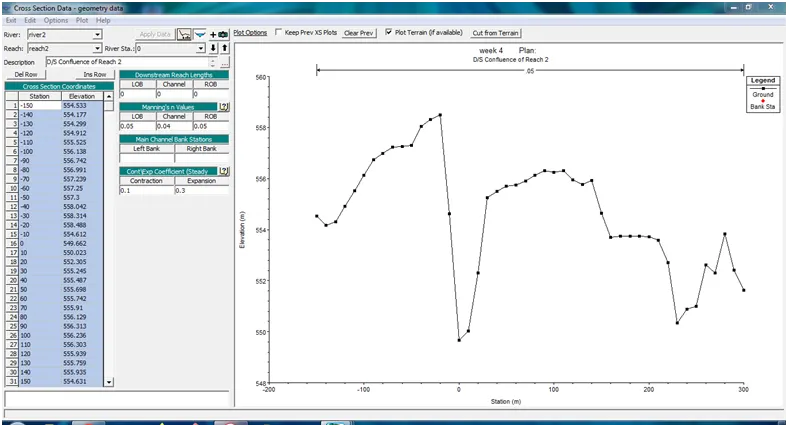
- Then for river station 0, the d/s reach lengths will be zero for LOB, Channel and ROB. Type the assumed Manning’s n values in the LOB, ROB and channel. Then click ‘Apply data’.
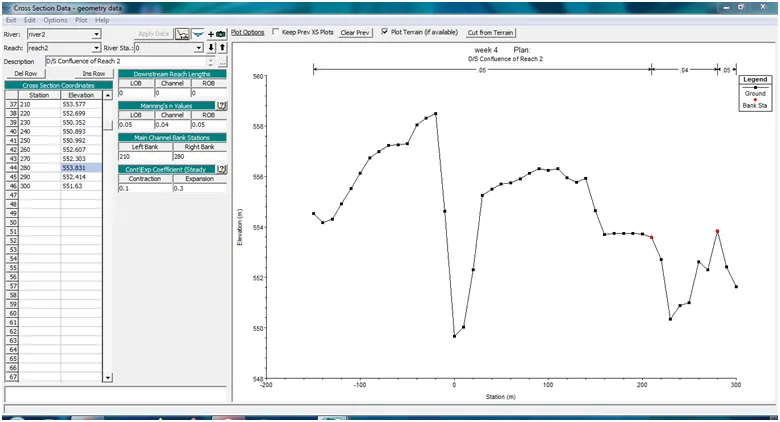
- Then for Main Channel Bank Stations, select the LOB and ROB stations of approximate equal elevation and type the station in left and right bank spaces and click ‘Apply data’.
- Follow the same procedure for the 100, 200 ,etc chainages and type the d/s reach lengths also.
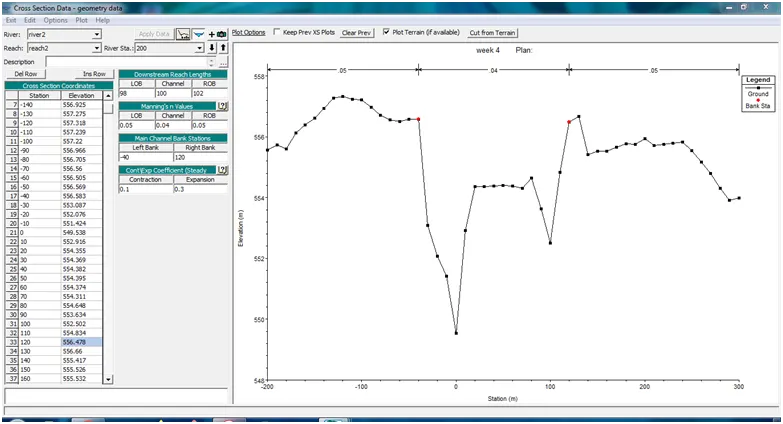
- For cross section at junction, give a different description.
- Next for the other sub rivers, select the respective river and reach names from the drop down. And repeat the same procedures, starting from 0 chainage.
- Click ‘Exit’ after entering all the cross section details. The cross dection lines will appear in the geometric data editor.
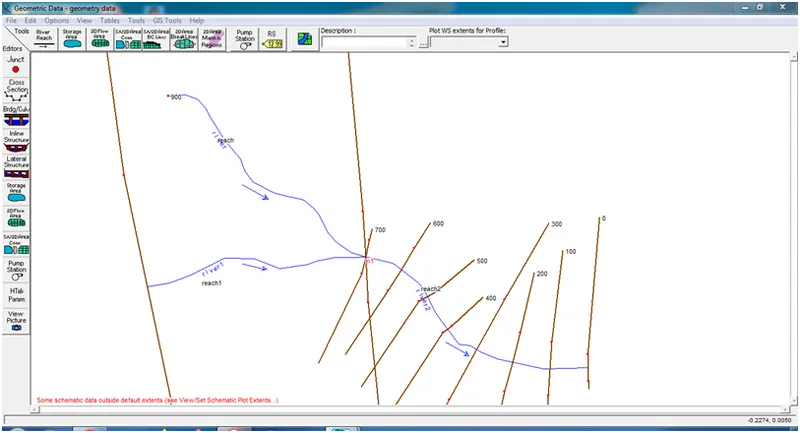
3. To find the catchment area of the river using toposheet, follow the given steps:
- Open AutoCAD and insert the toposheet image.
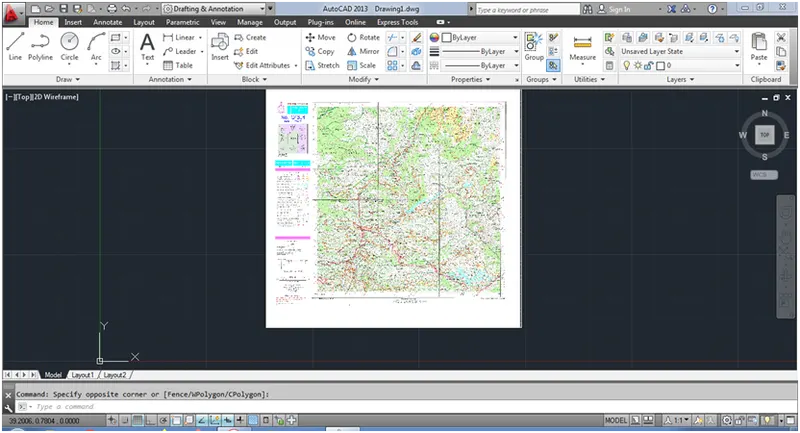
- Select a major river in the toposheet to draw and draw on the river using Polyline and give a color (red) to it.
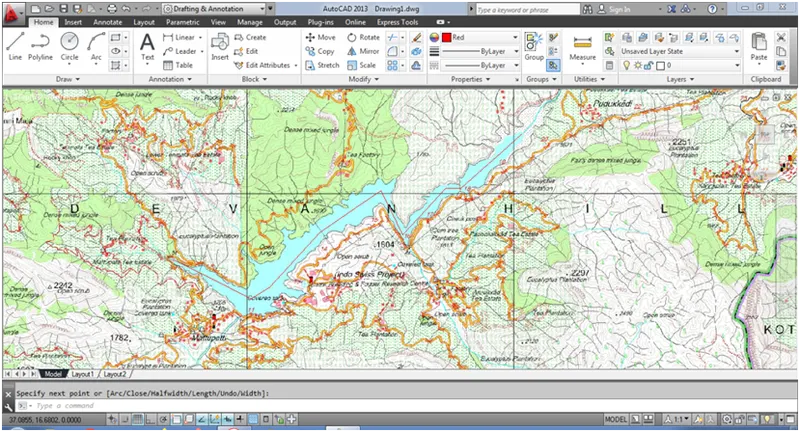
- Now to draw the catchment area of the river, use a different colour polyline and draw the catchment area.
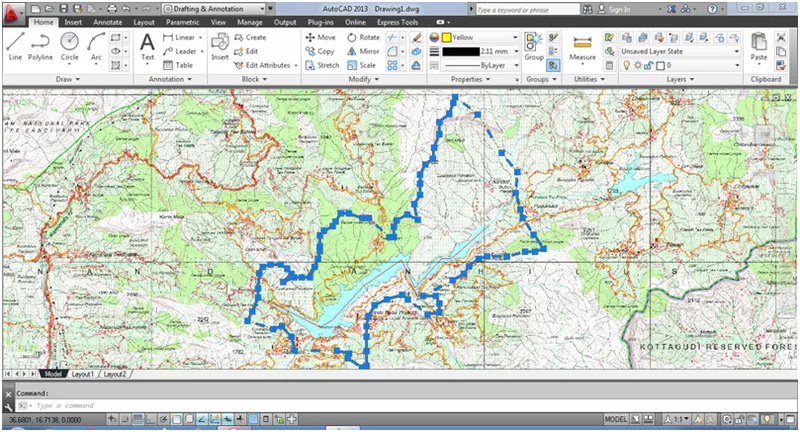
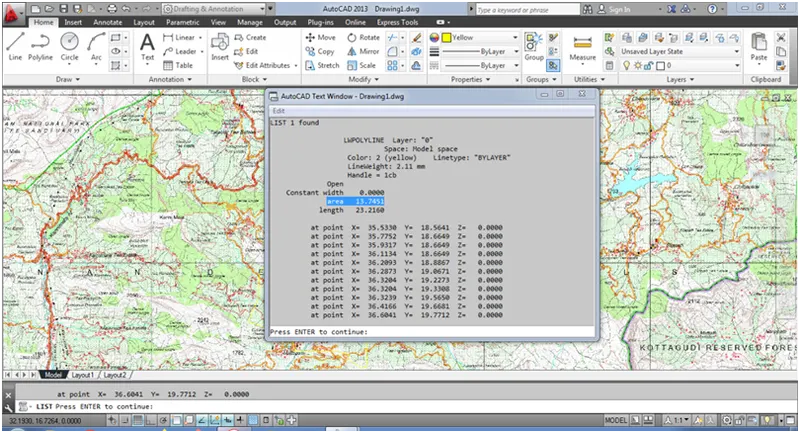
- Select the catchment area and type the command ‘li’, the area of the catchment will be displayed : 13.7451 km2
4. To find flow calculations using UH methods:
- 25 year flood computation:
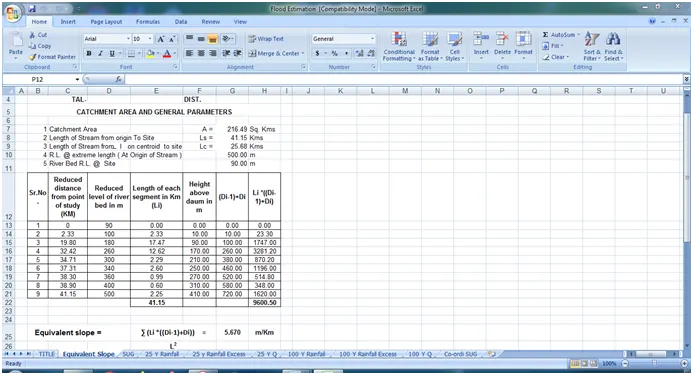
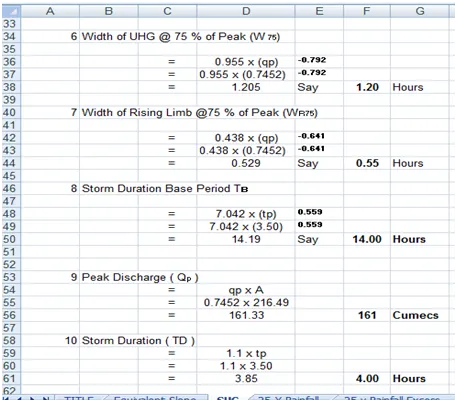
- After finding out the catchment area, find out the length of the river , centroid of the catchment and other datas mentioned in the screenshot below and do the necessary calculations.
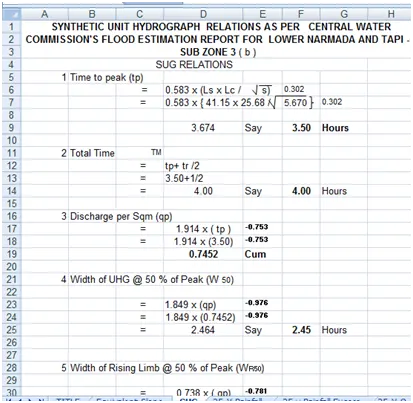
- Next find out the following: Time to peak, total time, discharge per sqm, W50, Wr50, W75, Wr75, Storm duration base period, Peak discharge, Storm duration.
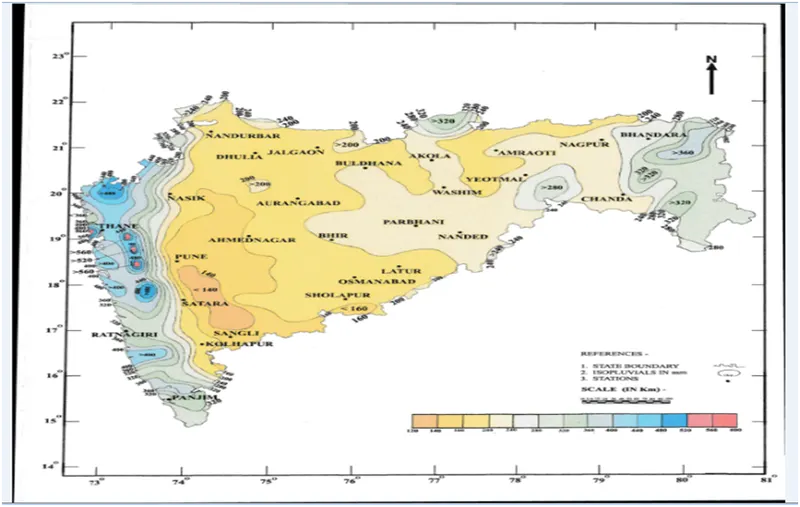
3. This is the isopluvial map for 25 year flood; from this map, find the rainfall for the respective lattitude and longitude of the project site.
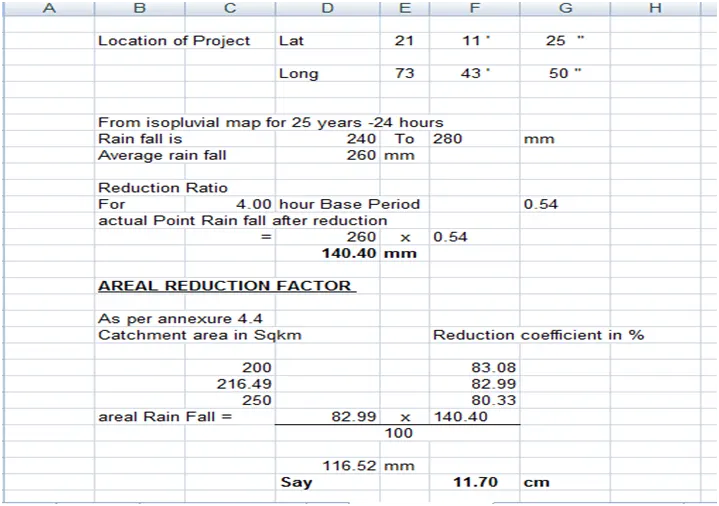
- Then find out the reduction ratio from the flood estimation manual and calculate the areal rainfall as shown below:
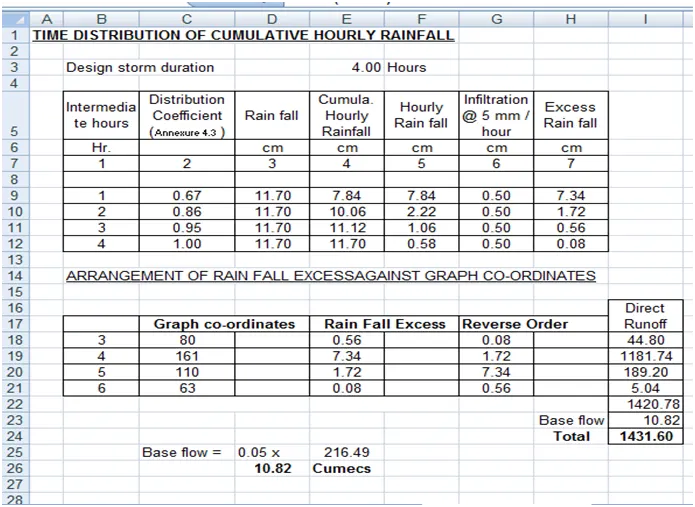
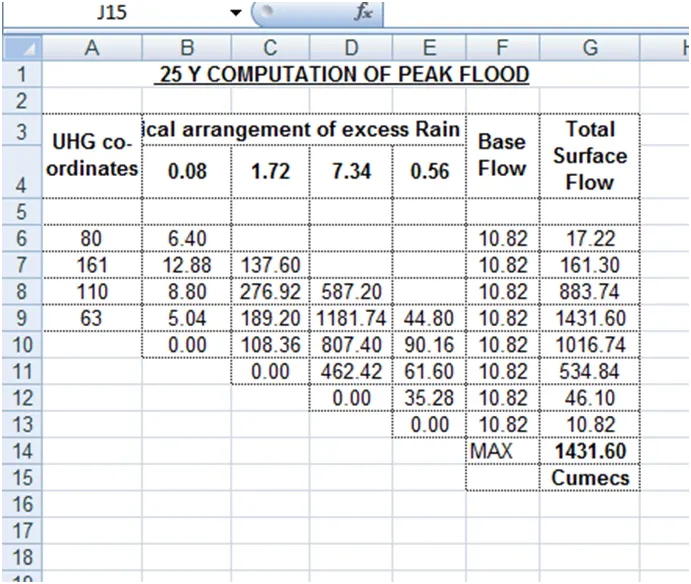
- Now from the UH graph, select 4 discharge coordinates (since the base period is 4 hrs), such that they have the highest value among the others. Using these 4 coordinates and other datas, we find out the total surface flow:
- 100 year flood computation:
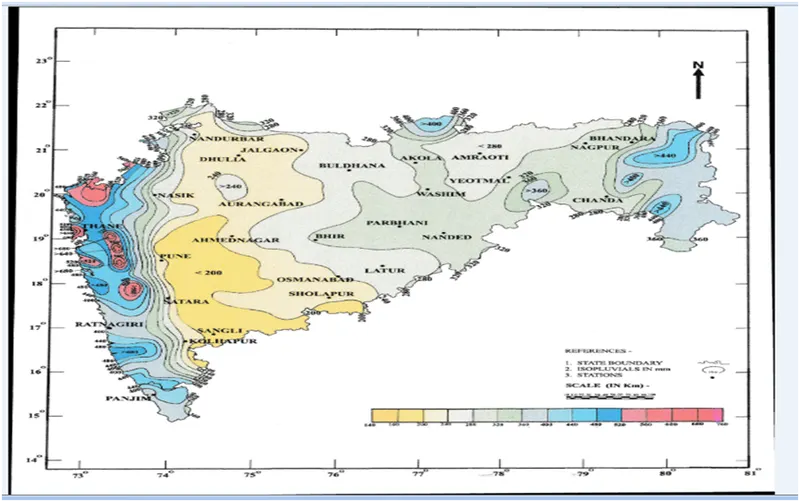
- In the case of 100 year rainfall, the isopluvial map is given below. So according to this, the rainfall values and hence other values will change.
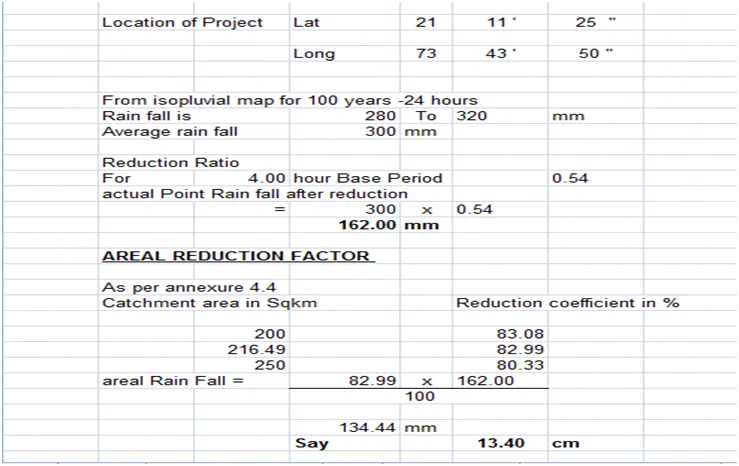
- The rainfall calculation is shown below:
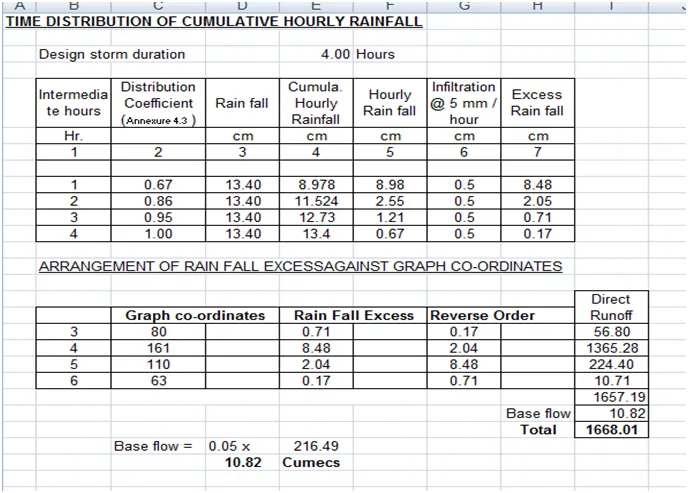
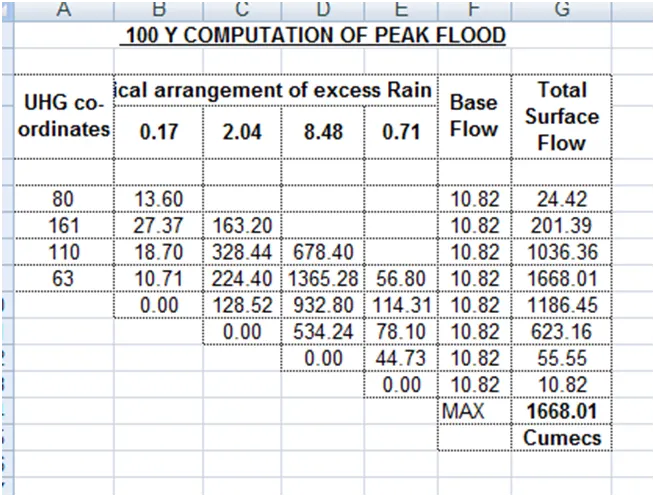
3. The calculation of the total surface flow is shown below:
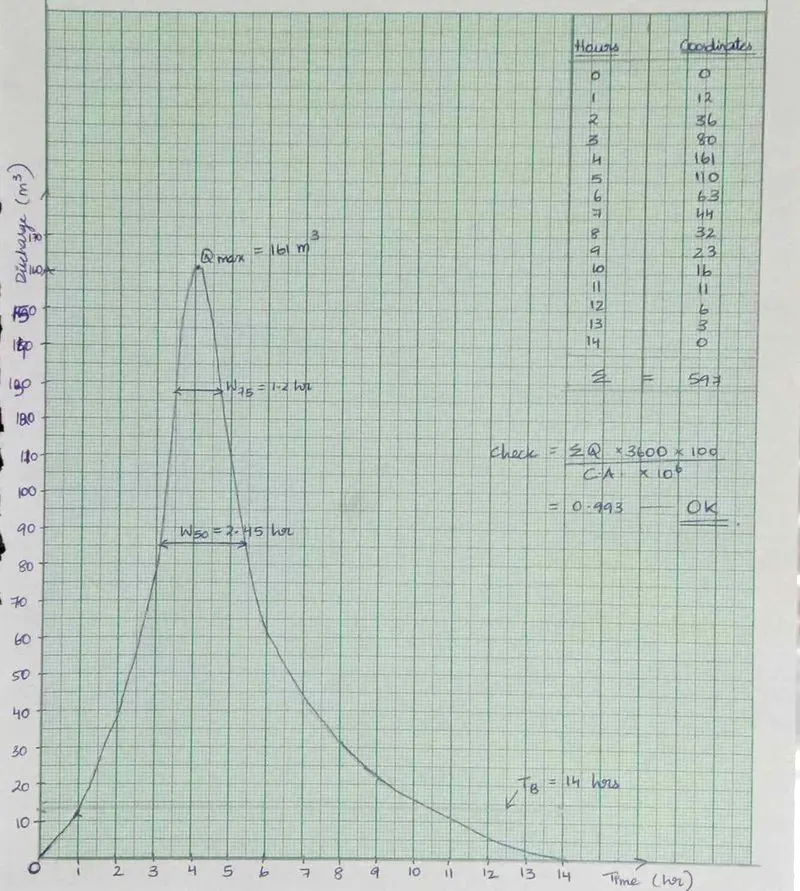
5. The graph obtained from UH method will be as follows:
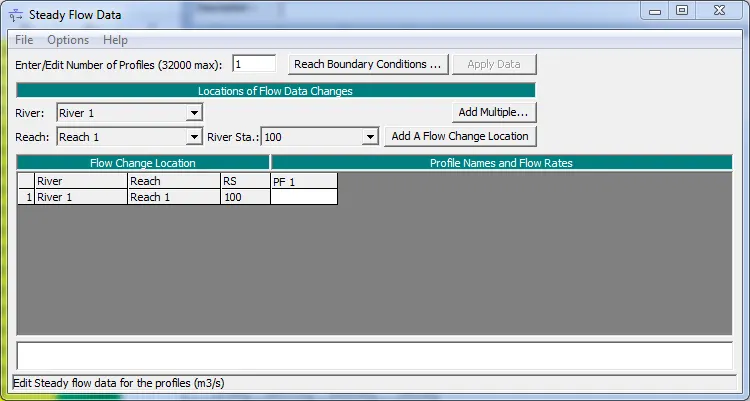
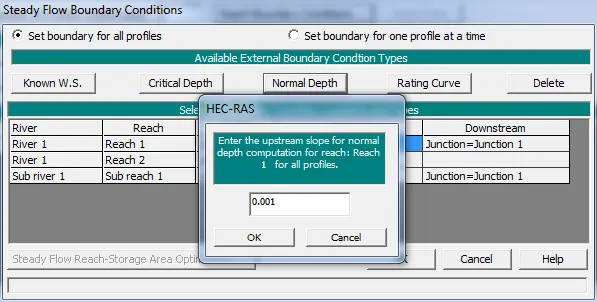
6. TO run different profiles, open steady flow data in HECRAS and enter the value in PF1. Then to define the boundary conditions, click in Reach Boundary Conditions , click on Normal Depth, enter the slope, OK. Then save the data in File, give a name.
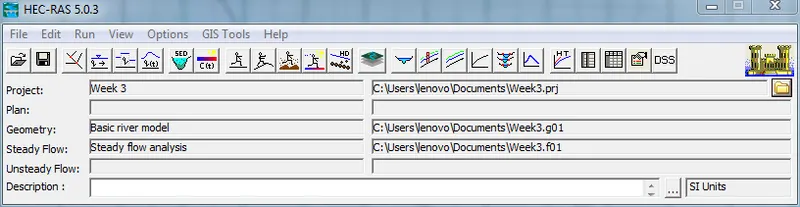
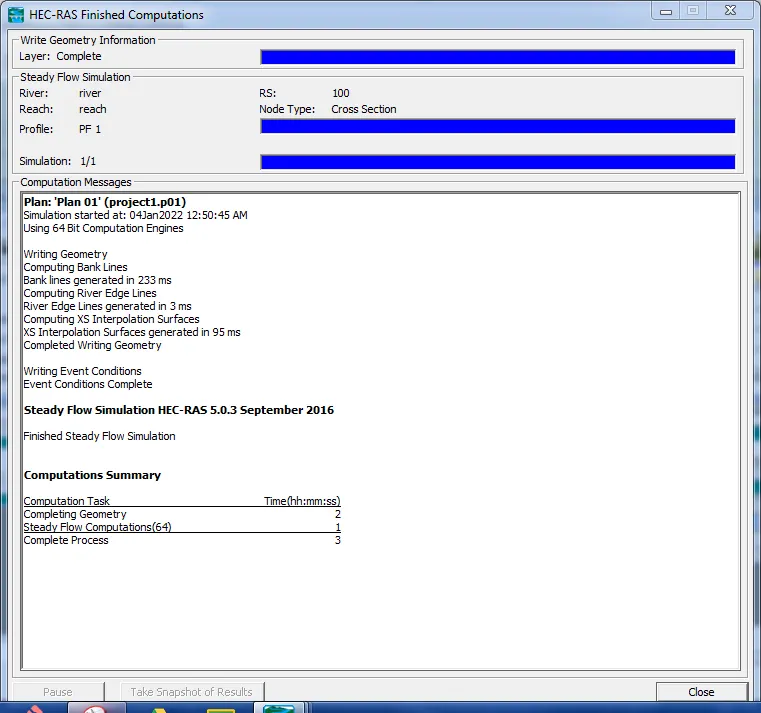
7. Now click on 'Run', then "Steady flow analysis', click 'Compute', the steady flow analysis will be done:
8. To see the cross section of the river, click on the cross section button, the following window shows:
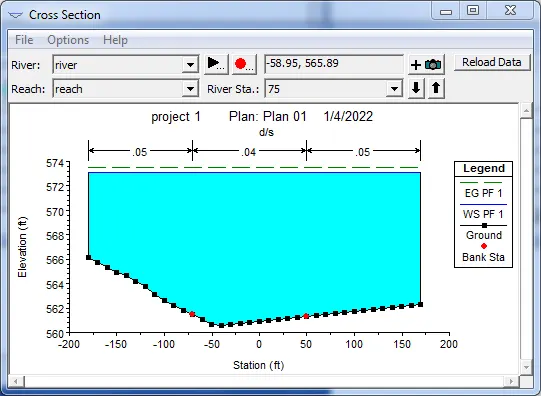
9. As we select different stations, we can see the respective cross sections.
10. The other way is to click on View Profiles, we can see the elevation of the river from upstream to downstream.
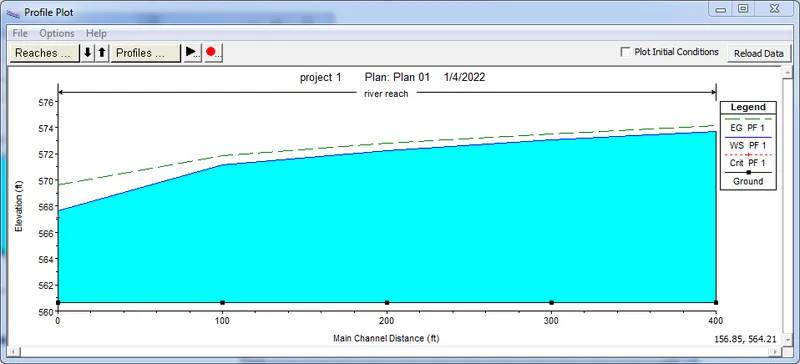
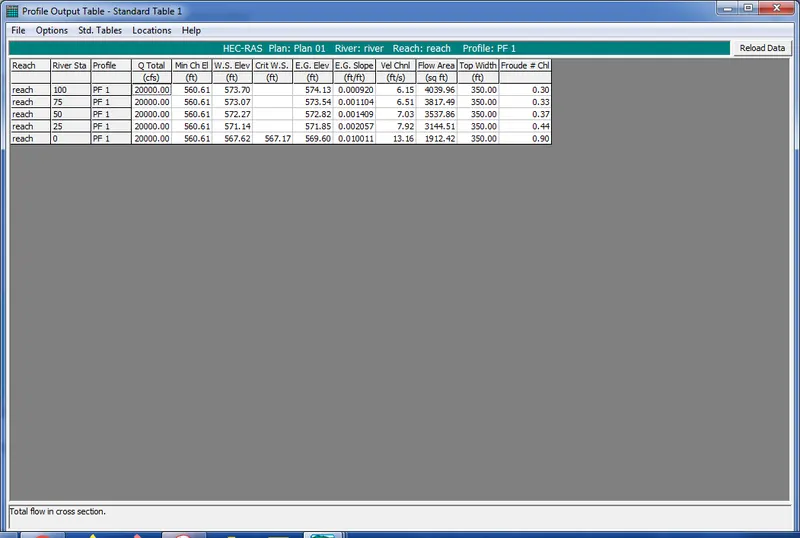
11. This is the Profile Outpiut Table:
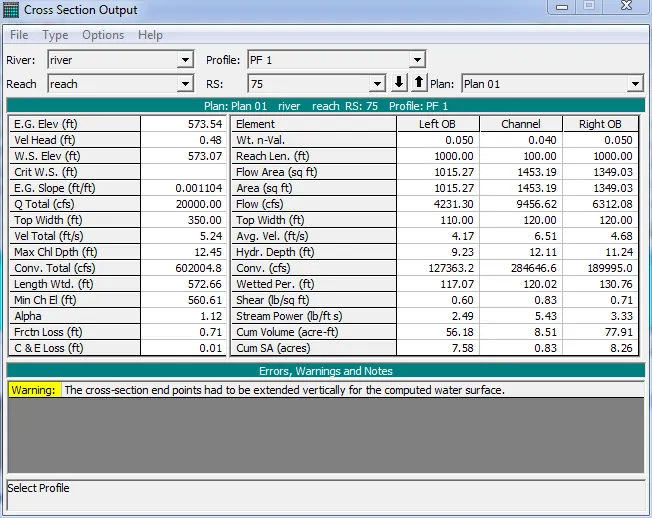
12. This is the cross section output table:
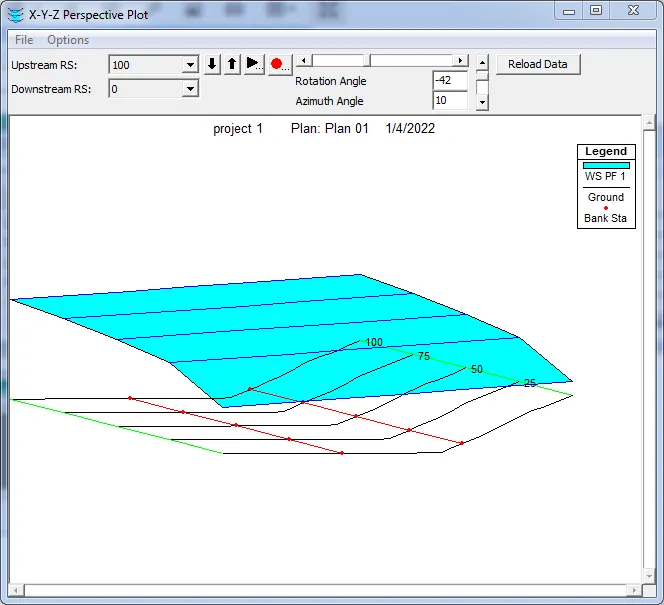
13. This is the 3D View:
CONCLUSION:
The hydraulic model of the river has been developed.