Project 2
AIM:
To develop a hydraulic model of the selected river and include all the conditions mentioned in the question.
PROCEDURE:
- Draw a 10km river reach and add all the cross section details.
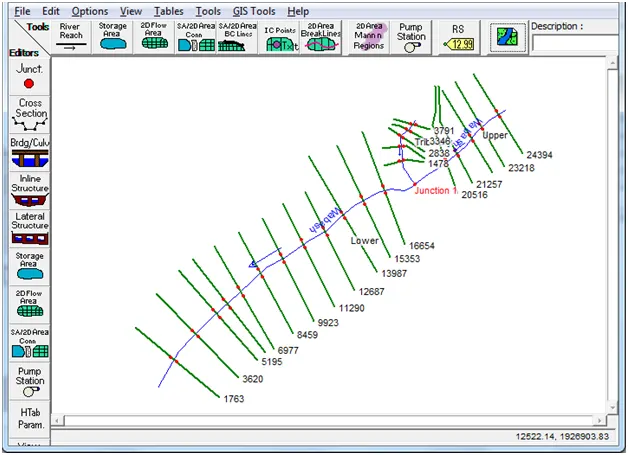
- Click on the ‘Bridges and culverts’ Option.
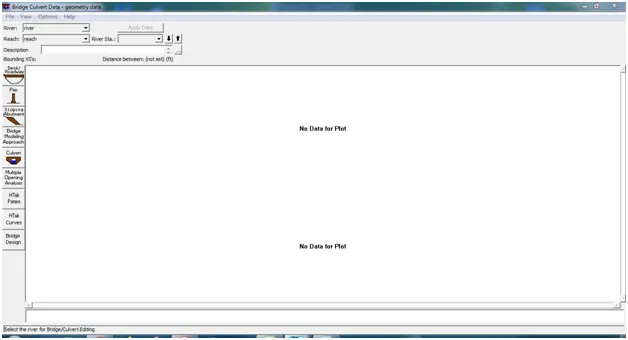
- Click on Options, Add a bridge or culvert, enter a river station in the dialogue box, and click ok.
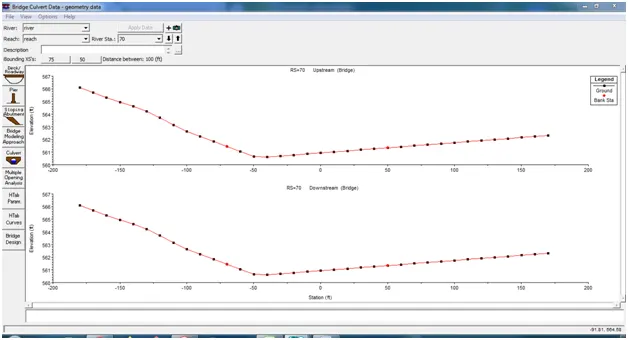
- Click on ‘deck or roadway editor’, enter the datas. Enter the lob and rob stations. For high cord , type the elevation and for low cord, subtract the thickness of the road from the elevation. Then click on ‘Copy US to DS’. Click OK.
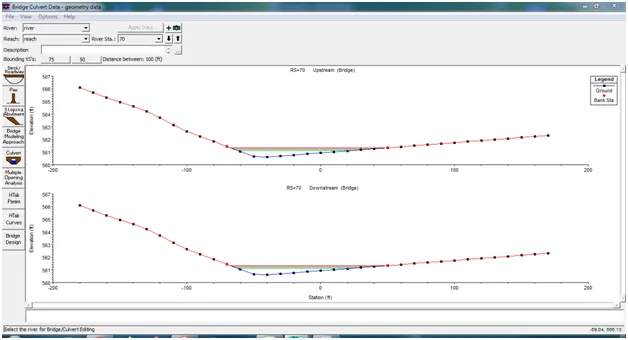
- After exiting, we can see the bridge in the river reach.
- To add a culvert, go to ‘bridge and culvert’, ‘Add a new bridge or culvert’, enter the station, click on Deck / roadway, enter the datas.
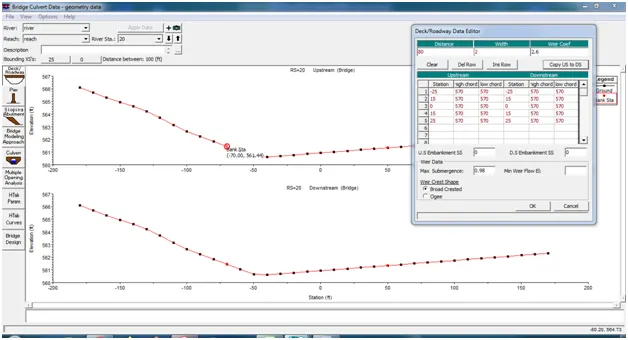
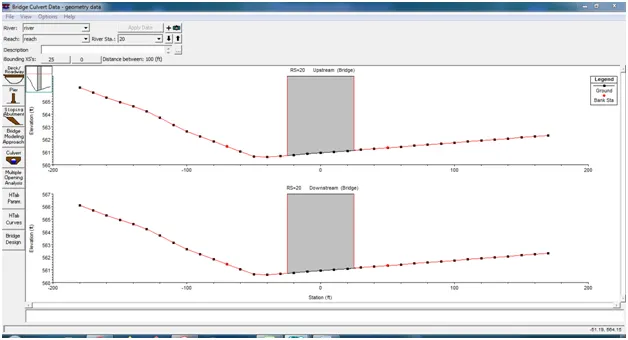
- To add culvert, click on ‘Culvert’, enter all the datas ferom the excel sheet.
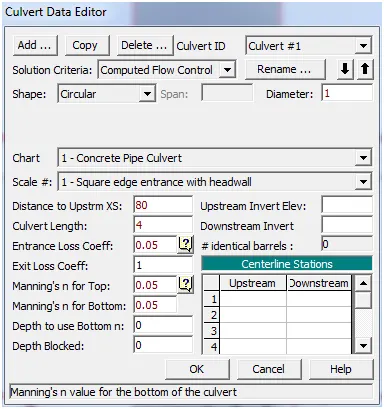
- Give 0 as upstream and downstream centerline stations and click ok:
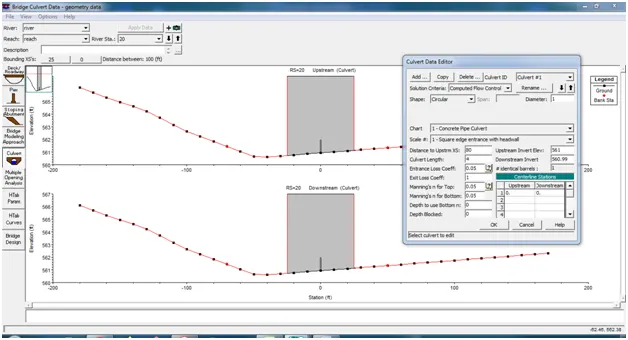
- To add more culverts, click on copy , then give the stations and click ok
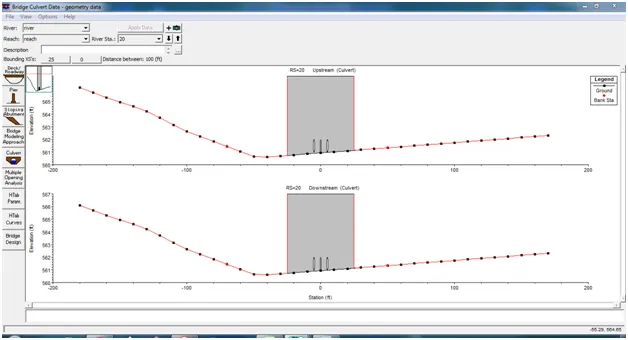
- Now exit and save the geometry and the bridges and culverts has been developed.
- Open RAS MAPPER, Click on Tools, ‘New Terrain’ , add the DEM file, click create.
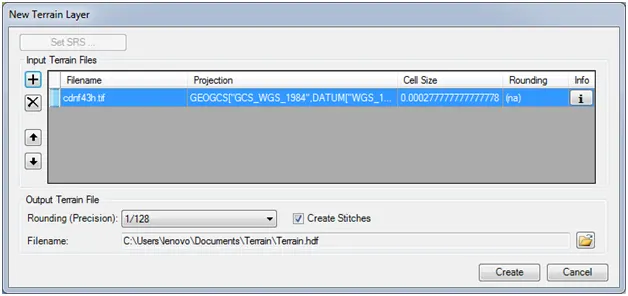
- .The DEM file of the river will appear in the RAS mapper.
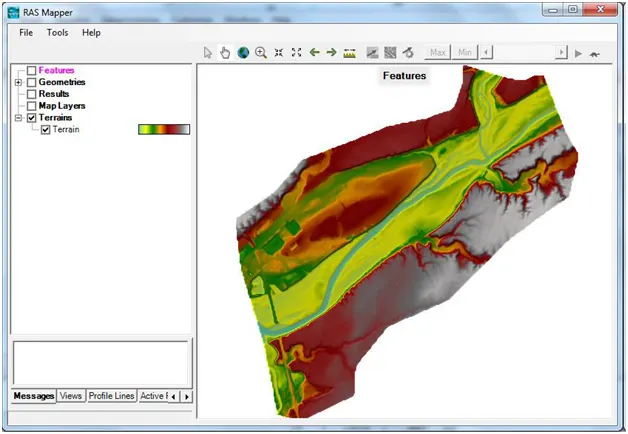
- There are three reaches in the DEM file in light blue color shown; next we will draw the river centerline, bank lines and flow paths.
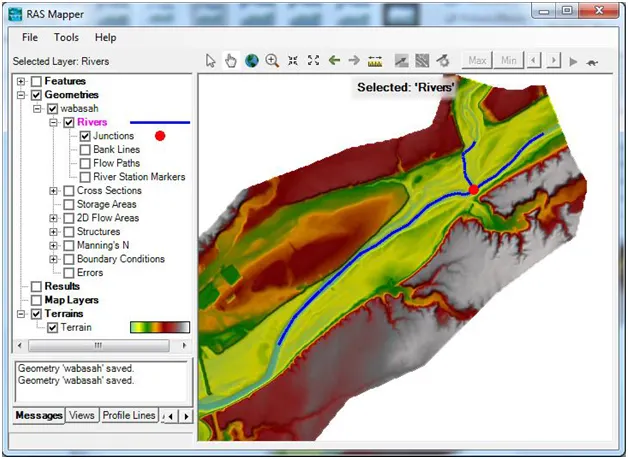
- In the Geometries option, right click on Rivers and select Edit Geometry(BETA), we will be shown the following toolbox for drawing:

- Start drawing the river centerline from the upstream end of the upper reach towards the downstream until you reach the intersection/junction. Once you reach the junction, double click to stop. A dialogue box will appear to type in the name of the river and reach . Click OK.
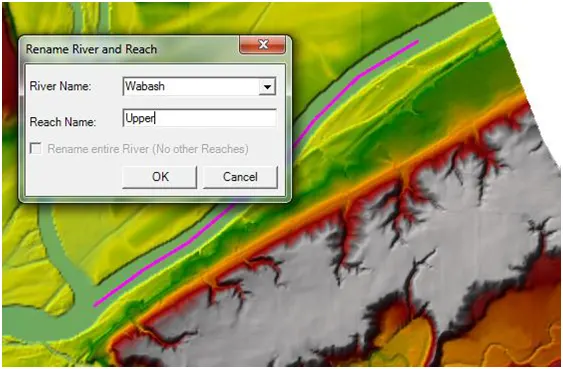
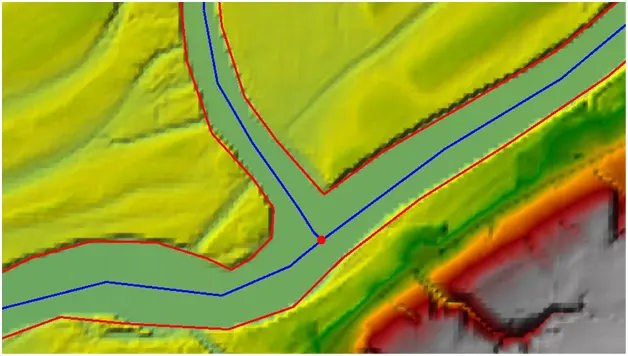
- To create bank lines, right click on Bank Lines (under Rivers) and select Edit Geometry (BETA) as shown in the figure below.
- Draw along the banks of the river, use a different color(red), by the same procedure of drwing the river.
- Save the RAS Mapper
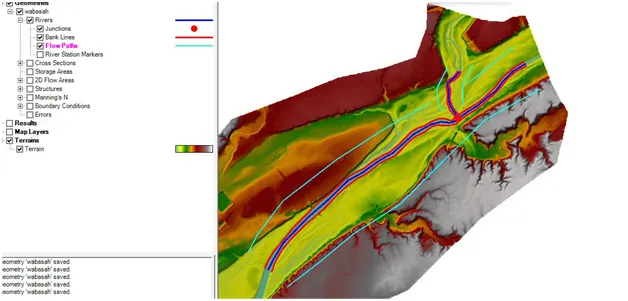
- The flow paths can also be drawn using the same procedure as before; right clicking on Flow Paths layer and selecting “Edit Geometry (BETA)”.
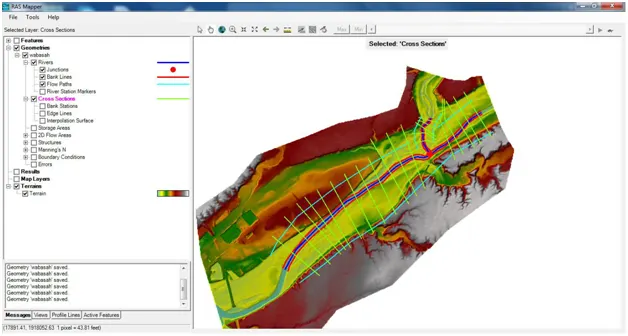
- To create cross-sections, right click on the Cross-Sections layer and select Edit Geometry (BETA)”. Repeat the same procedure for drawing as before.
- After giving cross section details, the river will be as shown below:
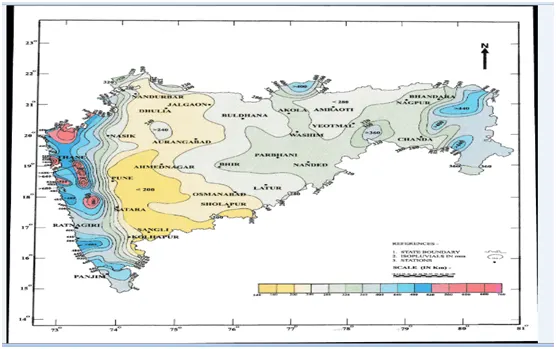
- In the case of 100 year rainfall, the isopluvial map is given below. So according to this, the rainfall values and hence other values will change.
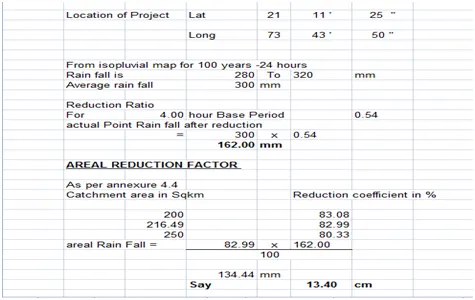
- The rainfall calculation is shown below:
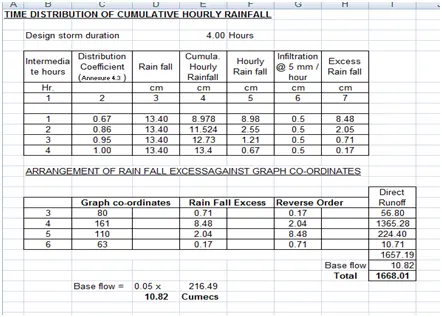
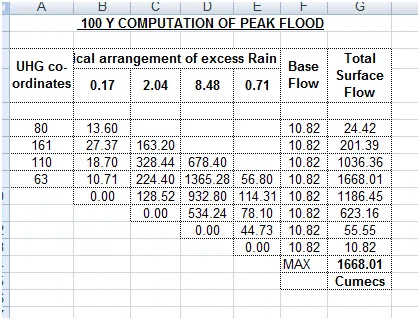
- The calculation of the total surface flow is shown below:
Steady Flow Analysis:
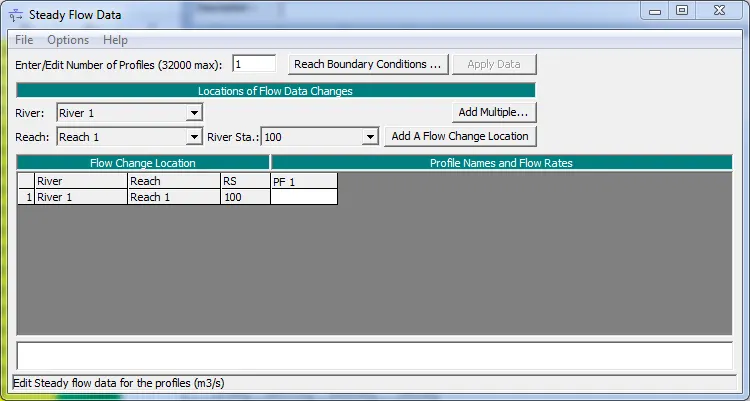
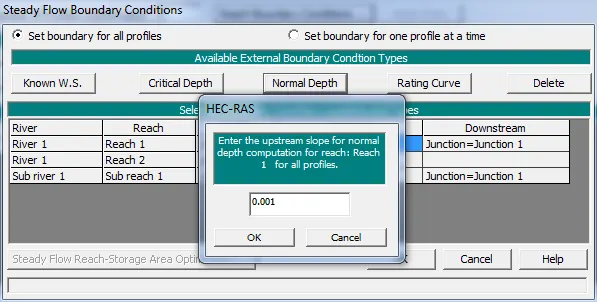
- TO run different profiles, open steady flow data in HECRAS and enter the value in PF1. Then to define the boundary conditions, click in Reach Boundary Conditions , click on Normal Depth, enter the slope, OK. Then save the data in File, give a name.
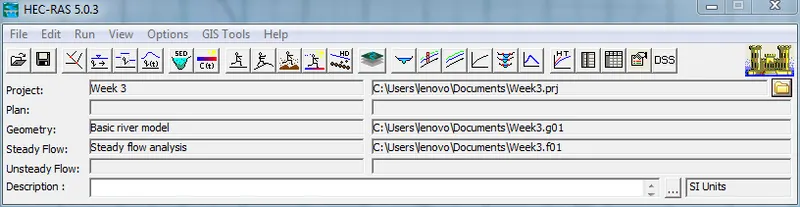
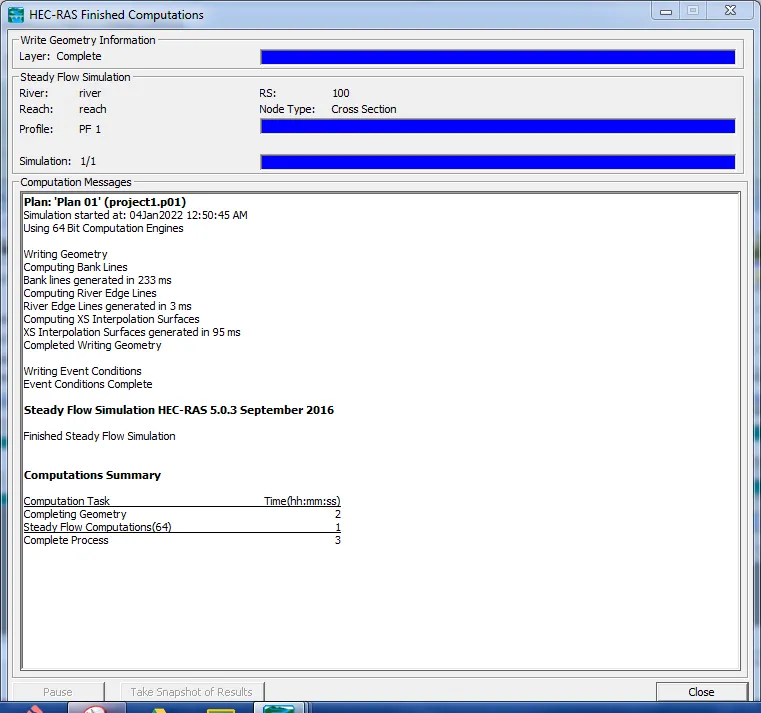
- Now click on 'Run', then "Steady flow analysis', click 'Compute', the steady flow analysis will be done:
- To see the cross section of the river, click on the cross section button, the following window shows:
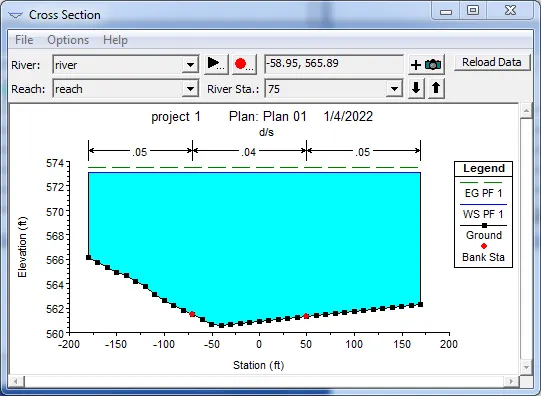
- As we select different stations, we can see the respective cross sections.
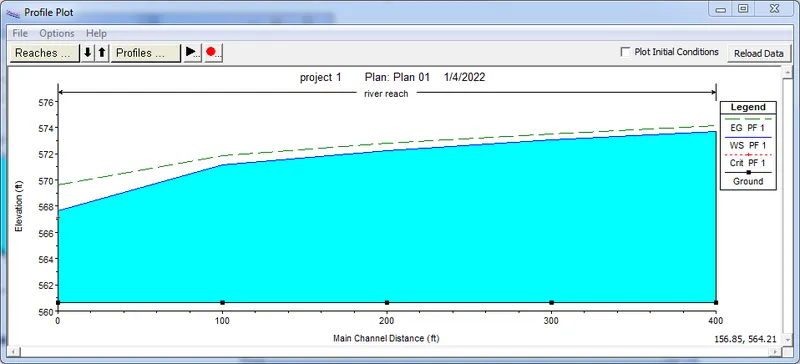
- The other way is to click on View Profiles, we can see the elevation of the river from upstream to downstream.
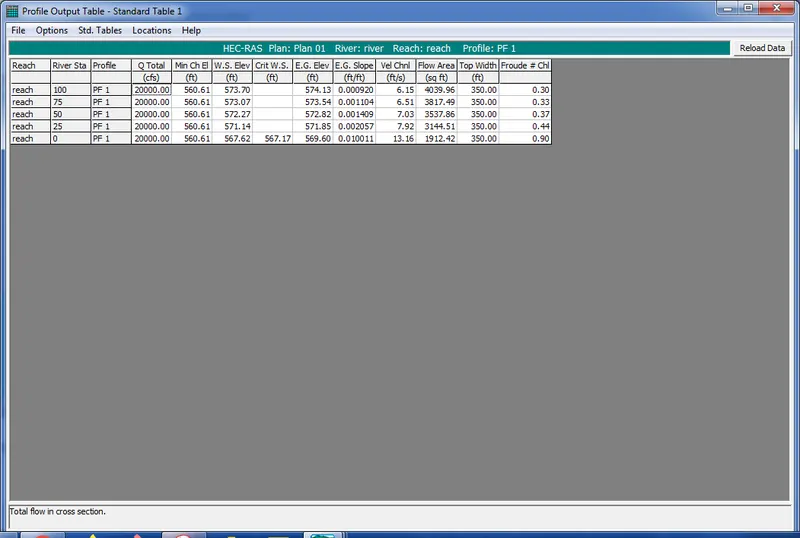
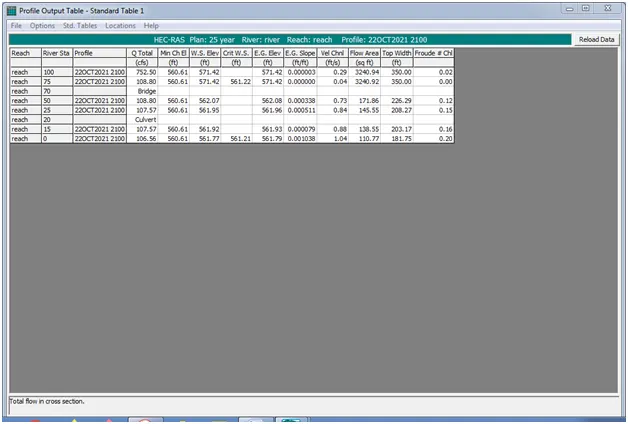
- This is the Profile Outpiut Table:
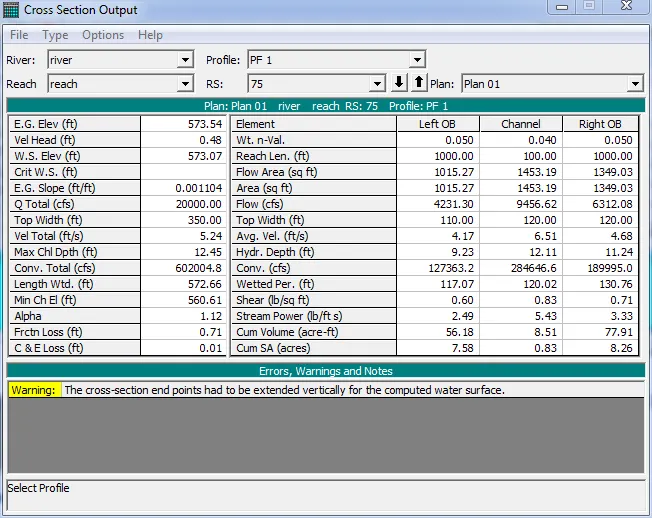
- This is the cross section output table:
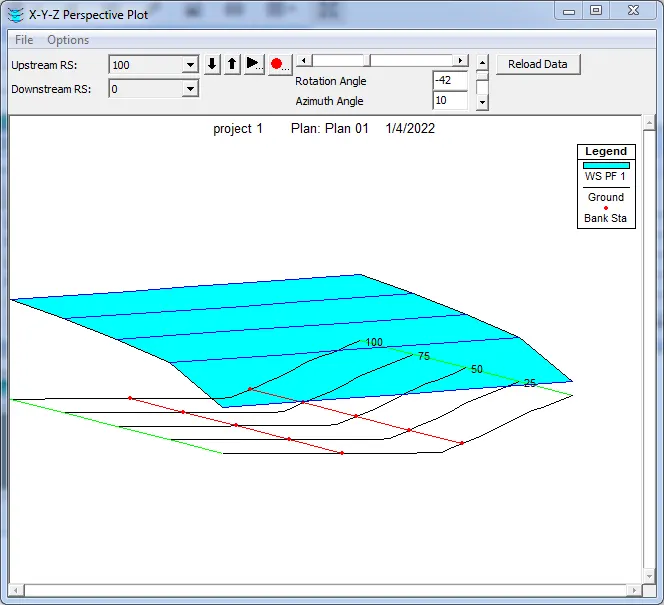
- This is the 3D View:
Unsteady flow analysis:
- Open Unsteady Flow Analysis option;
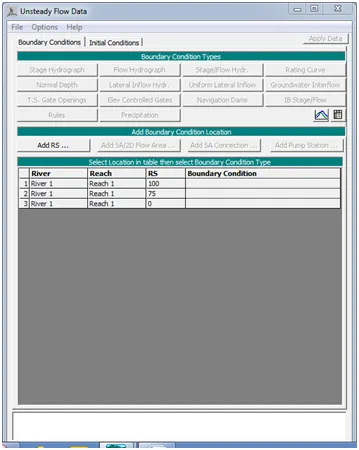
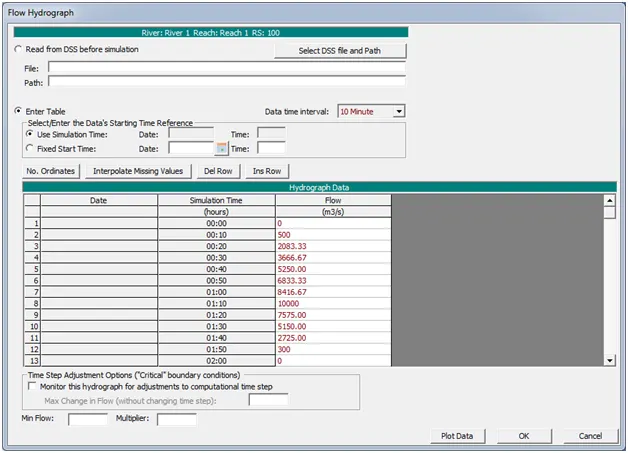
- Now for selecting the Boundary conditions, for u/s, select Flow Hydrograph, select the time interval, type in the data and click on Interpolate Missing Values and then click OK.
- For d/s, select boundary condition as Normal Depth and give the friction factor and click ok.
- Save the Unsteady flow data.
- Now click on Perform unsteady flow simulation, tick the Programs to run in, enter the starting and end date and time; select computation interval as 1 min, hydrograph o/p interval as 1 min and all other intervals as 1 min. Then File, New Plan, give a plan name, give a short ID, Click OK.
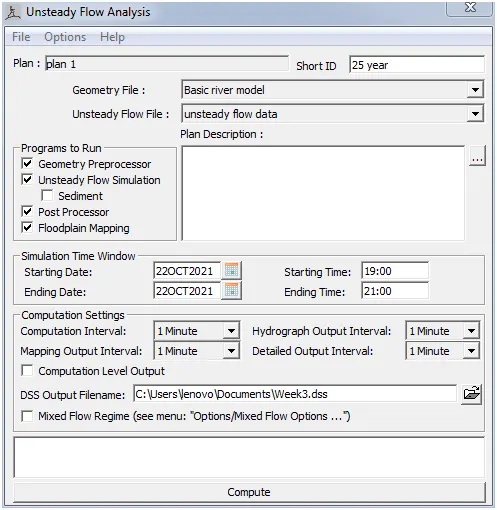
- Then click on Compute
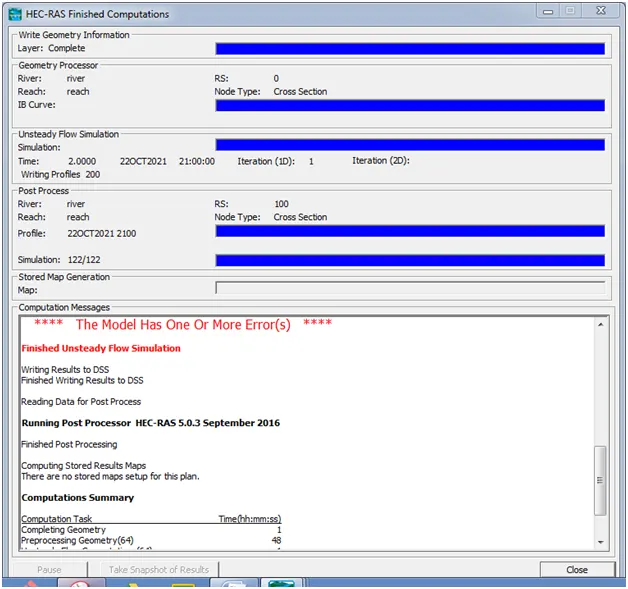
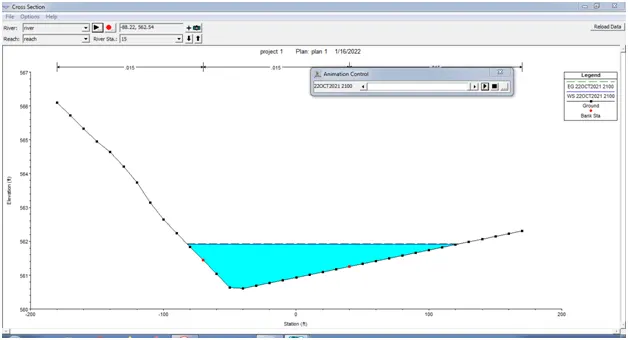
- Close the window. Open Cross section, we can see the cross section of our river for different river stations.
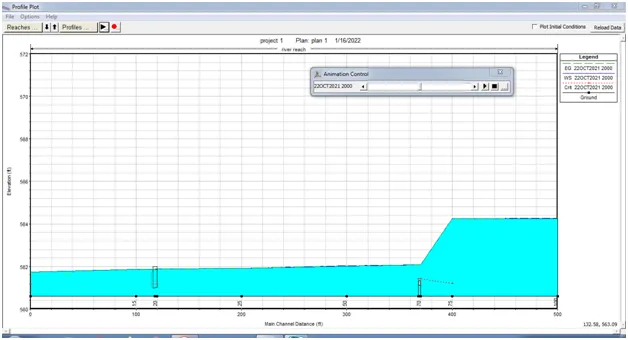
- Next, when we click on Profile plot, we can see the profile plus the animation.
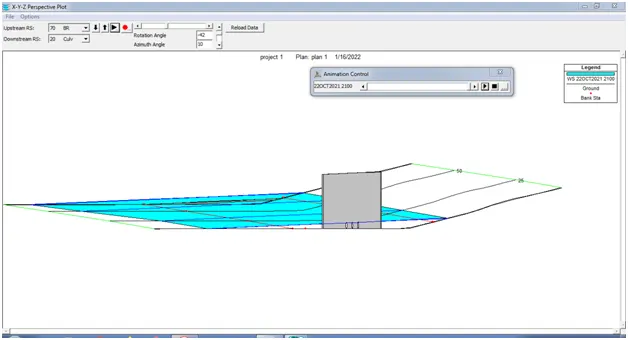
- This is the next type of result:
- This is the Profile output table:
CONCLUSION:
The hydraulic model of the river including all the details has been developed.