Modelling and simulation of flow through a flowbench
1. Aim
- Create a 3D model of a flow bench.
- Run parametric study on different valve lifts.
- Run flow analysis and obtain a plot of lift vs mass flow rate.
2. Introduction
Computational Fluid Dynamics (CFD)
Computational Fluid Dynamics (CFD) is the analysis of fluid flows using numerical solution methods. Using CFD, you are able to analyze complex problems involving fluid-fluid, fluid-solid, or fluid-gas interaction. Engineering fields where CFD analyses are frequently used are for example aerodynamics and hydrodynamics, where quantities such as lift and drag or field properties such as pressures and velocities are obtained. Fluid dynamics is involved with physical laws in the form of partial differential equations. Sophisticated CFD solvers transform these laws into algebraical equations and are able to efficiently solve these equations numerically.
Total Pressure:
Total pressure measures the total energy of the airstream and is equal to static pressure plus velocity pressure. The total pressure is the sum of the static and dynamic pressures. Total pressure is the total of static pressure p, dynamic pressure q, and gravitational head.
Static Pressure:
Static pressure is a term used in fluid dynamics to define the amount of pressure exerted by a fluid that is not moving. Static pressure is typically measured using a force divided by an area, or measured in length units when using a pressure head. Static pressure, when combined with dynamic pressure, can be used to determine the total pressure of a system, such as in a pipe or tank.
Mass Flow Rate:
The mass flow rate is the mass of a liquid substance passing per unit of time. In other words, the mass flow rate is defined as the rate of movement of liquid passing through a unit area. The mass flow is directly dependent on the density, velocity of the liquid, and area of cross-section.
Grid Dependency Test:
Grid dependency test, where, analysis begins with a coarse mesh and it is refined to a finer mesh for each run until the results do not change significantly and depend on the grid size anymore. As the grid or mesh size approaches zero, the approximate solution is almost equal to the actual solution.
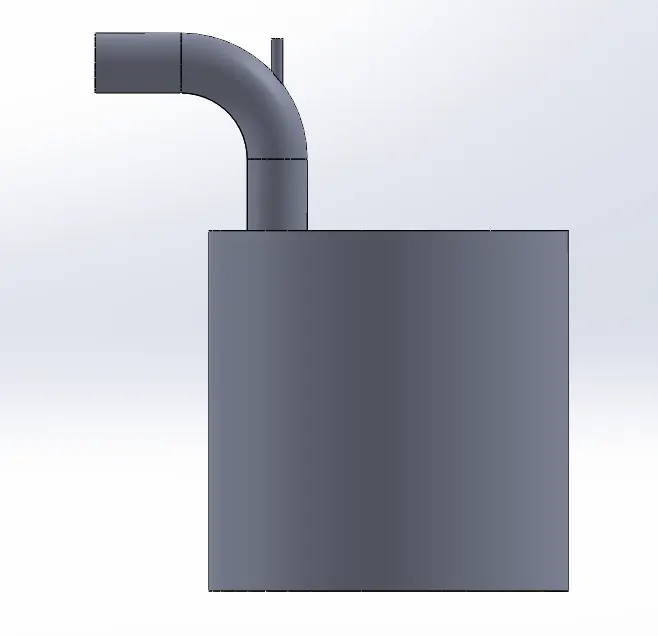
3. CAD 3D Model:
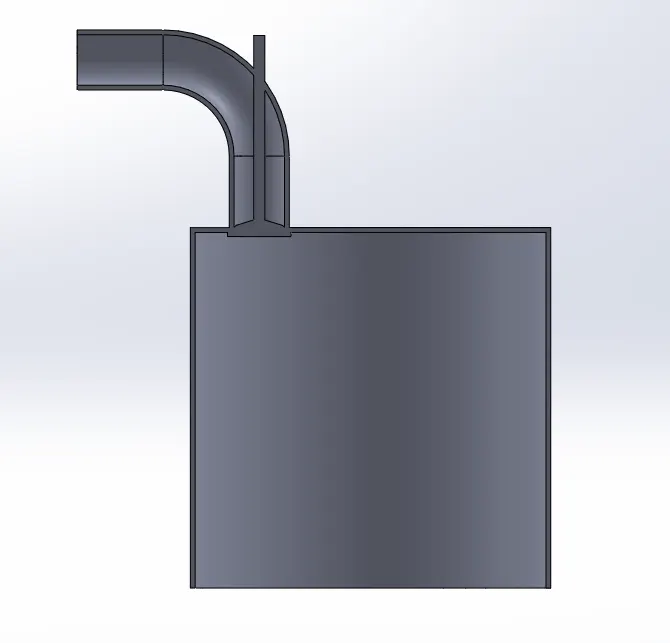
Sectional View:
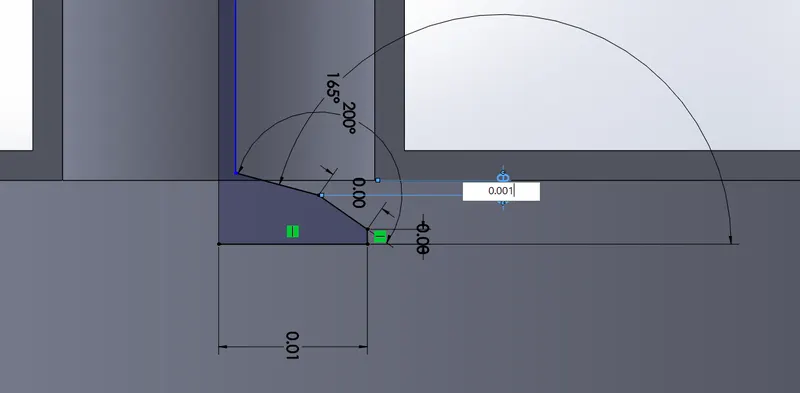
Dimension of Valve Lift:
Save the Model as a Flow bench.
4. Flow Simulation:
Create Lids to close inlet and outlet faces.
4.1 Input Parameters:
- Internal flow simulation.
- Water is the working fluid.
- Pressure: 101325 Pa.
- Temperature: 293.2 K.
4.2 Boundary Conditions:
- At Inlet: Total Pressure at 2bar.
- At Outlet: Static Pressure at 1bar.
4.3 Goals:
- At Outlet select the lid and select the mass flow rate.
5. Grid Dependency Test:
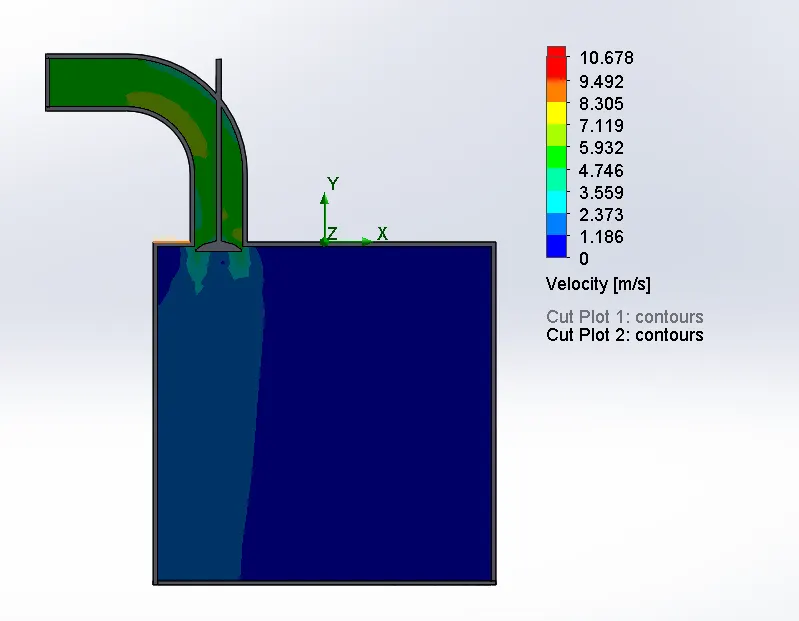
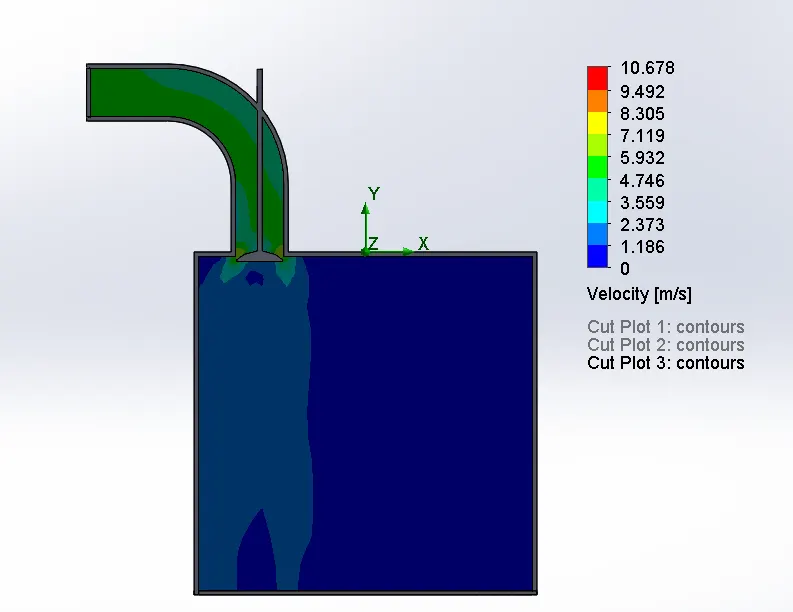
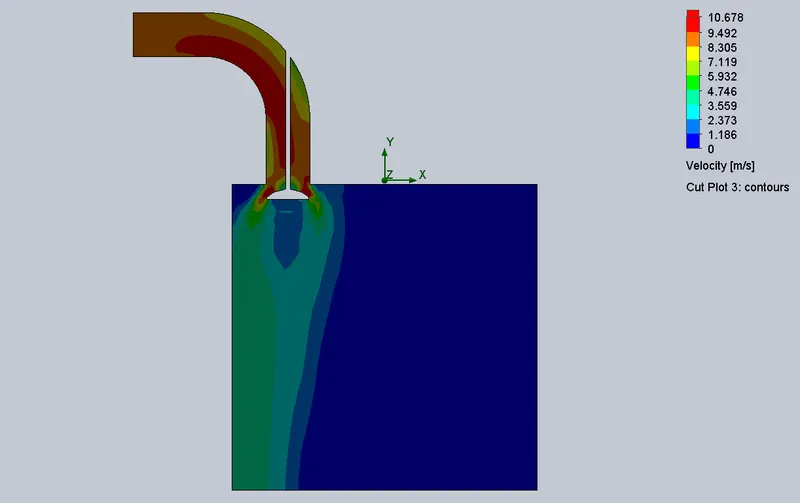
Velocity plot at grind size: 3
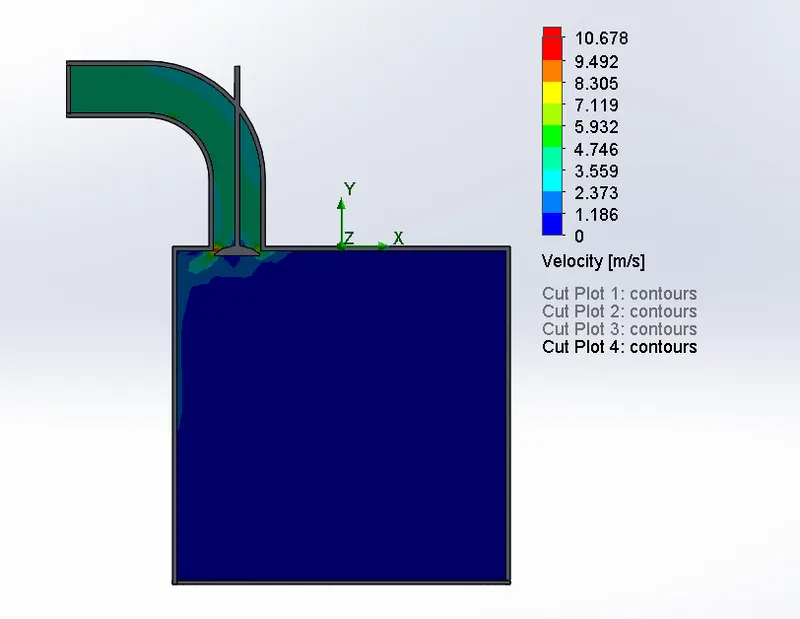
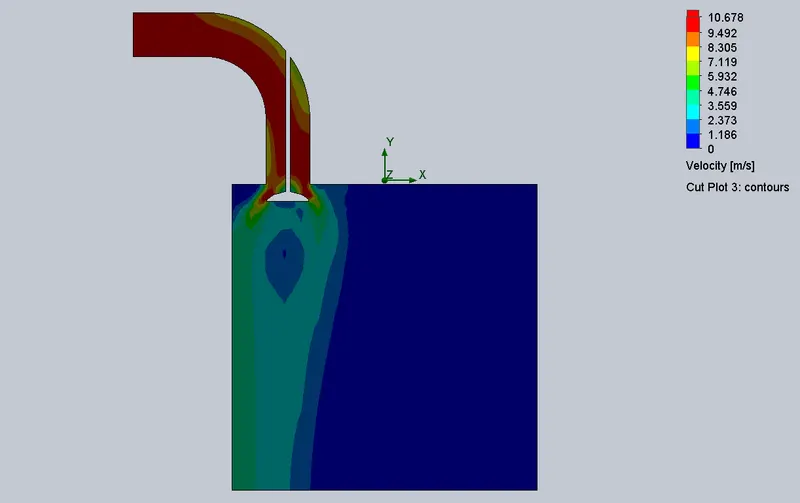
Velocity Plot at grid size: 4
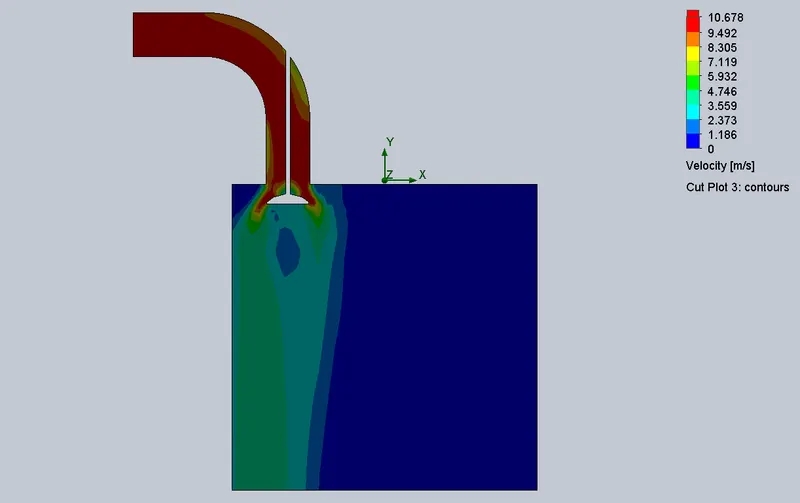
Velocity Plot at grid size: 5
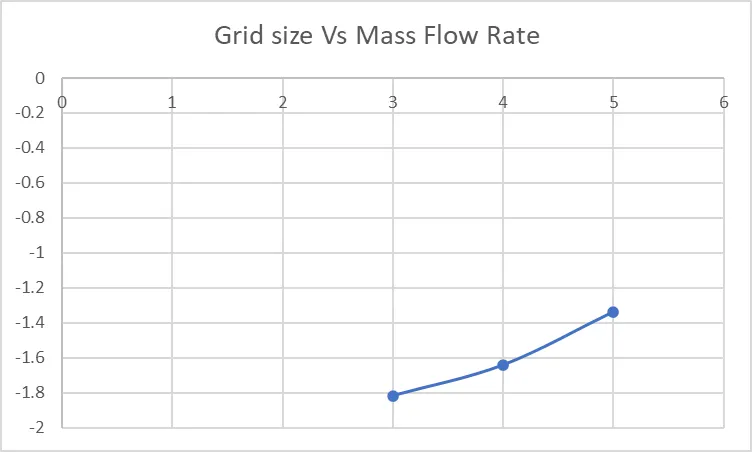
5.1 Graph
5.2. Conclusion:
- As we can see that the same inlet pressure, outlet pressure, and the valve lift of the velocity variations in the cut plot are different.
- As grid size increases mass flow rate and valve lift increased.
6. Valve Lift Test:
6.1 Parameters for Valve Lift Test:
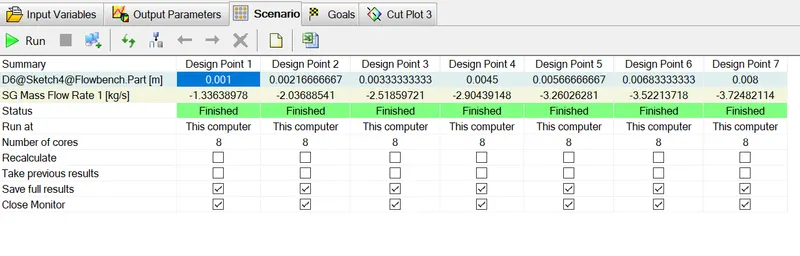
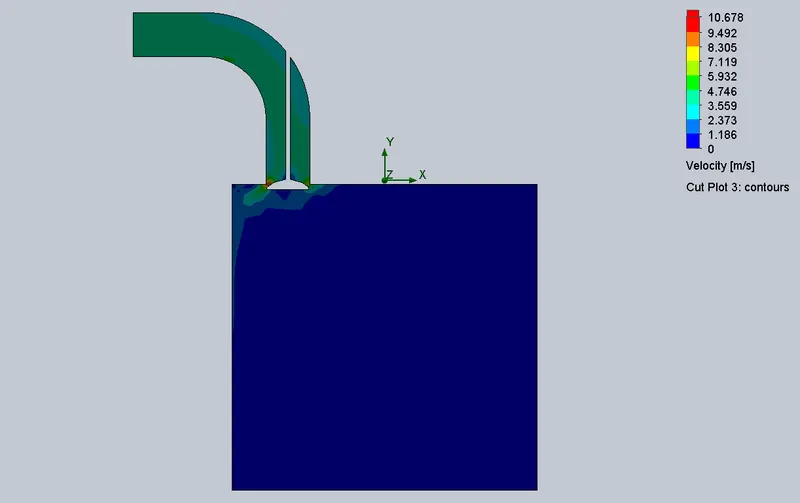
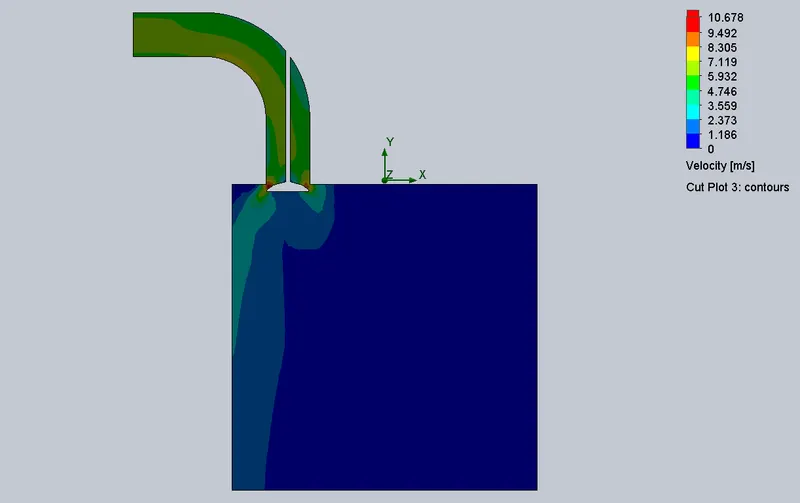
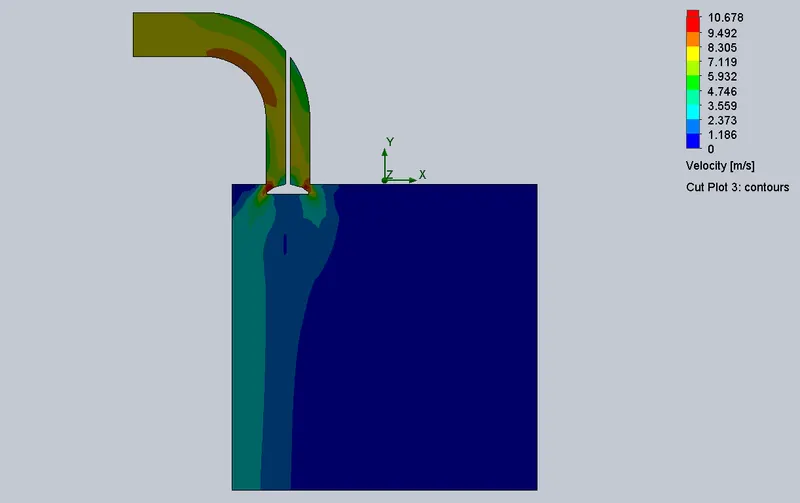
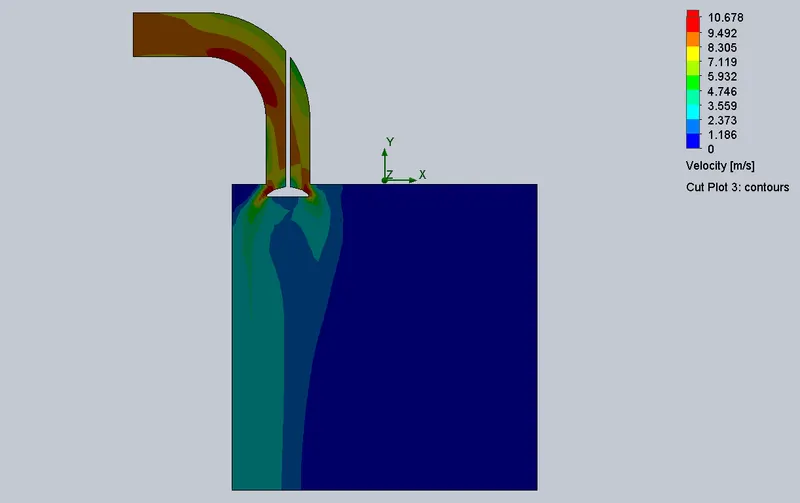
With a grid size of 5, now we can run a parametric study where we can change the valve lift from 0.001 to 0.008 with 7 intervals, the rest other parameters are kept the same one change that we need to local mesh for better results.
6.2 Results for Parametric study of valve lift:
- Valve lift at 0.001
Velocity Plot
- Valve lift at 0.00216666667
Velocity Plot
- Valve lift at 0.00333333333
Velocity Plot
- Valve lift at 0.0045
Velocity Plot
- Valve lift at 0.00566666667
Velocity Plot
- Valve lift at 0.00683333333
Velocity Plot
- Valve lift at 0.008
Velocity Plot
6.3 Graph
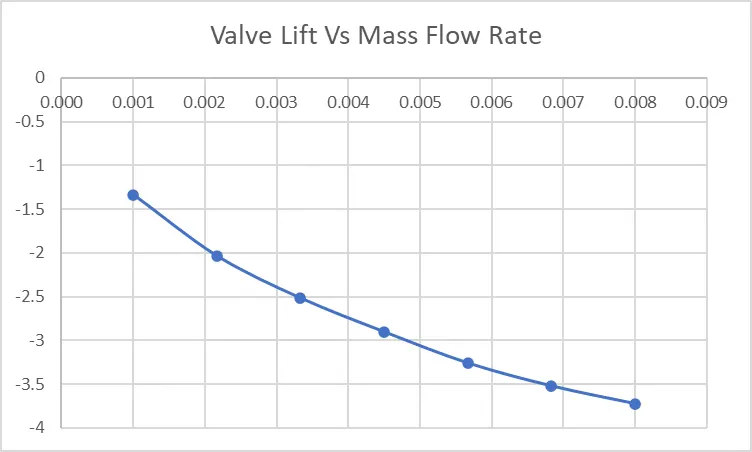
- Plot on Valve lift Vs Mass Flow Rate
| SL.No | Valve Lift | Mass Flow Rate |
| 1 | 0.001 | -1.3364 |
| 2 | 0.002 | -2.0369 |
| 3 | 0.003 | -2.5186 |
| 4 | 0.005 | -2.9044 |
| 5 | 0.006 | -3.2603 |
| 6 | 0.007 | -3.5221 |
| 7 | 0.008 | -3.7248 |
6.4 Conclusion:
- From the velocity plot, we can see that as the valve lift increase the velocity also increases.
- The mass flow rate reduces as the valve lift increases this is because of the resistance of the flow due to the attachment of the valve seat and valve head. As the valve lift continues to increase, a larger intake valve opening allows for a greater induction mass flow rate which causes the increase in discharge coefficient.
Here is the link of part model.
https://drive.google.com/drive/folders/1qSY2dWY12tpQ6mxDOsiZpaMdcGmHmyYO?usp=sharing