Flow over a cylinder
1. Aim
- Simulate the flow over a cylinder in which external simulation takes place.
- Run a baseline simulation and then calculate the Reynolds number. Then increase the number by 20%, 40%, and 100% then run the transient flow simulation.
- Animations of pressure-velocity for all three Reynolds numbers are created.
2. Introduction
Computational Fluid Dynamics
Computational Fluid Dynamics (CFD) analyzes fluid flows using numerical solution methods. Using CFD, you are able to analyze complex problems involving fluid-fluid, fluid-solid, or fluid-gas interaction. Engineering fields where CFD analyses are frequently used are for example aerodynamics and hydrodynamics, where quantities such as lift and drag or field properties such as pressures and velocities are obtained. Fluid dynamics is involved with physical laws in the form of partial differential equations. Sophisticated CFD solvers transform these laws into algebraical equations and are able to solve these equations numerically efficiently.
Reynolds Number:
Reynolds number is a dimensionless quantity that is used to determine the type of flow pattern as laminar or turbulent while flowing through a pipe. Reynolds number is defined by the ratio of inertial forces to that viscous forces.
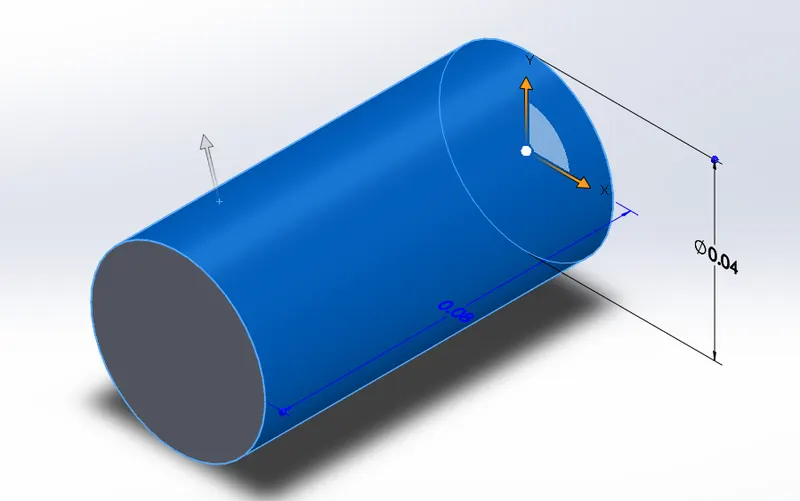
3. Model of a Cylinder
Diameter of the cylinder= 0.04m
Length of the cylinder= 0.08m
4. BaseLine Simulation Parameters:
As given that Re= 100 , should find the velocity
Re= rho*U_inlet*D/mu
where
Re= Reynolds number
D= Cylinder dia
mu= dynamic viscosity
rho= density
Re= 100
Cylinder dia= 0.04 m
Density= 1.225 kg/m^3
Dynamic viscosity= 18.4*10^-6 Ns/m^2
By substituting the above values
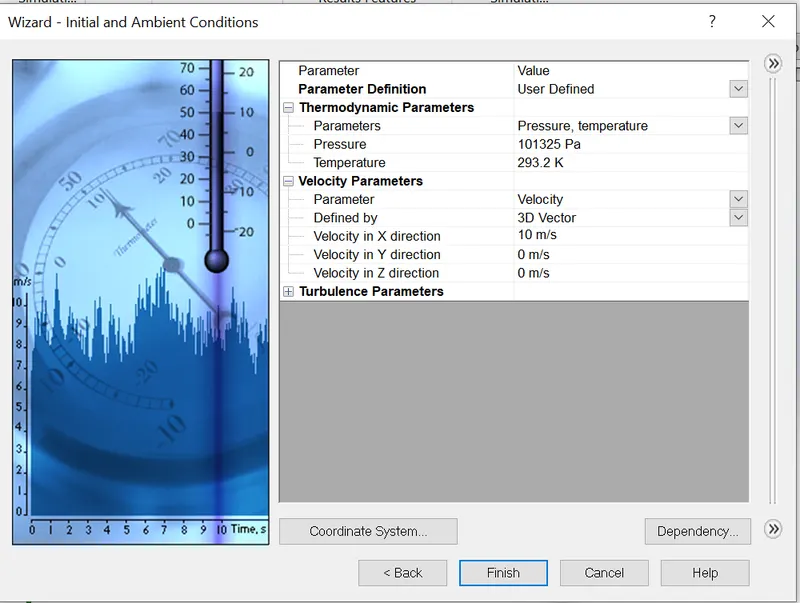
V1= 0.037 m/sec
Similarly Reynolds number at 20%, 40%, and 100%. Velocities are;
At 20% V2= 0.045 m/sec
At 40% V3= 0.052 m/sec
At 100% V4= 0.075 m/sec
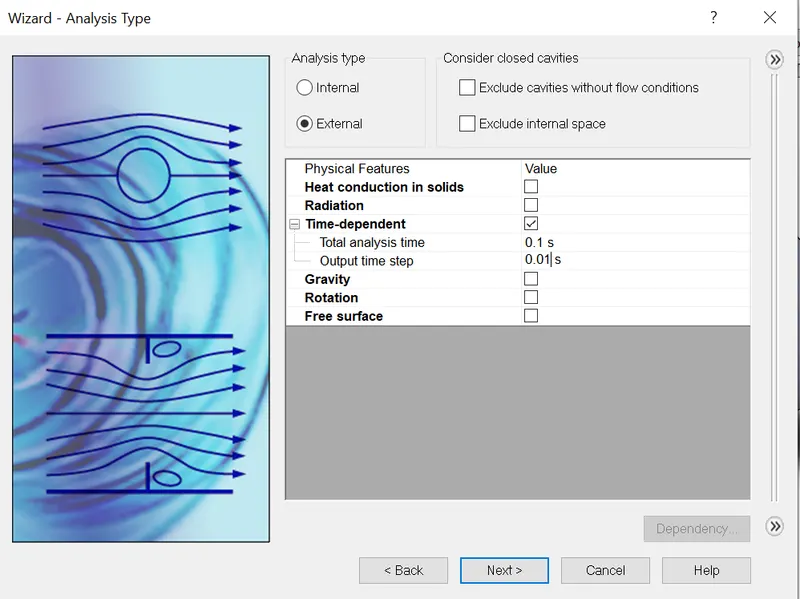
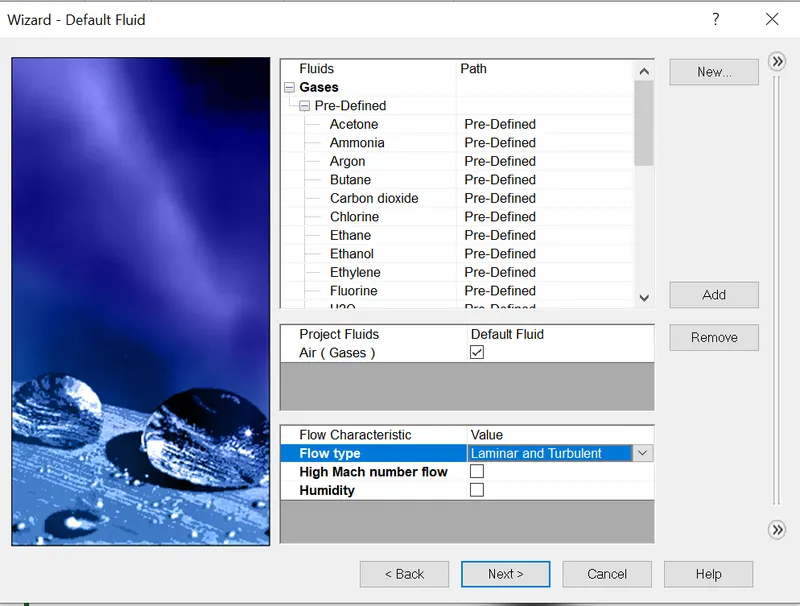
5. Input Conditions of Baseline Simulation
6. Results
Flow over a simulation at baseline Re=100; v= 0.037 m/s
- Cut plot of velocity contour
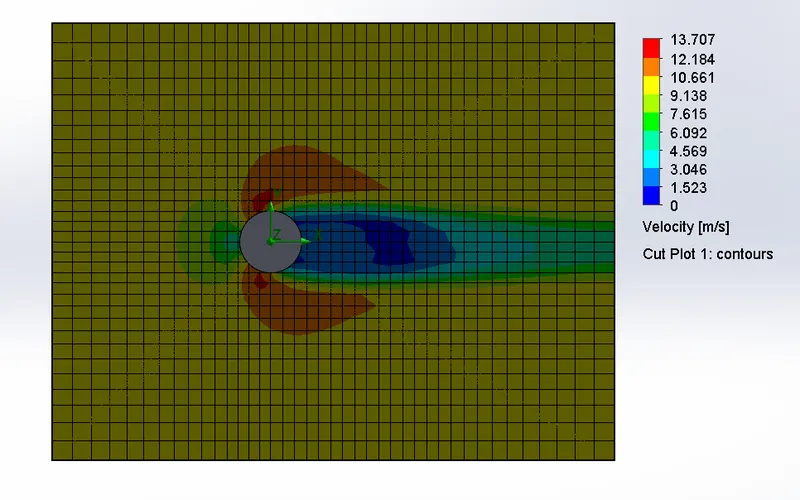
- Animation video link of v1= 0.037 m/sec; Re= 100
https://drive.google.com/drive/folders/1qSY2dWY12tpQ6mxDOsiZpaMdcGmHmyYO?usp=sharing
- Cut Plot for Pressure
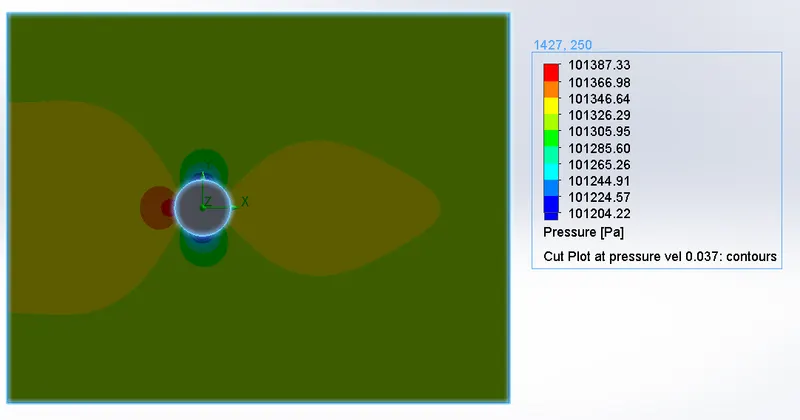
- Animation Video link of Pressure
https://drive.google.com/drive/folders/1qSY2dWY12tpQ6mxDOsiZpaMdcGmHmyYO?usp=sharing
Case 1: FLow over a cylinder at Re=120; v2= 0.045 m/s
- Cut Plot at Velocity Contour
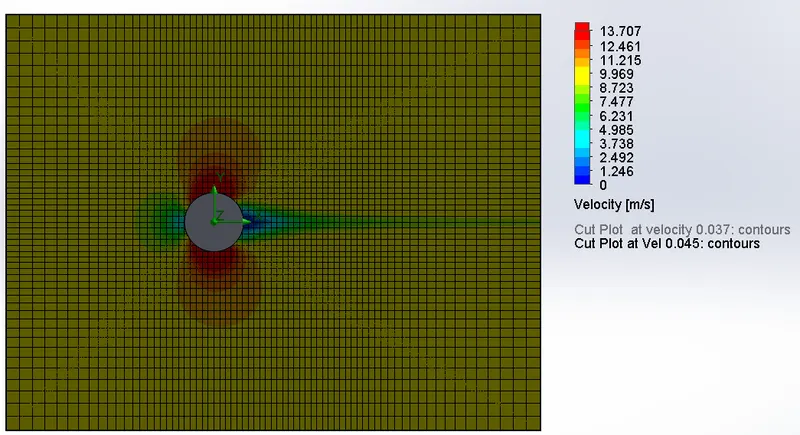
- Animation video link of v1= 0.045 m/sec; Re= 120
https://drive.google.com/drive/folders/1qSY2dWY12tpQ6mxDOsiZpaMdcGmHmyYO?usp=sharing
- Cut Plot for Pressure
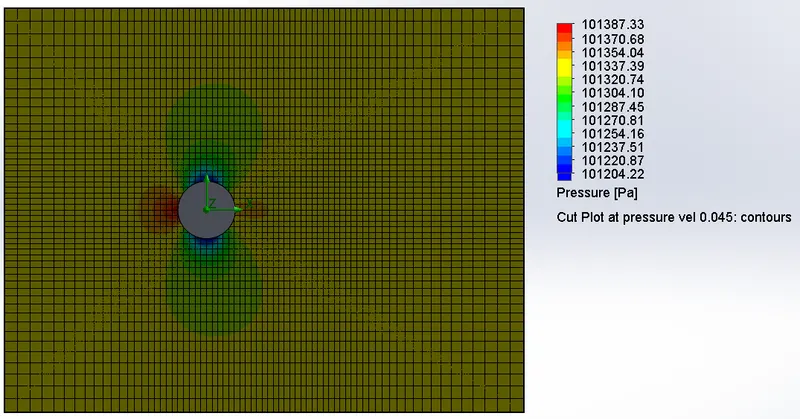
- Animation Video link of Pressure
https://drive.google.com/drive/folders/1qSY2dWY12tpQ6mxDOsiZpaMdcGmHmyYO?usp=sharing
Case 2: Flow over a cylinder at Re= 140; v3= 0.052 m/sec
- Cut Plot of Velocity Contour
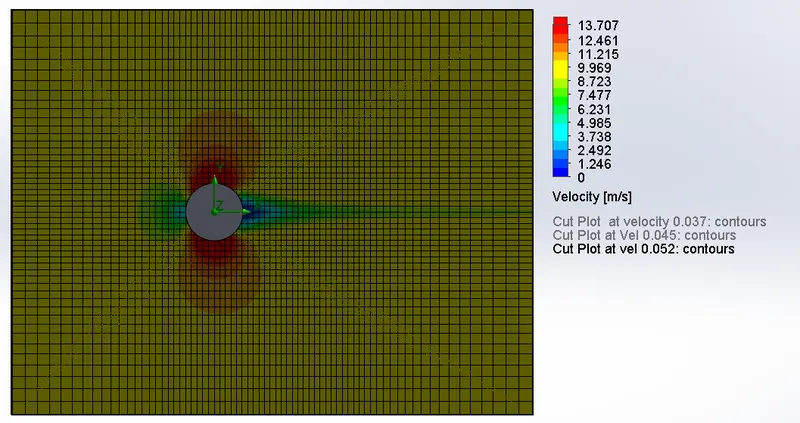
- Animation video link of v3= 0.052 m/sec; Re= 140
https://drive.google.com/drive/folders/1qSY2dWY12tpQ6mxDOsiZpaMdcGmHmyYO?usp=sharing
- Cut Plot for Pressure
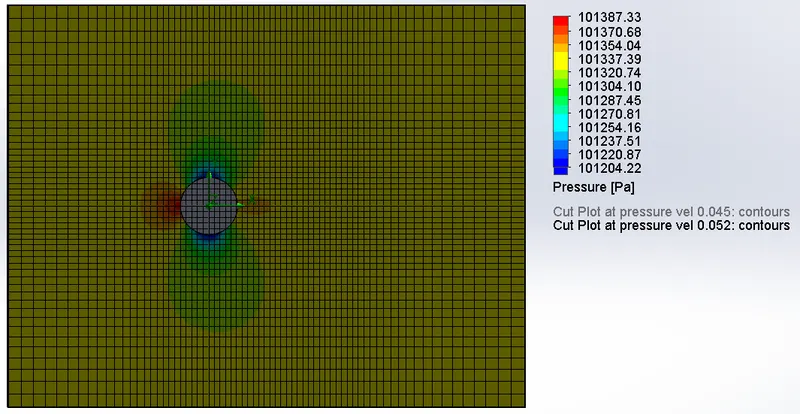
- Animation Video link of Pressure
https://drive.google.com/drive/folders/1qSY2dWY12tpQ6mxDOsiZpaMdcGmHmyYO?usp=sharing
Case 3: Flow over a cylinder at Re= 200; v3= 0.075 m/sec
- Cut Plot of Velocity Contour
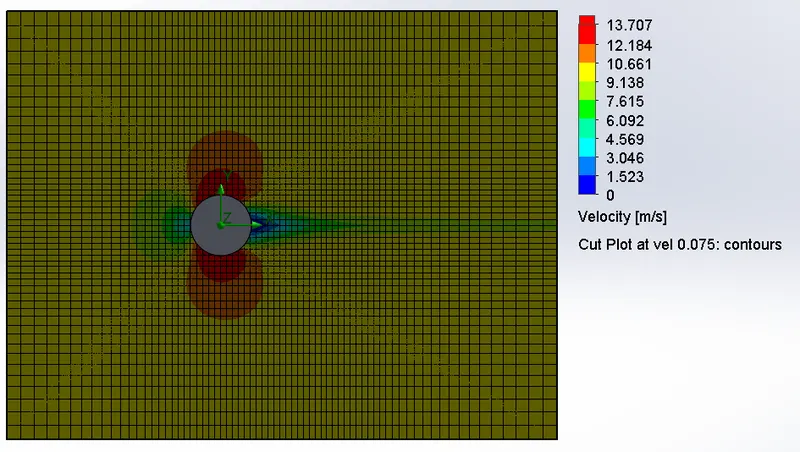
- Animation video link of v4= 0.075 m/sec; Re= 200
https://drive.google.com/drive/folders/1qSY2dWY12tpQ6mxDOsiZpaMdcGmHmyYO?usp=sharing
- Cut Plot for Pressure
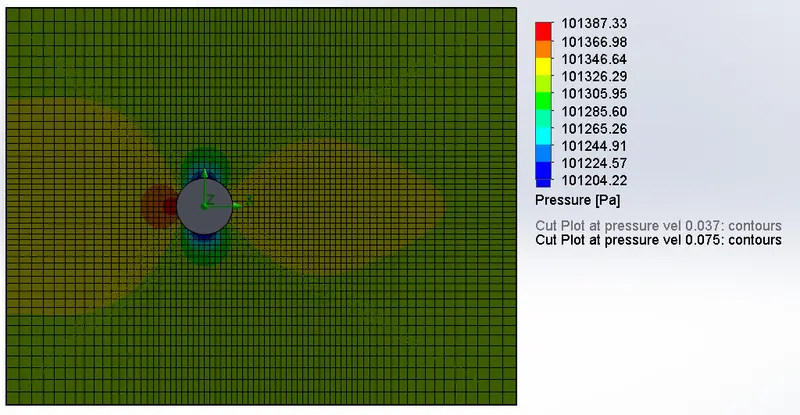
https://drive.google.com/drive/folders/1qSY2dWY12tpQ6mxDOsiZpaMdcGmHmyYO?usp=sharing
7. Conclusion
- As the Reynolds number increases the velocity decreases.
- As we can see the velocity plot remains the same in all three cases.
- Pressure plots for Re= 100 and Re= 200 looks same.