Modelling and simulation of flow through a flowbench
AIM:
The purpose of this analysis is to create a 3D model of a bench flow and find out the pressure loss and mass flow rate in intake port of cylinder head of IC engine for different valve lift using solidworks flow simulation.
INTRODUCTION:
Computational fluid dynamics (CFD) is a branch of fluid mechanics that uses numerical analysis and data structures to analyse and solve problems that involve fluid flows. Here solidworks flow simulation is an intuitive computational fluid dynamics (CFD) solution embedded within solidworks 3D CAD that enables you to quickly and easily simulate liquid and gas flows through and around your designs to calculate product performance and capabilities.
In automobile industries one of the major factor is pressure loss and mass flow rate during valve lift in IC engine. Also we can take the example from water line valve, gasoline valve, etc. so CFD is the best tool to analysis this qualities using prototype model which one is the future product to customers. So we are going to run this analysis using 3D model of IC engine intake port.
AIR BENCH FLOW:
It is a device used for testing the internal aerodynamic qualities of an engine component and is related to the more familiar wind tunnel. It is used primarily for testing the intake and exhaust ports of cylinder heads of internal combustion engines. It is also used to test the flow capabilities of any component such as air filters, carburetors, manifolds or any other part that is required to flow gas. A flow bench is one of the primary tools of high performance engine builders, and porting cylinder heads would be strictly hit or miss without it.
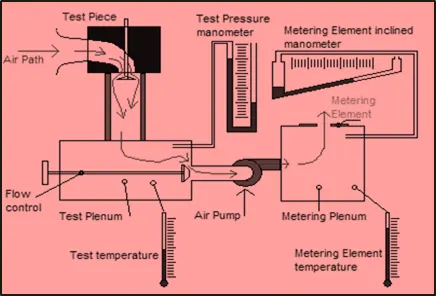
A flow bench consists of an air pump of some sort, a metering element, pressure and temperature measuring instruments such as manometers, and various controls. The test piece is attached in series with the pump and measuring element and air is pumped through the whole system. Therefore, all the air passing through the metering element also passes through the test piece. Because the volume flow rate through the metering element is known and the flow through the test piece is the same, it is also known. The mass flow rate can be calculated using the known pressure and temperature data to calculate air densities, and multiplying by the volume flow rate.
THEORY:
The air flow bench can give a wealth of data about the characteristics of a cylinder head or whatever part is tested. The result of main interest is bulk flow. It is the volume of air that flows through the port in a given time. Expressed in cubic feet per minute or cubic meters per second/minute.
Valve lift can be expressed as an actual dimension in decimal inches or mm. It can also be specified as a ratio between a characteristic diameter and the lift L/D. Most often used is the valve head diameter. Normally engines have an L/D ratio from 0 up to a maximum of 0.35. For example, a 1-inch-diameter (25 mm) valve would be lifted a maximum of 0.350 inch. During flow testing the valve would be set at L/D 0.05 0.1 0.15 0.2 0.25 0.3 and readings taken successively. This allows the comparison of efficiencies of ports with other valve sizes, as the valve lift is proportional rather than absolute.
In most flows of liquids, and of gases at low mach number, the density of a fluid parcel can be considered to be constant, regardless of pressure variations in the flow. Therefore, the fluid can be considered to be incompressible and these flows are called incompressible flows. Bernoulli performed his experiments on liquids, so his equation in its original form is valid only for incompressible flow. A common form of Bernoulli's equation, valid at any arbitrary point along a streamline, is:

where:
- Vis the fluid flow speed at a point on a streamline,
- gis the acceleration duo to gravity,
- his the elevation of the point above a reference plane
- pis the pressure at the chosen point, and
- ρis the density of the fluid at all points in the fluid.

Here I have used this equation and formula to calculate both the inlet pressure and outlet pressure as well. The fluid velocity to be assumed as 350m/s to calculate the dynamic pressure.
FLOW SIMULATION SETUP:
Open the solidworks part file, and then start the 3D design of a bench flow for intake port of a cylinder head. Finally save your design and using lids close both the flow inlet and outlet. After that follow the following condition to run the simulation process properly.
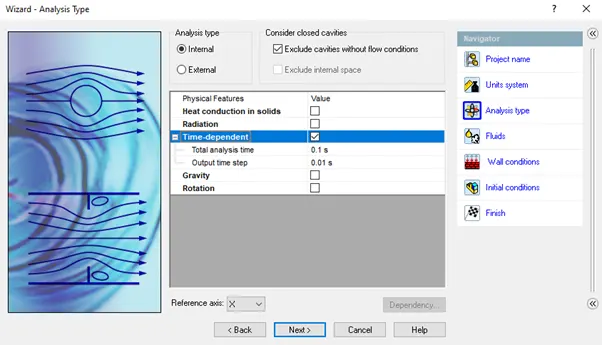
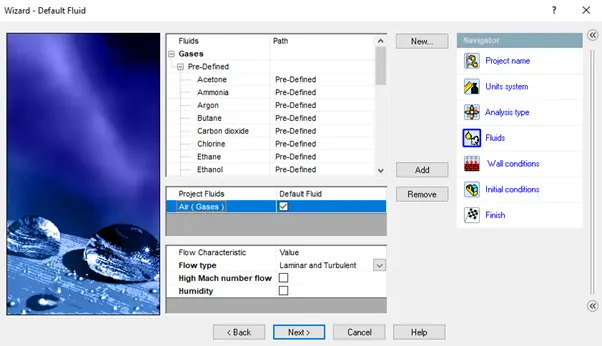
i)Initial Conditions: Create the new flow simulation using the wizard comment. Here I had given project name, analysis type, fluid, wall conditions and initial conditions. This mentioned parameters are the input value to start the simulation process, because our result is based on that. I used time dependent for 0.1s analysis time because the process is infinity over the time.
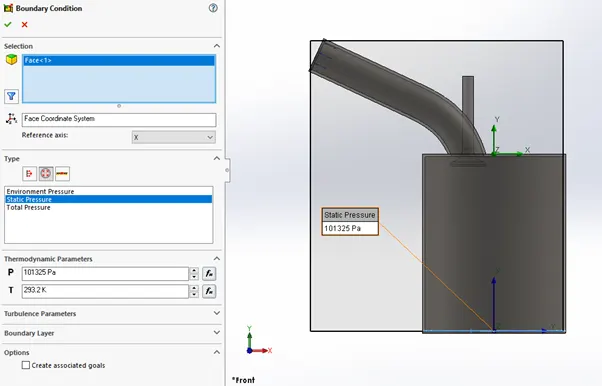
ii)boundary condition: I have assigned the inlet flow as total pressure opening and its value was calculated from Bernoulli’s equation is 175000bar approximate valve. Also the outflow as static pressure opening and it was taken as 1bar pressure that is air pressure in surrounding.
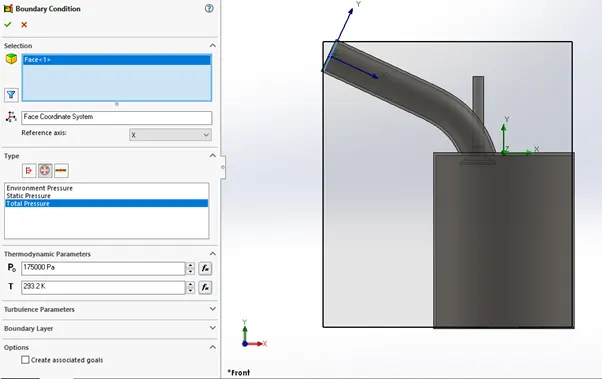
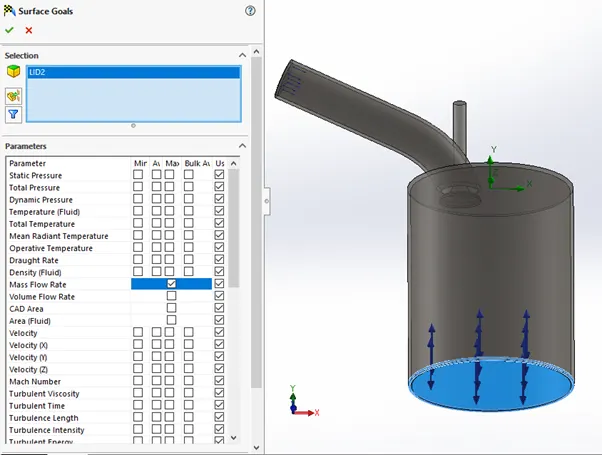
iii)goal: we can insert the five types of goals based on which type of result you want. So here I have taken the surface goal for mass flow rate in outlet. Mass flow rate is one of the factor to identifying the maximum valve lift during suction stroke in IC engine.
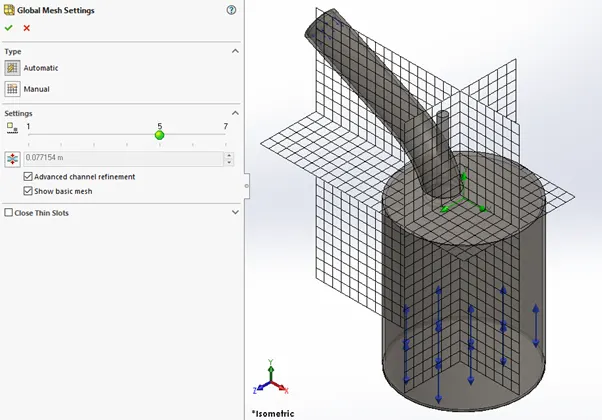
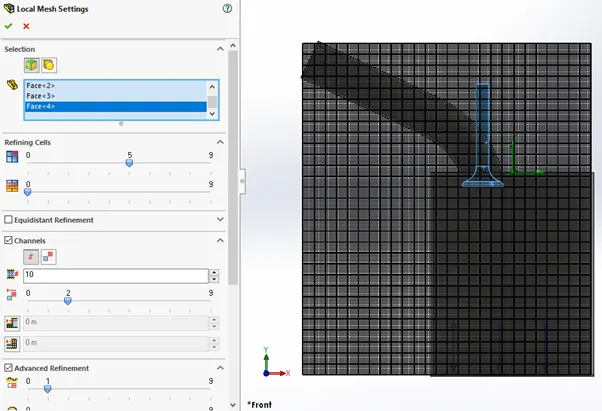
iv)mesh: The process of subdividing the model into small pieces is called meshing. In solidworks the mesh is create automatically with recommended value. If you increase it then the result will come up with more precious. We have two type of meshing one is automatic and another one is manual. Here I have given the local mesh on valve because the pressure loss will develop there.
GRID DEPENDENCE TEST:
A mesh is a representation of a larger geometric domain by smaller discrete cells. Meshes are commonly used to compute solutions of partial differential equations and render computer graphics, and to analyze geographical and cartographic data. A mesh partitions space into elements (or cells or zones) over which the equations can be solved, which then approximates the solution over the larger domain. Element boundaries may be constrained to lie on internal or external boundaries within a model. Higher-quality (better-shaped) elements have better numerical properties, where what constitutes a "better" element depends on the general governing equations and the particular solution to the model instance.
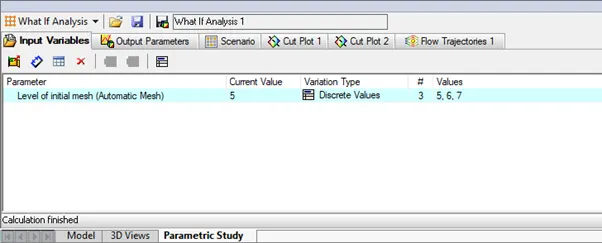
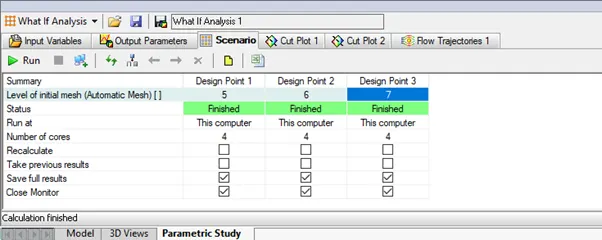
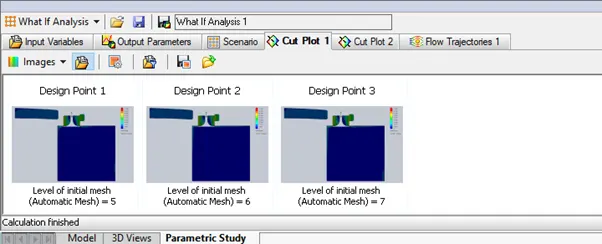
The grid dependence test is a process used to find the optimal grid condition that has the smallest number of grids without generating a difference in the numerical results based on the evaluation of various grid conditions. In solidworks flow simulation the recommended refining cells is 9 in local mesh and 7 in global mesh. So I have used 5, 6, and 7 to find out the best one because larger the grid number that the result will take more time to finish the analysis. For this project I selected no 5 based on my system performance.
EFFECT OF VALVE LIFT:
Based on my design geometry I chosen the valve lift 0.01 to 0.08 for eight divisions. Then I started the parametric study for mass flow rate, velocity plot and pressure plot. Here that results are:
mass flow rate

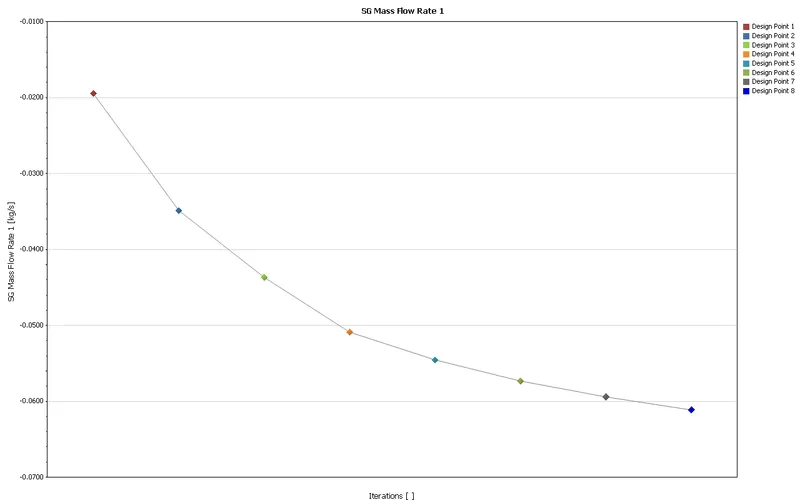
Here we see clearly how that mass flow rate gradually increases based on valve lift range from 0.001m to 0.008m. But the values are goes in negative. And in starting stage it is increased by maximum as well as in final stage it is gragually reduced. so it indicates that the maximum valve lift going to reach.
pressure loss
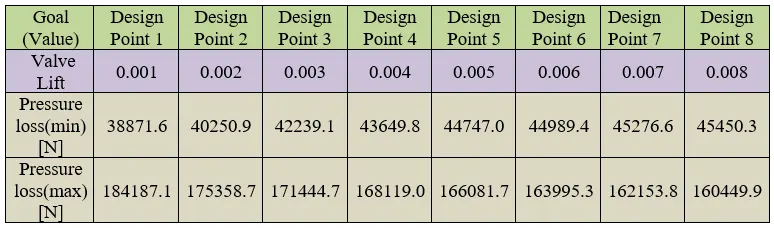
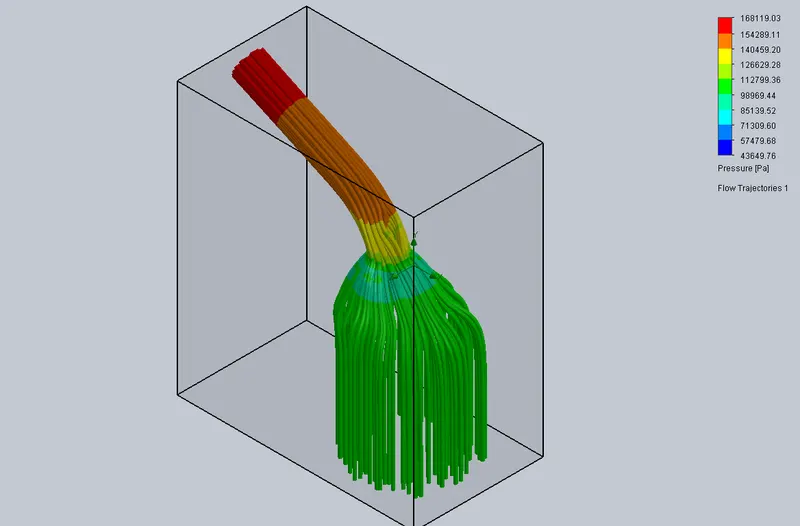
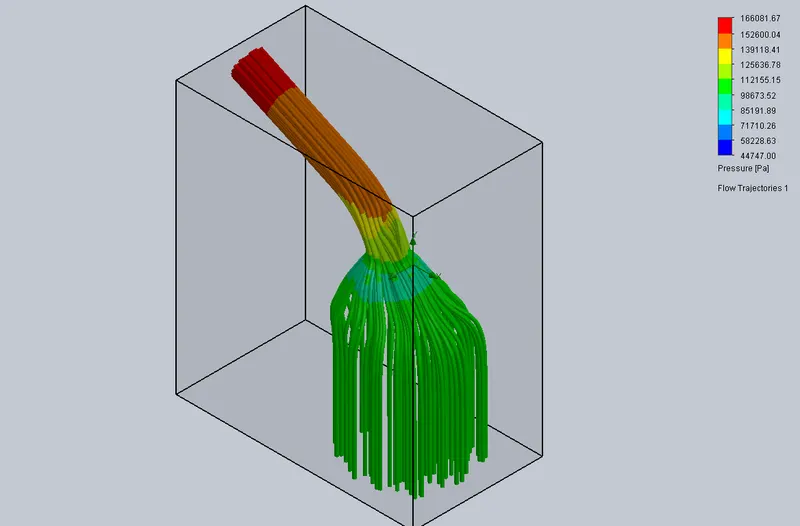
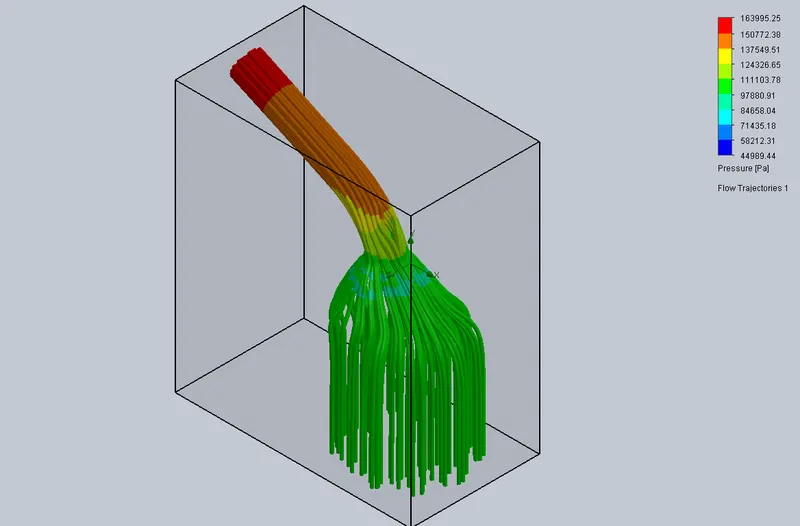
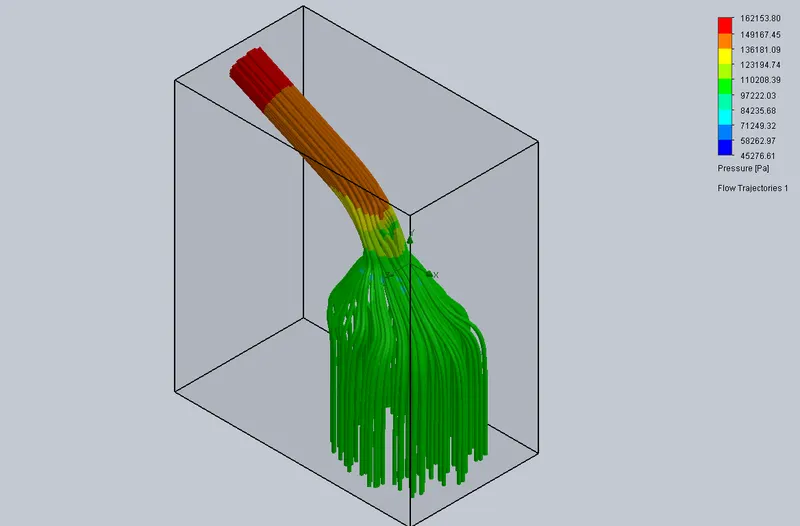
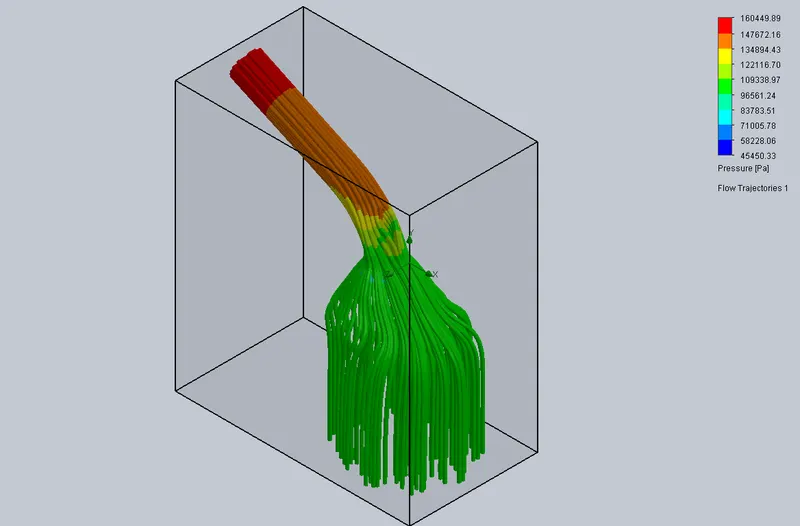
In pressure plot the minimum values are increased because of working object design. That the manifold was designed in incliend but the valve in straight, so the minimum pressure was raising on valve lift fillet area. But the maximum pressure was decreased based on valve lift, so here that pressure loss is find out successfully.
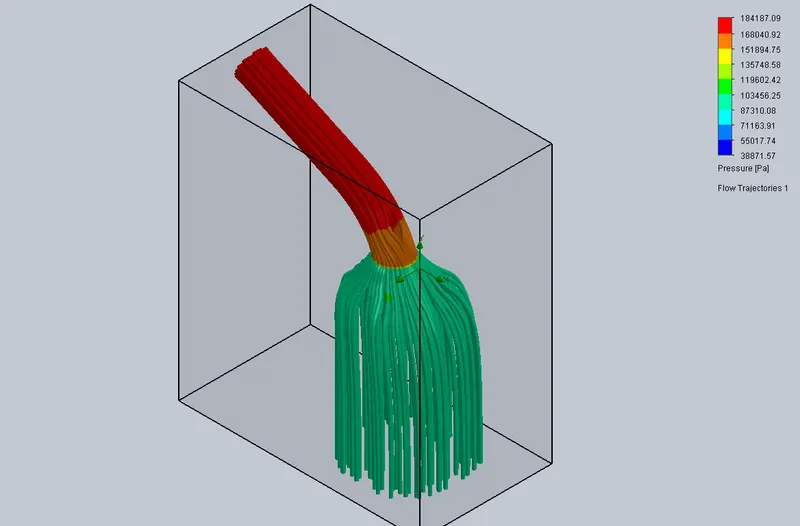
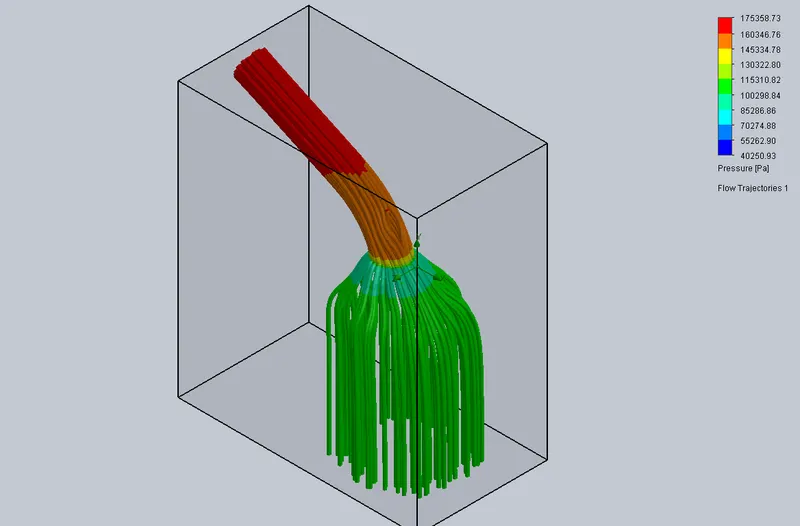
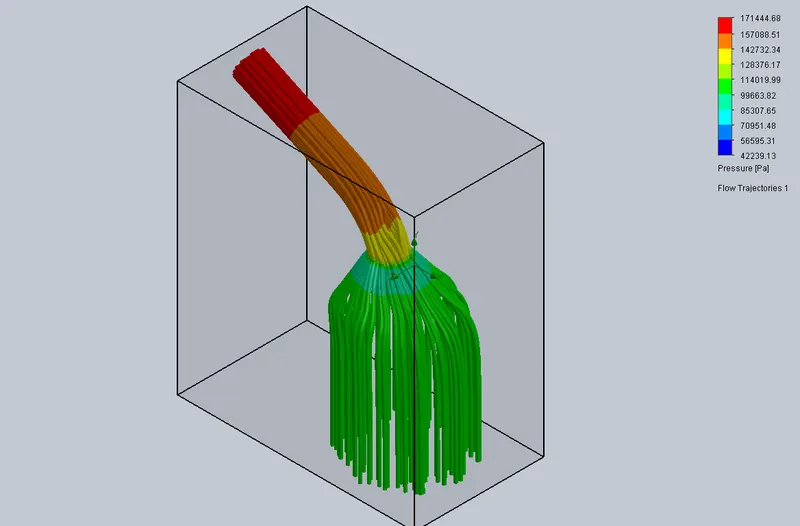
The following flow trajectories are shown how that pressure loss was occured. In inlet the maximum pressure gradually reduced and in outlet its increased.
CONCLUSION:
Using flow simulation from solidworks the modelling and simulation of flow through a flowbench was finished. But it is not a actual values on running IC engines, it is a approximate values used to develop a prototypes and identifying the problems as well as possible.