Modelling and simulation of Air flow through a flow-bench using SolidWorks.
Aim
To create a 3D model of a flow bench and run flow analysis.
- Grid dependence test
- For three grids run the simulation at a particular valve lift.
- To examin the Velocity and pressure distribution in the flow bench.
- Effect of valve lift on mass flow rate
- Run a parametric sweep to show the effect of valve lift on mass flow rate.
- To obtaining a plot of lift vs mass flow rate.
Introduction
Automotive industry today is grappling with two major challenges, continuous increase in fuel prices and restricted emission regulations. Therefore, the automotive industry has put extensive focus in assessing air flow during the intake stroke and air flow within the cylinder as it is generally accepted that it has significant effect on the in-cylinder mixture preparation and hence the combustion performance. Large scale flow structures such as swirl and tumble increase the level of turbulence at the time of ignition which, in turn, strongly affect both pollutant emissions and fuel efficiency since turbulence helps in achieving complete combustion.
One of the ways to evaluate the air flow in cylinder head is to make use of an air Flow bench.
An air flow bench is a device that measures the volume or mass of air that will pass through a bounded path or conduit in relation to an applied pressure differential.
The pressure differential is usually relative to ambient air pressure and is often produced by some mechanical means such as an electric blower or at least one electric vacuum motor. The flow bench air source creates a pressure differential across the test object that causes air to flow through not only the test object but through the entire flow bench.
At some point in the flow bench the air flow velocity is measured. From the measured air velocity, the volume or mass of air that is flowing through the test object can be calculated.
A flow bench with an air source that can apply a pressure differential to the object being flow tested is referred to as an active flow bench.
A passive flow bench has no air source, the object being tested supplies its own pressure differential to promote measurable air flow, such objects would be electric blowers or fans and vacuum motors.
Early flow benches were mostly used to test aircraft carburettors. Today, flow benches are not only used for flow testing internal combustion engine cylinder heads, but also many other items like carburettors, intake manifolds, exhaust manifolds, turbocharger housings, air filters, pneumatic couplings and fittings, AC grills and condensers, and nozzles of different types often find their way onto a flow bench.
The pressure differential applied to the test object is important to know since air flow is relative to the applied pressure differential. This pressure is usually measured in Inches of Water Column, or "wc.
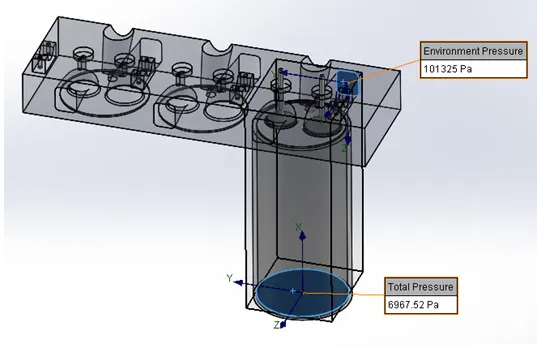
28"wc is about 1 PSI (Pounds per Square Inch) pressure. Internal combustion engine parts are often flow tested at 28"wc or 6967.52 Pa (approx. 7 kPa).
Air flow through a bounded path or conduit is often measured as a volume of Cubic Feet per Minute (CFM) or meter cube per second (in SI unit).
Example of a flow bench.
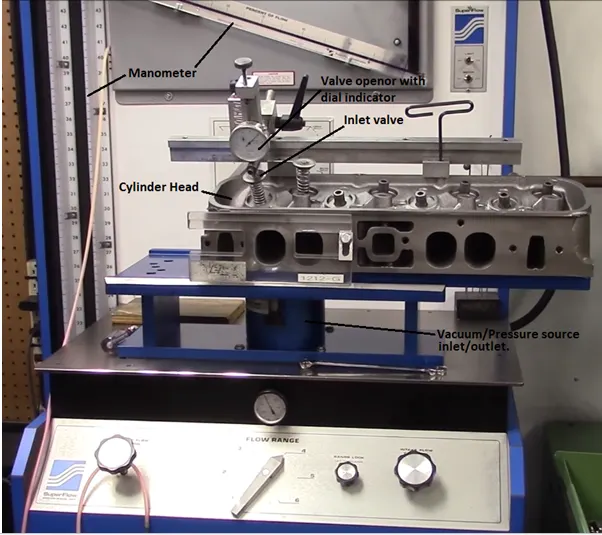
Flow through cylinder head largely depends on inlet and exhaust Valve.
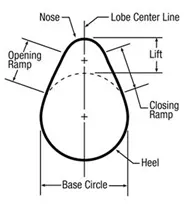
The opening and closing rates and lift at the valve depends on:
- The Cam Lobe
- Rocker arm ratios
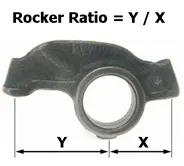
Higher rocker arm ratios will amplify the opening and closing rates and lift at the valve.
- Valve Spring
Hence, total valve lift then becomes Maximum lift by cam lobe times rocker ratio.
For simplicity of the project, we will consider maximum valve lift as 12% of cylinder bore (Diameter) i.e., 12% of 127mm = 15.24 mm or 15mm, simply.
Steps Taken:
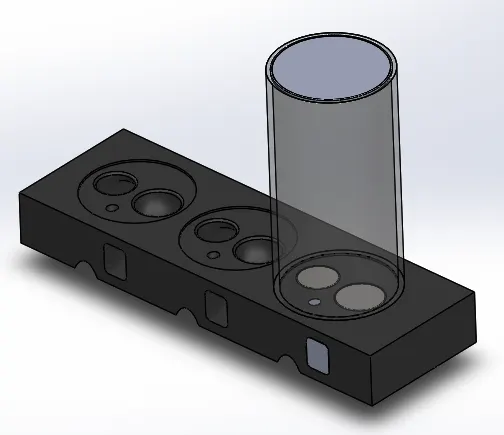
- Model and dimensions of an engine cylinder block:
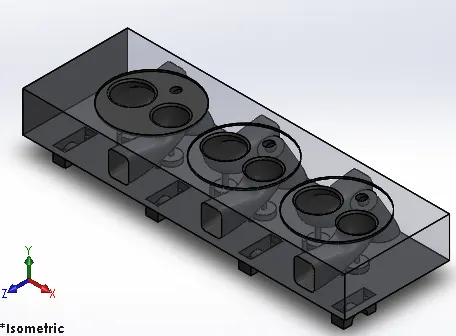
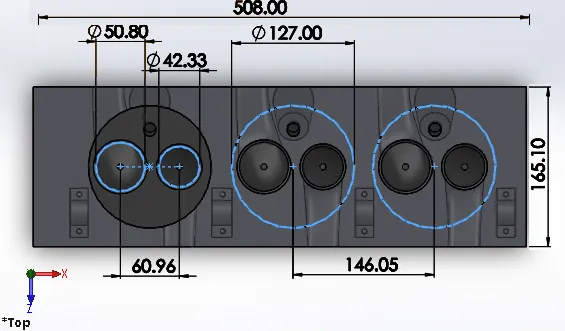
Dimensions = 508 x 165.10 x 63.50
Inlet Valve and exhaust valve:
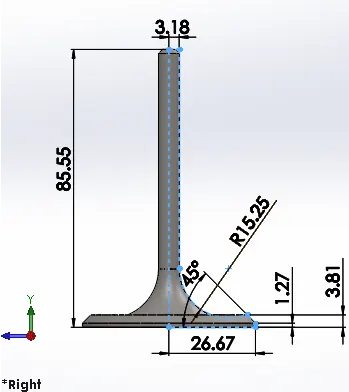
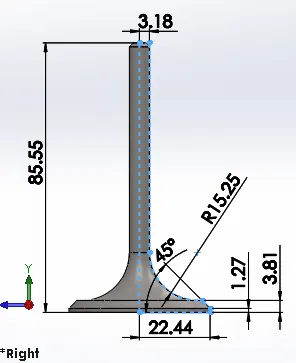
Cylinder:
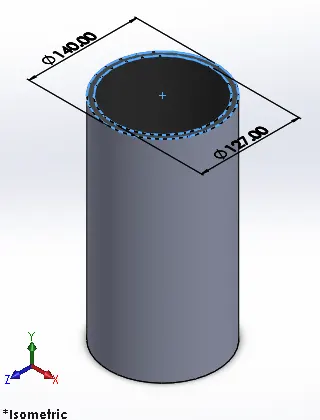
Length = 275mm
Flow Simulation:
- Creat Lids:
Create lids on all the required openings and deleate extra lids.
- Setting up Flow Wizard:
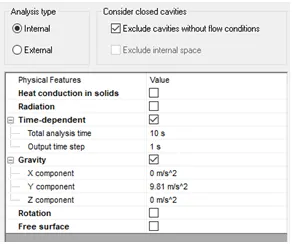
Selecting SI unit system.
Note: The Cylinder head is placed upside down in flow bench. Hence, gravity is +9.81m/s^2 in y-axis.
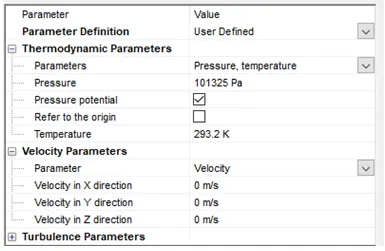
Chosing working fluid as air.
- Applying Boundary Conditions:
- Setting Goals:
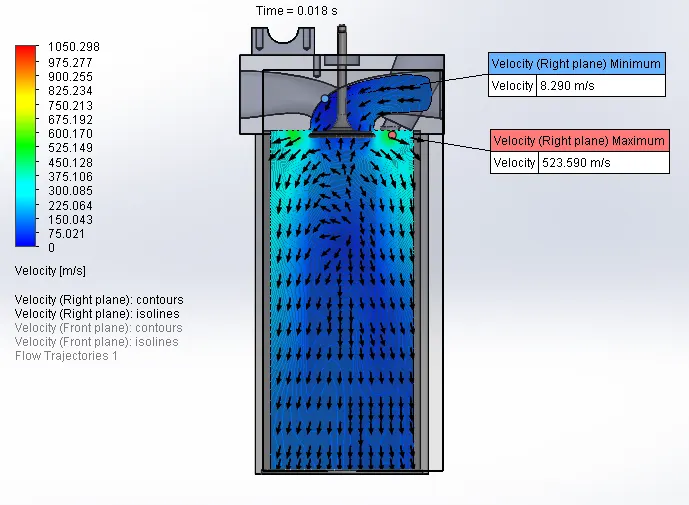
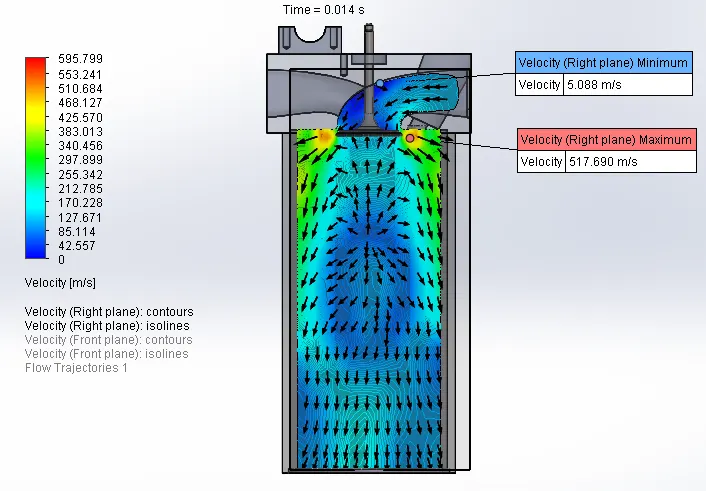
Grid dependency test (for valve lift 5mm):
For level of initial mesh = 3
For level of initial mesh = 4
For level of initial mesh = 5
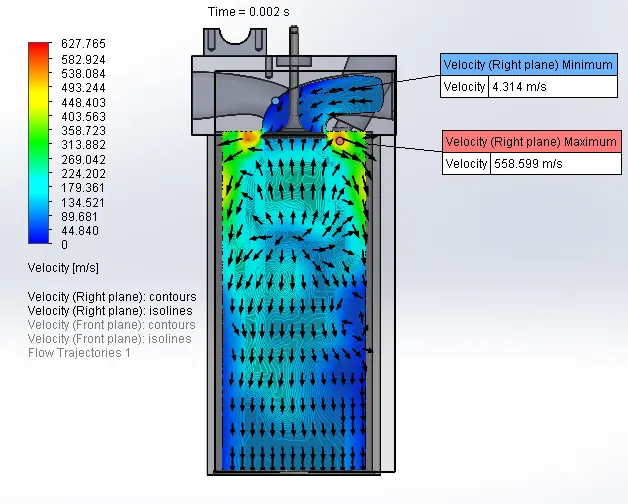
It is clear from above test that for mesh level 5, the variation of flow velocity in cut plot is depicted better than the previous two cases i.e., level 4 and 3 mesh size. So, mesh size 5, is more preferable for this study. But it will significantly increase the computational time. Hence, we will go ahead with default mesh size of 3.
Results:
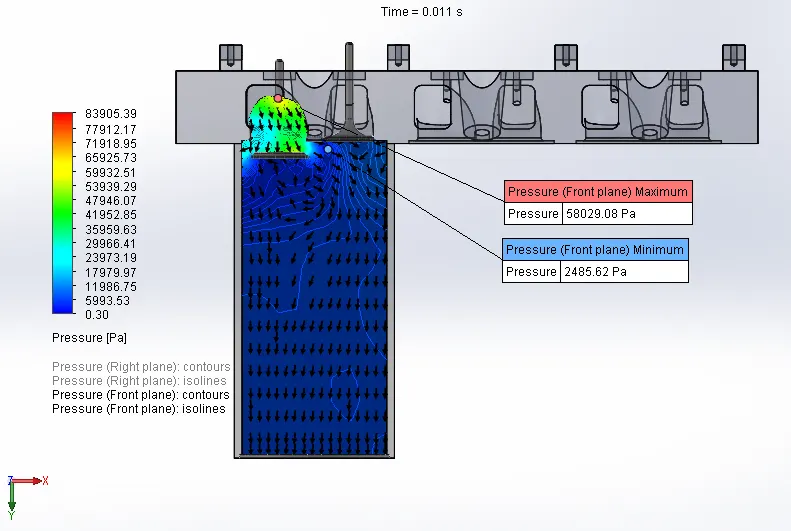
- At valve lift 0mm:
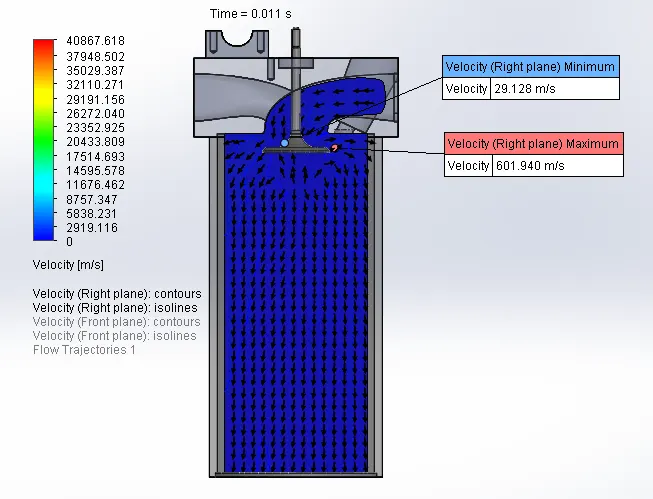
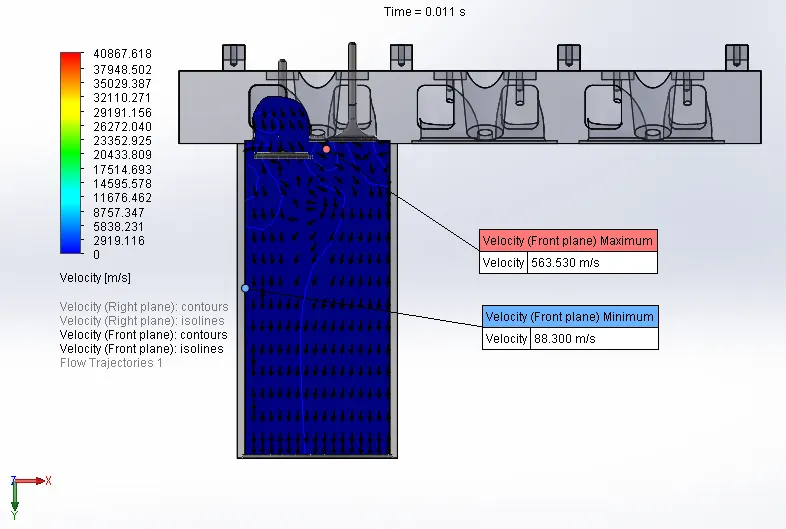
Pressure and Velocity cut plot at Right and Front plane:
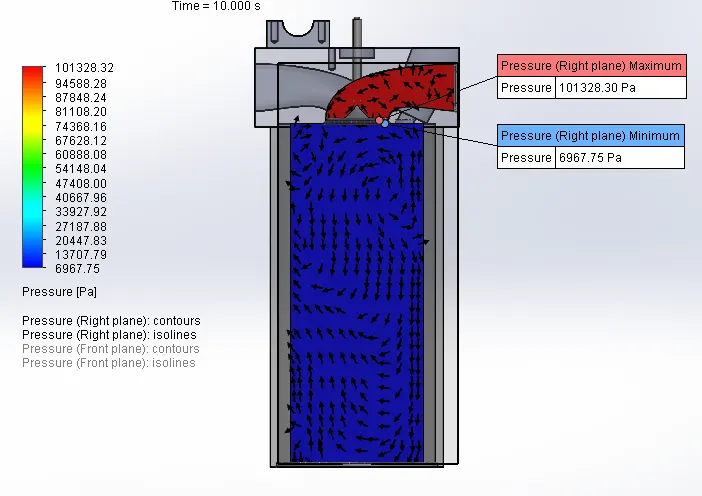
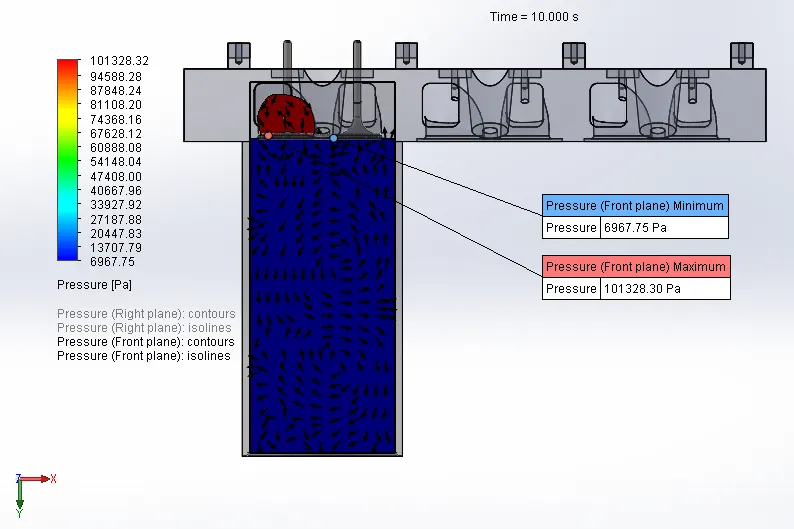
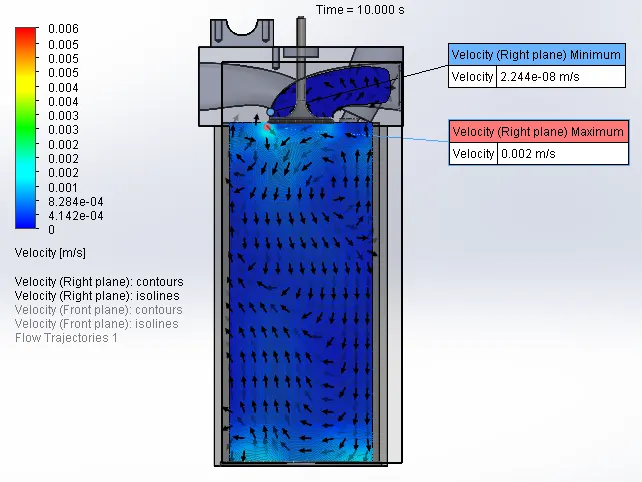
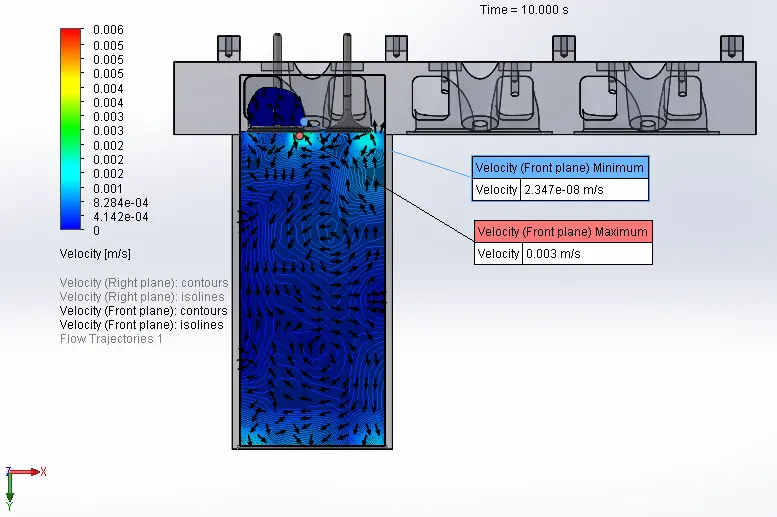
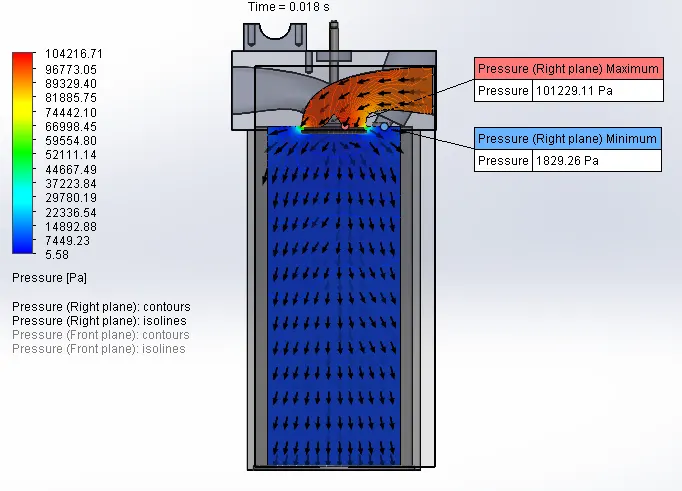
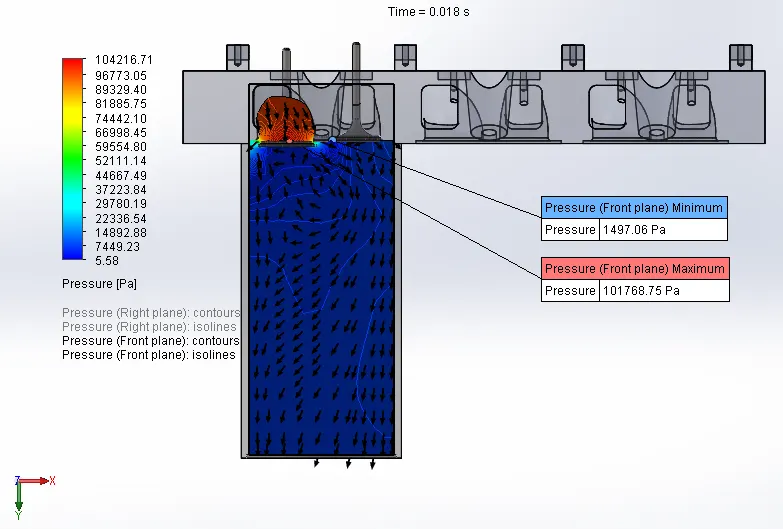
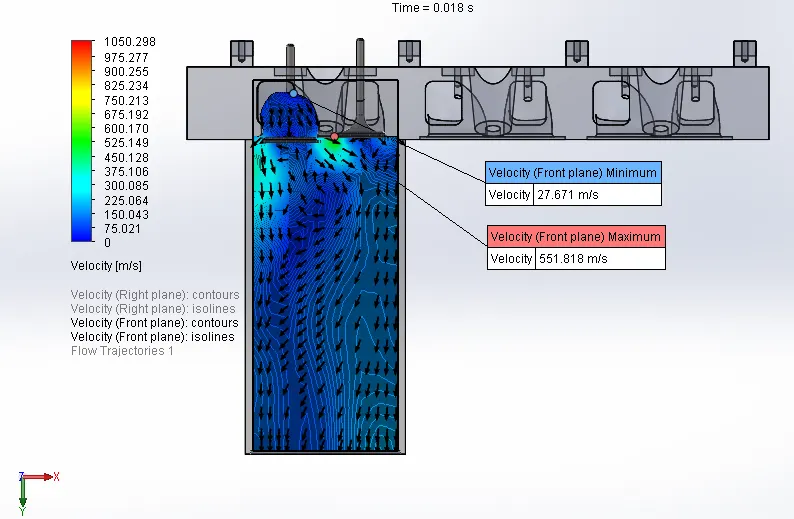
At valve lift 5mm:
Pressure and Velocity cut plot at Right and Front plane:
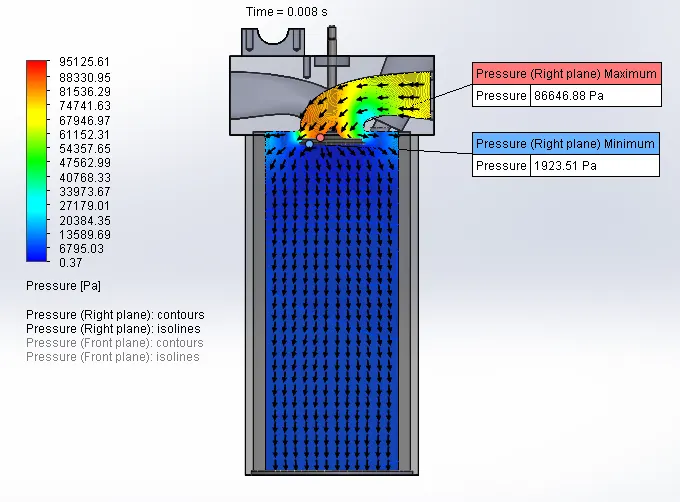
- At valve lift 10mm:
Pressure and Velocity cut plot at Right and Front plane:
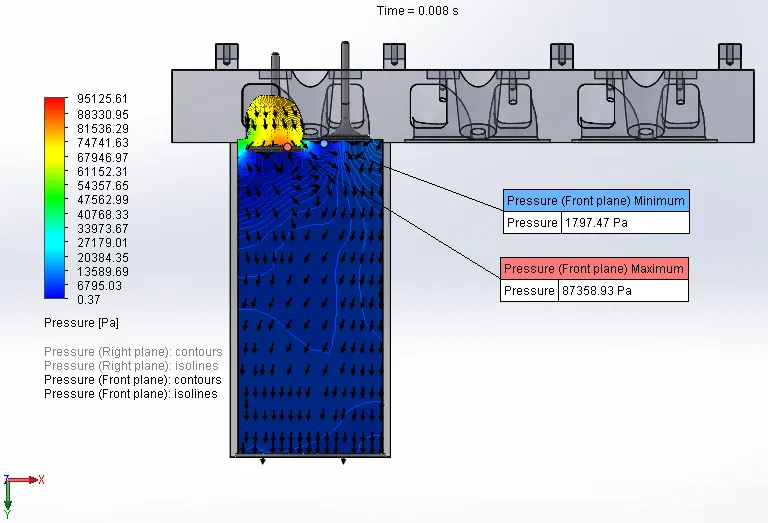
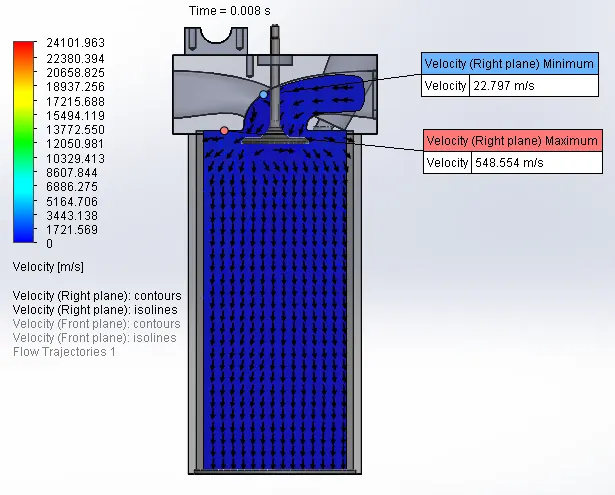
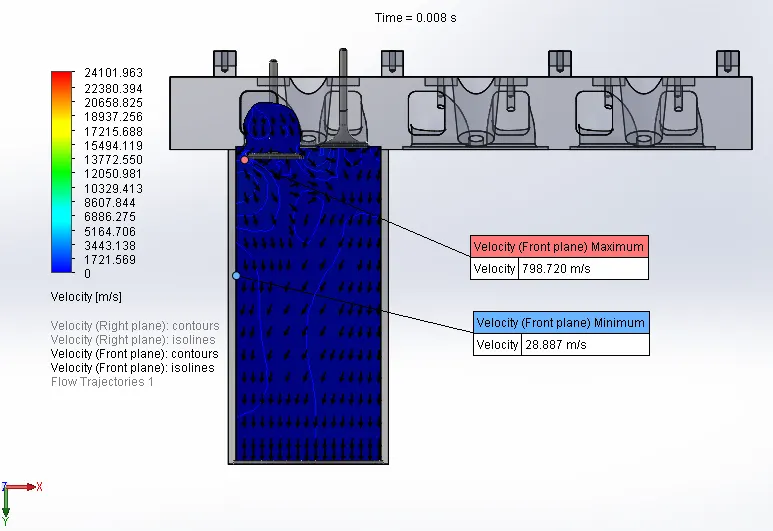
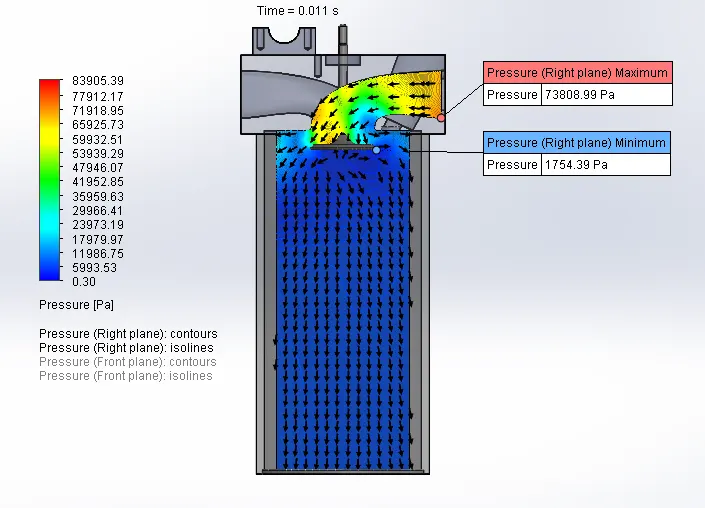
- At valve lift 15mm:
Pressure and Velocity cut plot at Right and Front plane:
Observation:
At 0mm valve lift
Since, the valve is closed there is no air flow through the valve. The flow can only happen because of any leakage in this case.
At 5mm valve lift
As the valve opens, due to pressure difference the air starts to move into the cylinder through the inlet valve. Since the opening is small the passage acts like a nozzle. Hence the flow rate at the constriction increases while the pressure decreases. We can also observe from front plane velocity-plot there is a vortex flow in clock wise direction on the right-hand side. This will provide air some swirl so that the air will mix well with the fuel.
At 10mm valve lift
With further increase in valve lift the, the size of constriction increases hence pressure increases and flow velocity decreases (compare to previous cases).
There are two swirl flows in this case (see Front plane plot) i.e., in clockwise direction on right-hand side and anticlockwise on the left-hand side. This will increase the flow turbulence further, which is beneficial for air-fuel mixing.
And as we move further along the length of the cylinder, we find that the flow becomes more streamline as the swirl dissipate their energy due to friction and collision with opposite circulation.
At 15mm valve lift
On further increasing the valve lift there is no positive gain in mass flow rate of air and the strength of vortex circulation of inlet air will also reduce.
Flow Rate Data Table:
|
S. No. |
Valve lift |
Mass Flow Rate [kg/s] |
Volume Flow Rate [m^3/s] |
|
1. |
0mm |
6.72931124286292E-13 |
3.27787287502791E-10 |
|
2. |
5mm |
0.0023 |
1.4871 |
|
3. |
7mm |
0.0103 |
1.9287 |
|
4. |
10mm |
0.022 |
2.5401 |
|
5. |
13mm |
0.0081 |
2.5055 |
|
6. |
15mm |
0.00133 |
2.5707 |
Graph:
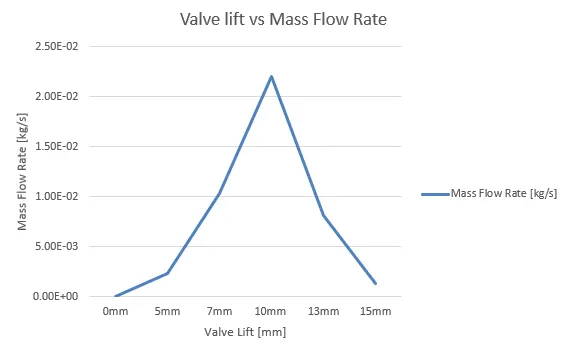
It can be seen from the graph that Flow rate of air increases with increase in valve lift. But after 10mm valve lift the flow rate starts to decrease. This can be explained through, Bernoulli’s principle, i.e., along a stream line at any two given points the pressure head, kinetic head and potential head remains constant. By assuming potential head constant in this case, we will find that, for a given pressure difference, as the valve lift increases form zero mm, the kinetic head increases and pressure head decreases at the constriction or passage. On increasing the lift further, after a certain lift value (10mm in this case), the kinetic head near the constriction starts to reduces and becomes less in comparison to previous lift values. The kinetic head loss is compensated with increase in pressure head near constriction.
This reduced mass flow rate will result in reduced vorticity (swirl and tumble) of the flow, which is often undesirable as more vorticity means more air turbulence. Turbulence help in thorough mixing of air with fuel, increases heat transfer rate and atomization & vaporization of fuel. Which ultimately leads to complete combustion and reduced emissions.
So, to enhance the air flow capacity we have to make sure the air does not encounter sharp turn or corners and follow a smooth passage during its journey, this can be achieved through porting. Or instead of using natural aspiration method for our engine, we could use turbo chargers which will force the air into the cylinder, increasing the pressure difference.
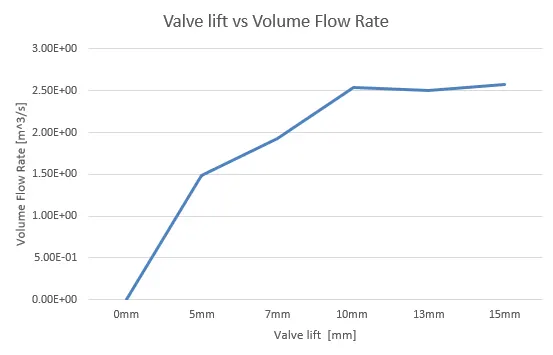
In general, as can be seen from the graph, air volume flow rate increased as the valve lift increases. But after 10mm of valve lift, the flow rate tends to become constant and may drop on increasing lift further. The reason of this is explained in previous paragraph.
References:
http://www.flowperformance.com/flowbench.html
Performance Engine Building 201