Gate Valve Parametric Study
Aim: To perform a parametric study on the gate valve simulation by setting the opening from 10% to 70%.
Objective:
- Obtain the mass flow rates at the outlet for each design point.
- Calculate the flow coefficient and flow factor for each opening and plot the graph.
- Discuss the results of the mass flow rate and flow coefficient.
Introduction:
A gate valve, also known as a sluice valve is a valve that opens by lifting a barrier (gate) out of the path of the fluid. Gate valves require very little space along the pipe axis and hardly restrict the flow of fluid when the gate is fully opened.
Gate valves are designed for fully open or fully closed service. They are installed in pipelines as isolating valves, and should not be used as a control or regulating valves. The operation of a gate valve is performed doing an either clockwise to close or clockwise to open the rotating motion of the stem.
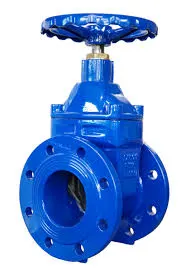
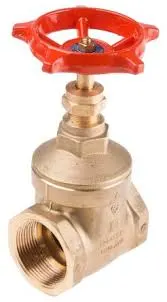
Different types of Gate Valves:
- Wedge Gate Valves
- Insider Screw Gate Valve
- Rising Stem Gate Valve
- Subsea Gate Valve
- Plug-Disk Gate Valves
- Knife Gate Valve
Applications:
Gate valves are used in many industrial applications including the oil and gas industry, pharmaceuticals, manufacturing, automotive, and marine. Non-rising stem gate valves are very popular on ships, in underground applications, or where vertical space is limited because they don't take up extra space.
Flow Factor:
Flow factor(Kv) is the metric equivalent of the flow coefficient. It is defined as the flow of water in cubic meters per hour (m³/hr) at a pressure drop of the bar.
Kv = Q * √ (SG/ΔP)
Flow Coefficient:
The flow coefficient(Cv) of a device is a relative measure of its efficiency at allowing fluid flow. It describes the relationship between the pressure drop across an orifice valve or other assembly and the corresponding flow rate.
Parametric Study:
One of the best ways to get value out of your simulation is to do parametric analysis. With very little marginal work a completed model can be parameterized to simulate scenarios limited only by your computational time and resources.
Parametric studies allow you to nominate parameters for evaluation, define the parameter range, specify the design constraints, and analyze the results of each parameter variation. A parametric study requires the following: Design Objective is set to Parametric Dimensions. Parameters nominated for use in the simulation.
Simulation:
Geometry:
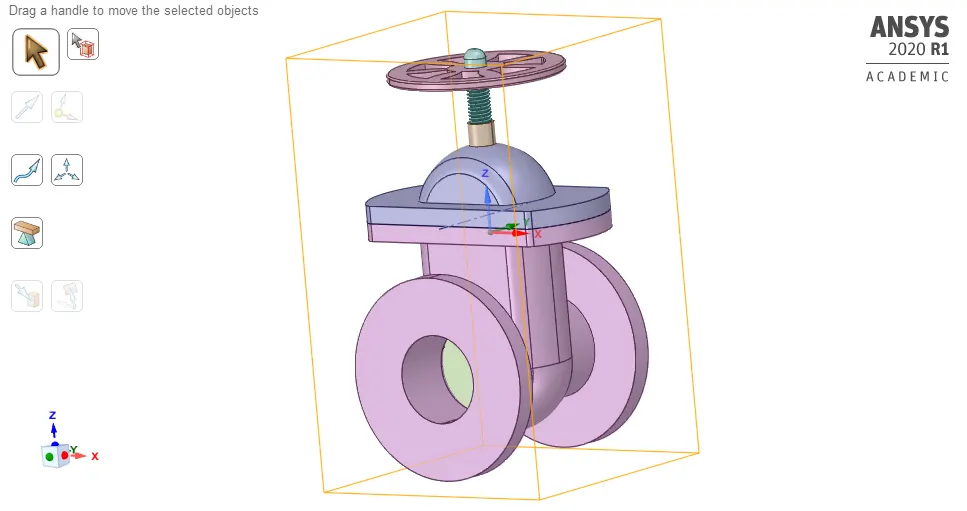
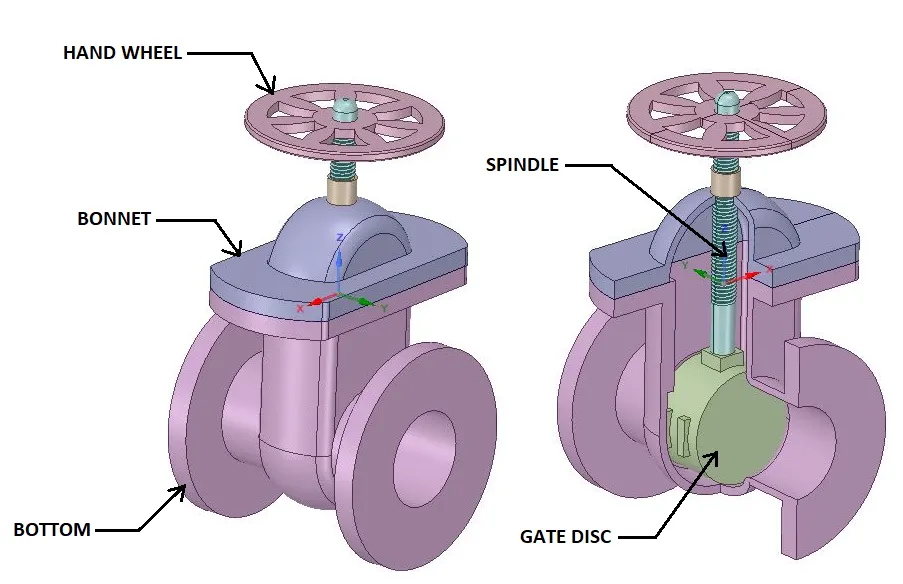
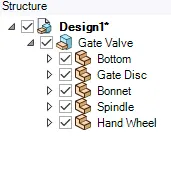
Gate valve(By hiding the bottom):
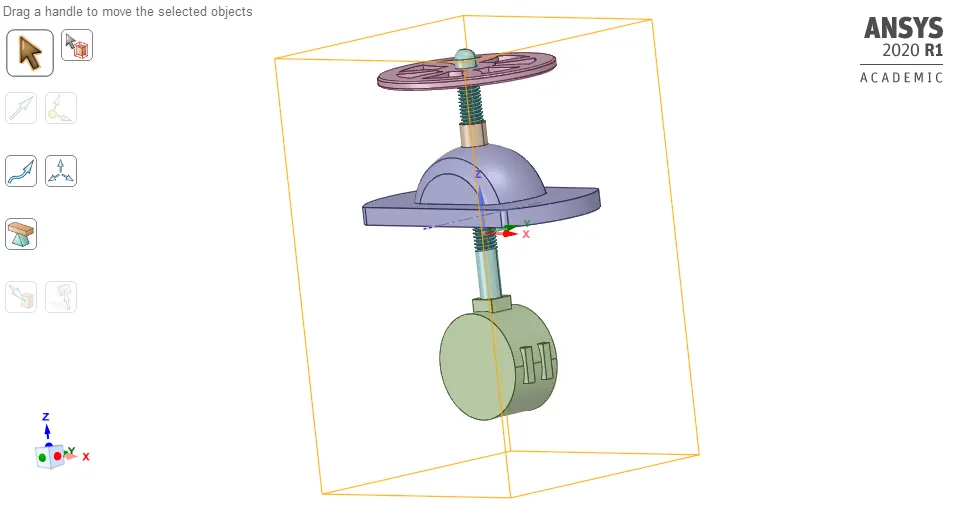
Select the “Gate Disc” component and move it in an upward direction by the “10 mm” lift. To analyze the flow and its effects, we must allow the flow, and for that, we have given a “10 mm” lift to the “Gate Disc”. Lift at Positive z-direction(Because it is lift).
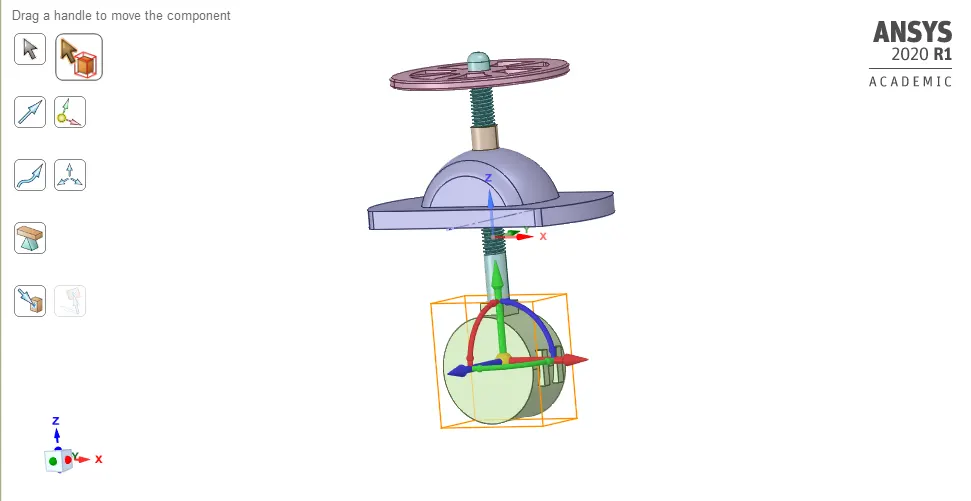
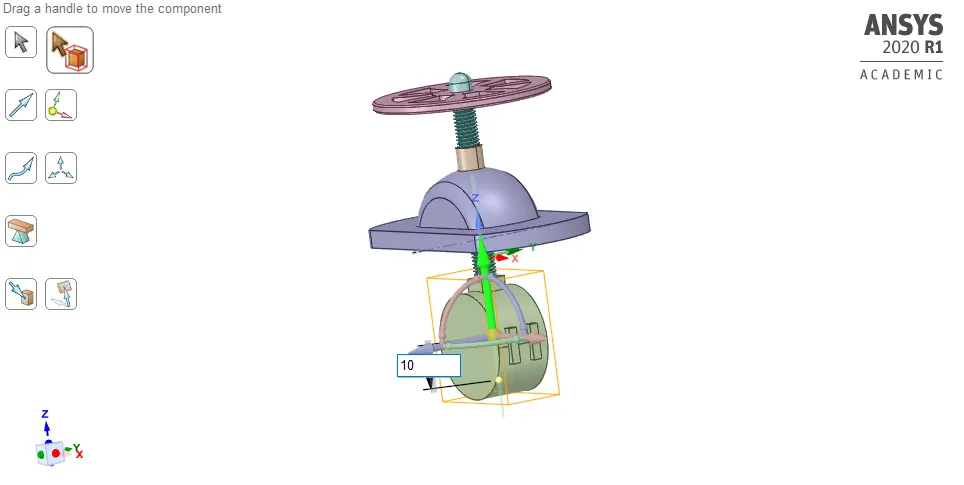
Make it Parametric by Clicking on P:
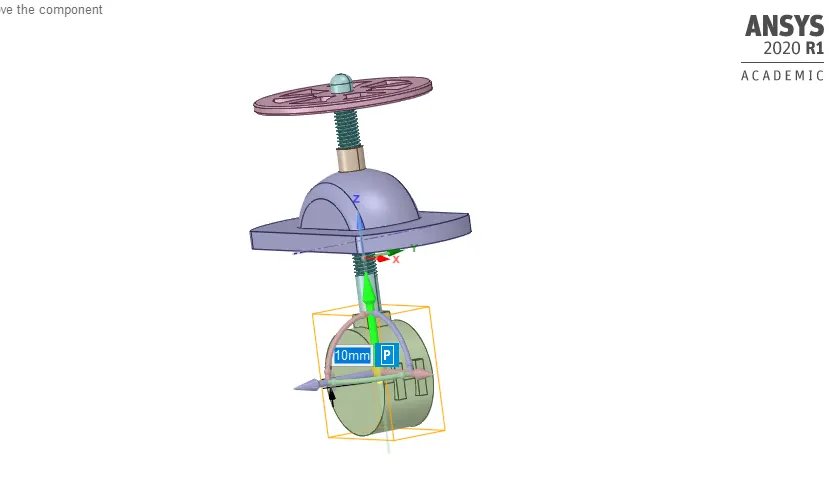
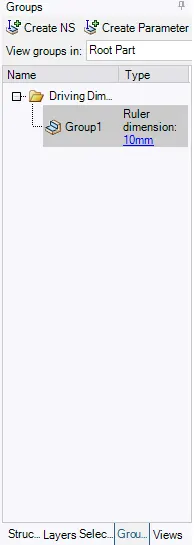
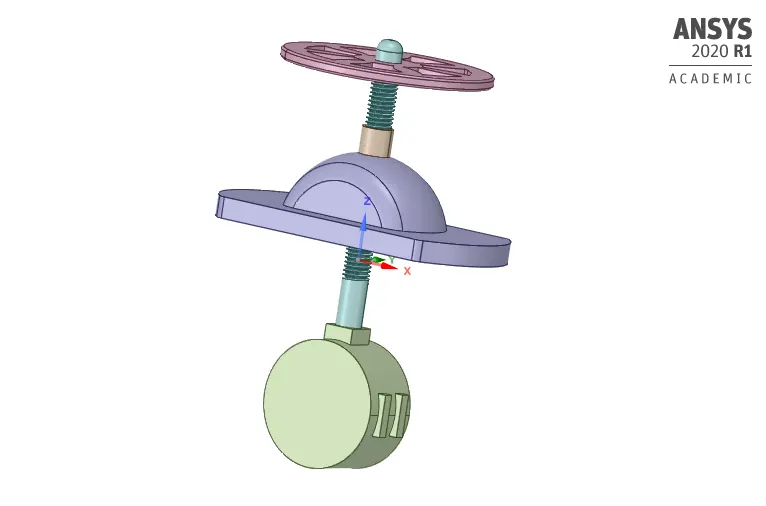 After selecting the symbol “P”, it turns in Grey color, and the message shows that a Group has been created for lift. Created group for the lift parameter shown in the above image. On the left side, in a Tree structure, if we see the Group options, we can see the created group and the amount of parameter, which has been set 10 mm lift. We can simply change the value of the parameter from there directly.
Unhide Bottom:
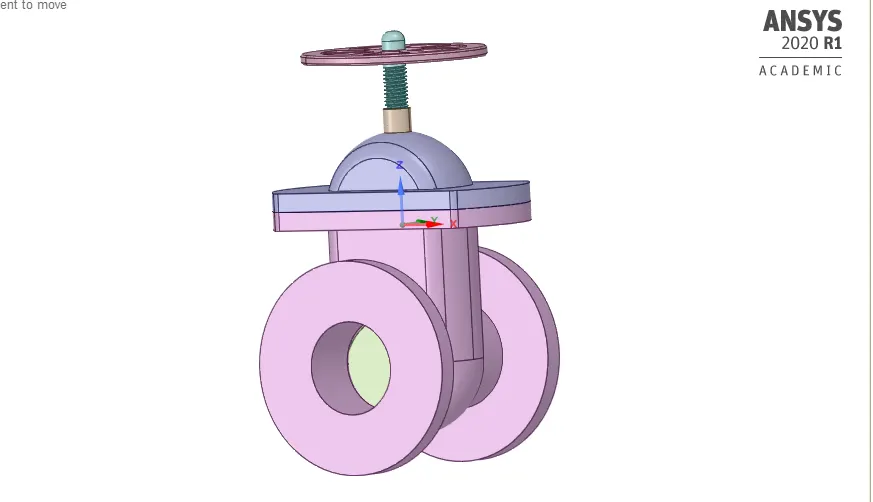
Pull the bottom:
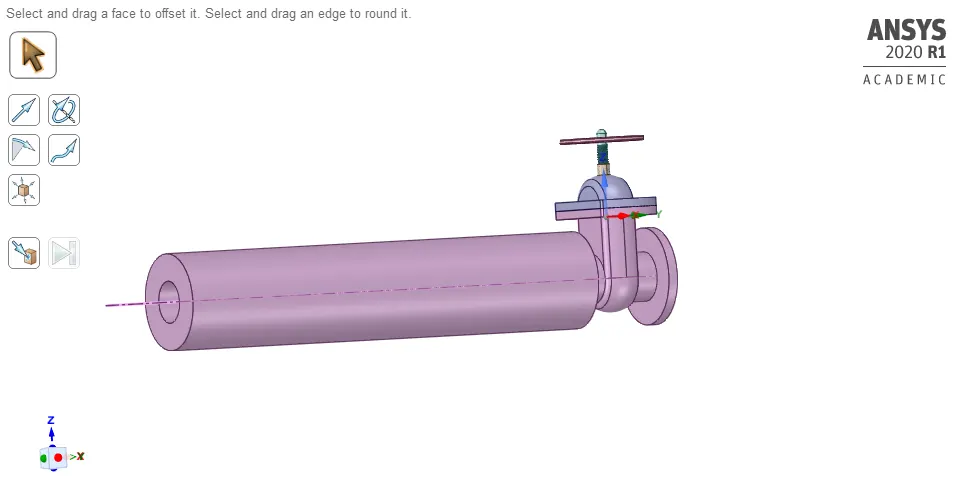
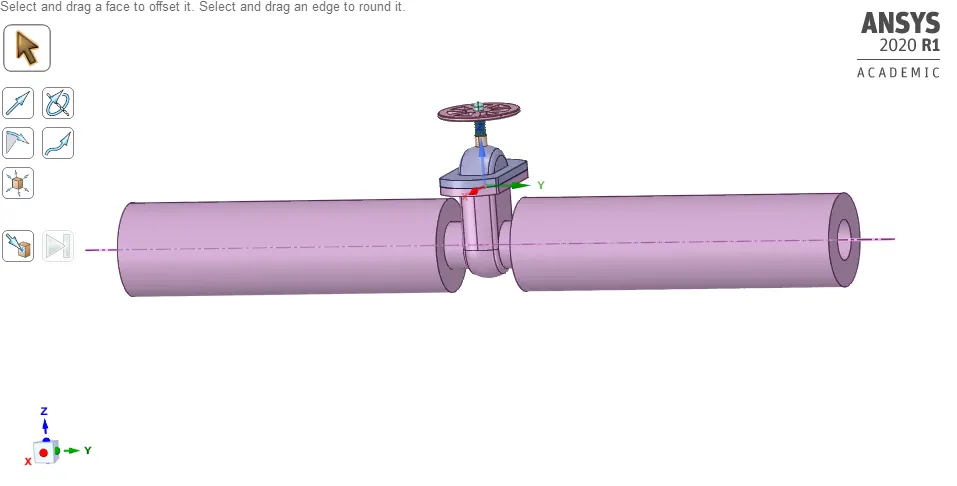
Extract the Fluid volume:
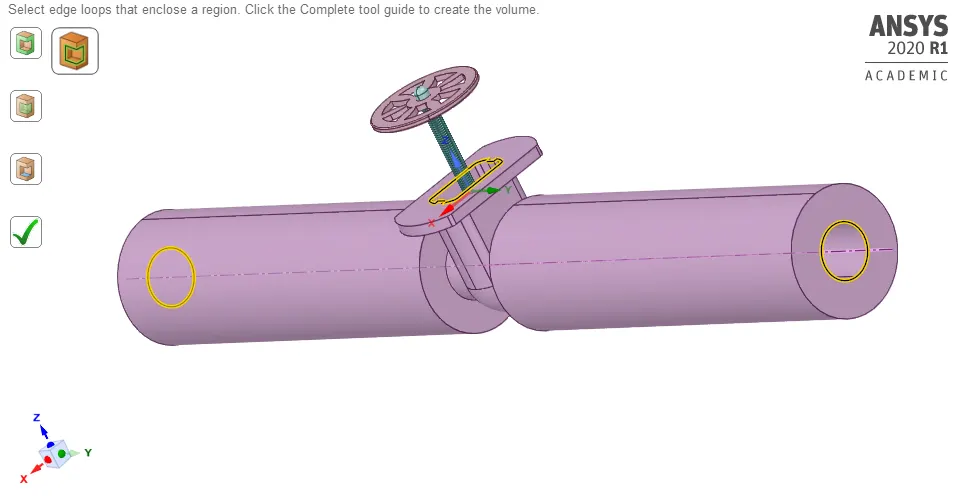
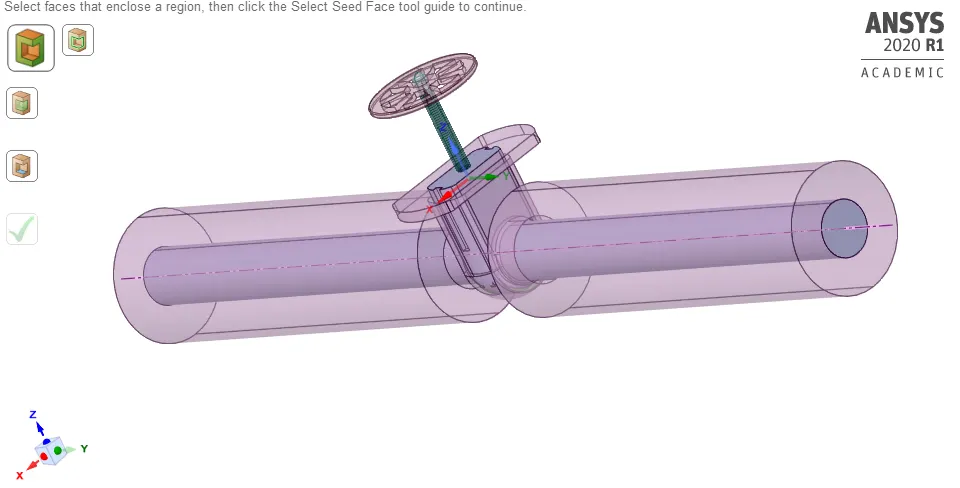
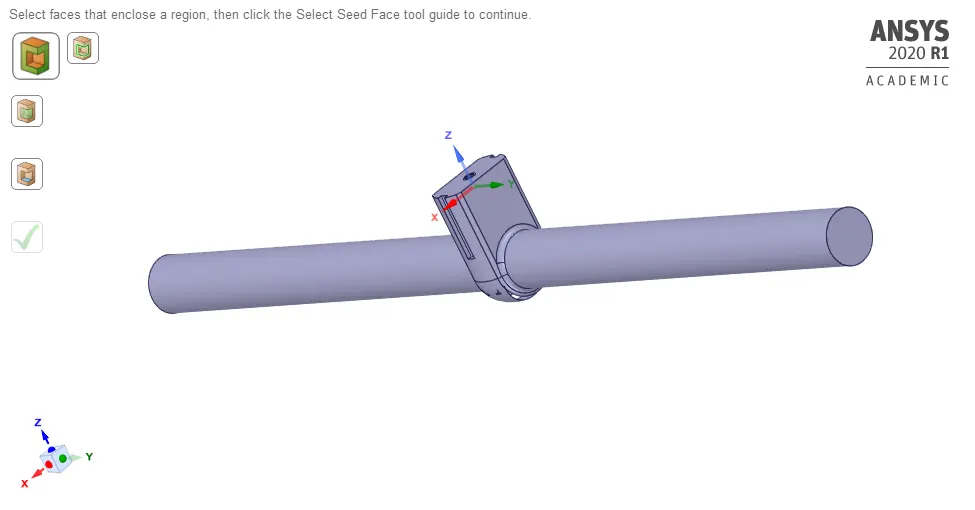
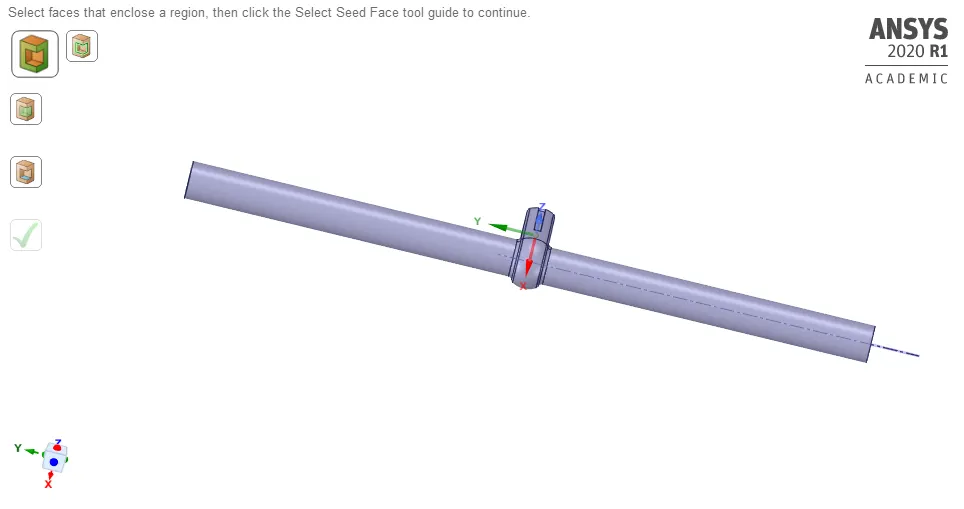
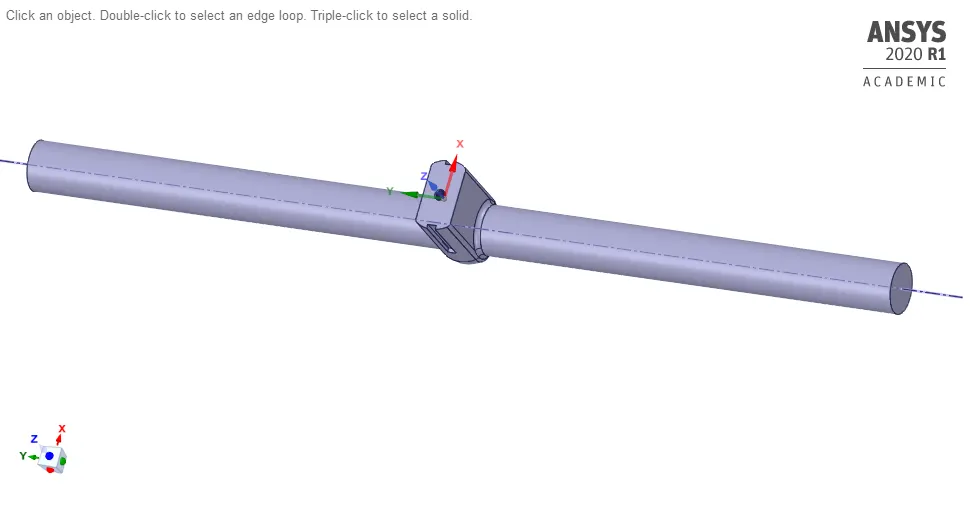
At last click on the Update volume in context by right-clicking on volume so as to take any merging(Find it by making section mode).
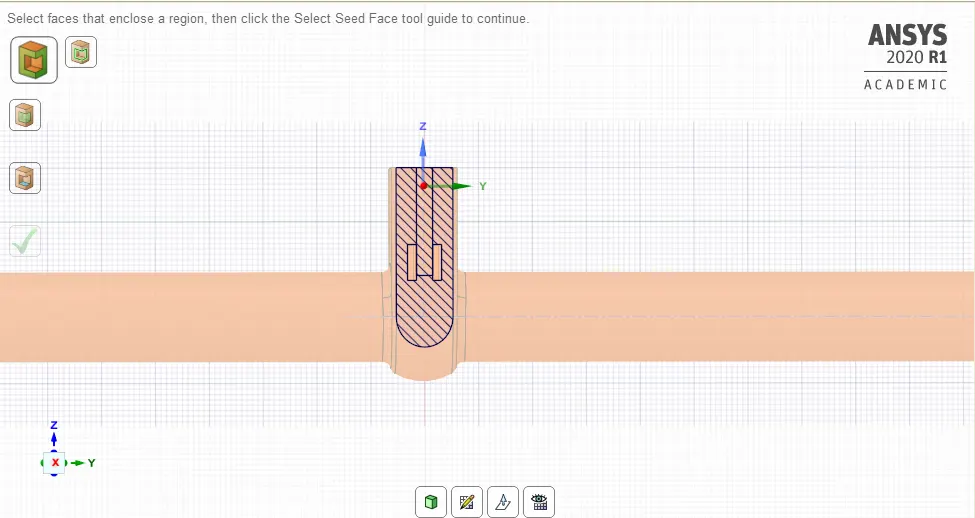
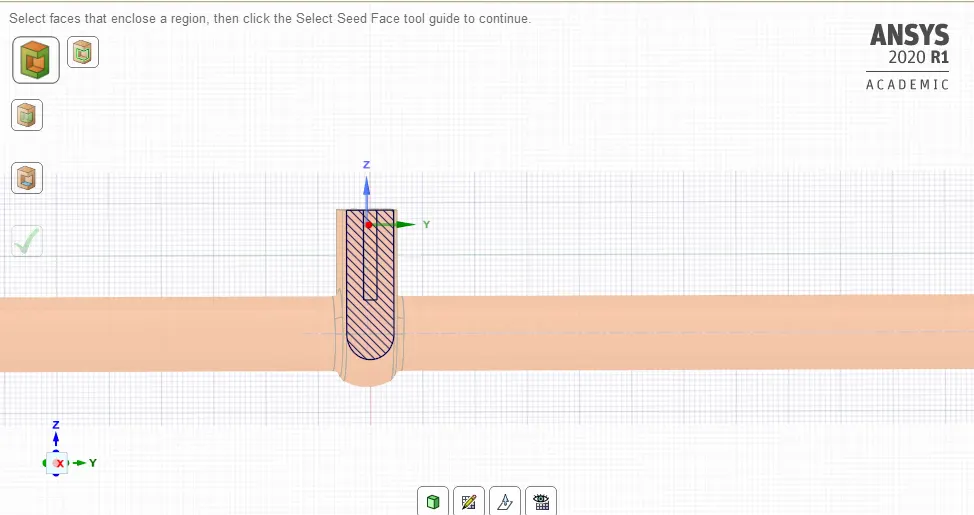
After creating Fluid Volume, Hide all rest parts of the Gate Valve and suppress it for Physics and save it for further process.
Meshing:
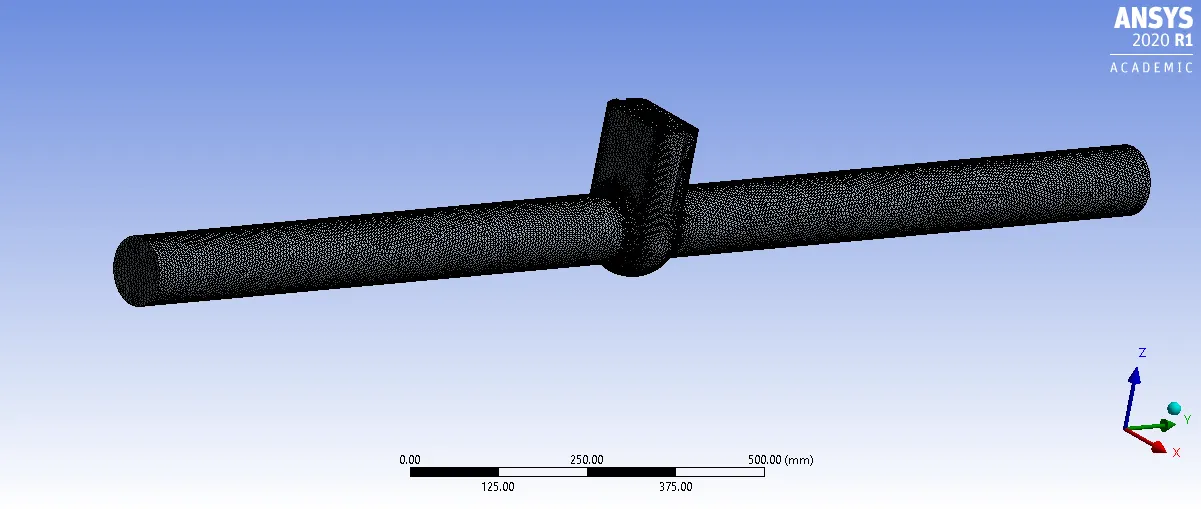
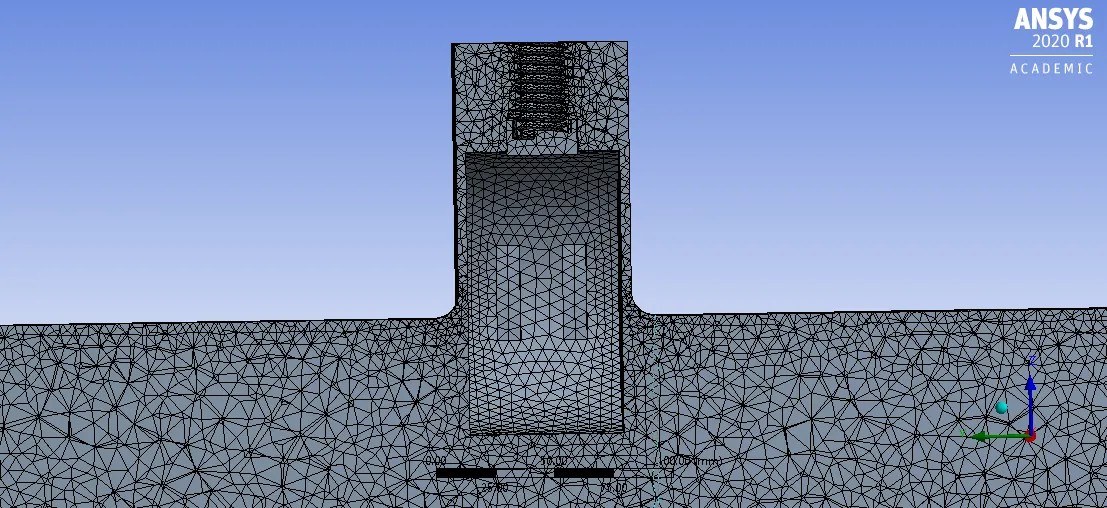
Element size: 6mm.
Number of Nodes: 83679
Number of Elements: 413933
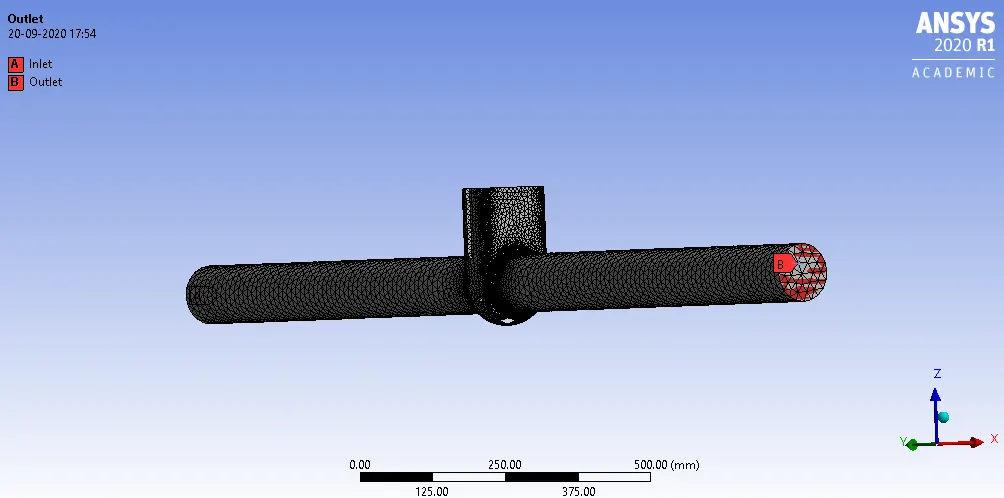
Named selections:
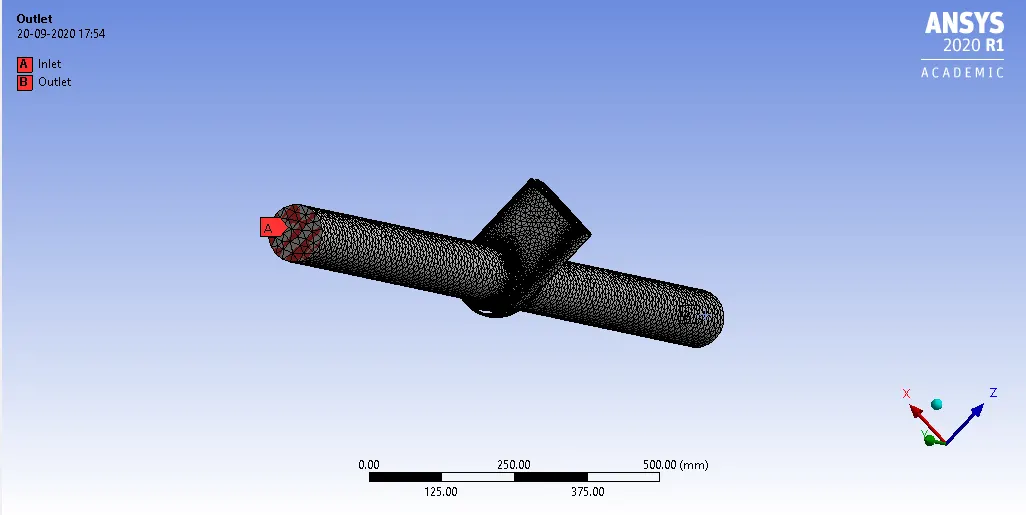
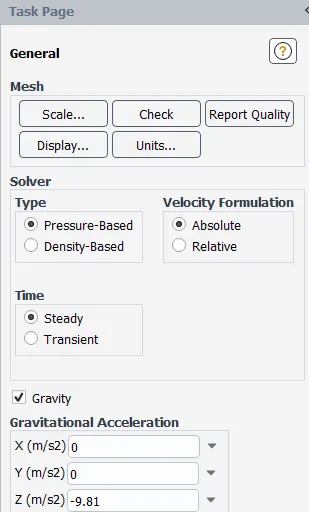
Fluent Setup:
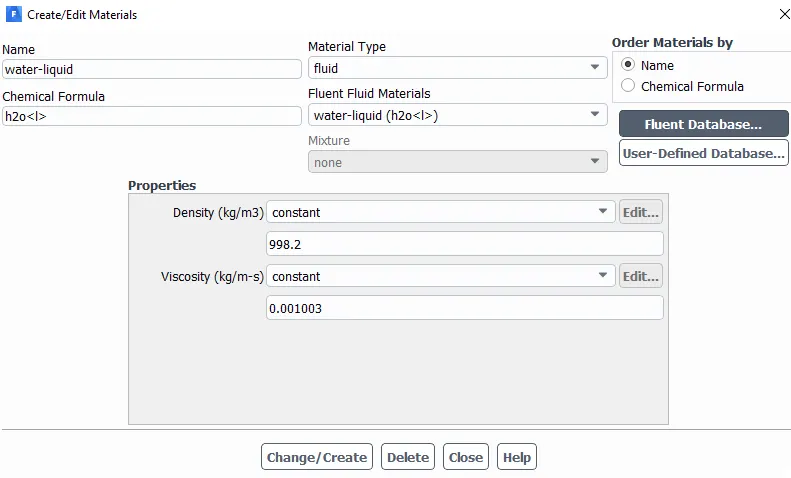
Fluid Material properties:
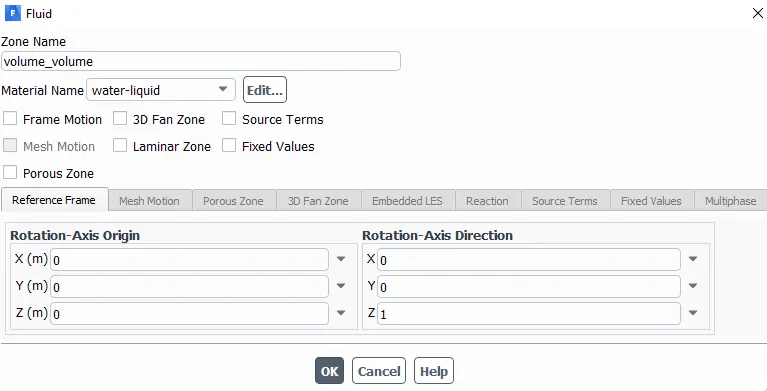
Cell Zone:
Boundary Conditions:
Inlet- Pressure Inlet: Gauge Total pressure=10Pa.
Typically for Pipe flow, a pressure of 10 Pa is acceptable.
Outlet- Pressure outlet: Gauge Total Pressure: 0 Pa.
Wall- Type: Wall.
Wall Motion: Stationary Wall.
Shear Condition: No Slip.
Interior Type- Interior
Viscous Model:
K-Epsilon Realizable with Scalable wall functions enabled.
Reason for using the K-Epsilon model:
- We know that we have taken the K-Epsilon model. The reason behind choosing the K-Epsilon Viscous model is characteristic of the flow, which is turbulent.
- For Reynolds Number more than 2000, flow is considered as turbulent. So we have taken the K-Epsilon Viscous model.
- But here, instead of Velocity Inlet, we have given Pressure Inlet. So knowing the velocity of the flow for proper Reynolds No. is to be known.
- So as to know the velocity of the flow, we have Chosen Standard Initialization and Initialize from Inlet.
- After initialization, we can get the correct velocity and calculate the Reynolds No. using the formula.
- Now by looking at Reynold's number, we can predict which viscous model to be chosen.
Report Definitions:
Mass Flow Rate at Outlet
Create- Report file, Report Plot, Print to console, Create Output Parameter
Create Plane at YZ axis
Contours of Velocity at Plane by enabling Filled option.
Initialization:
Standard Initialization Computing from Inlet.
Run calculations for 250 Iterations.
Parametric Study:
Before After
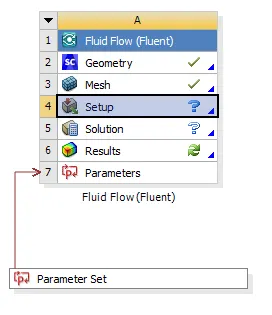
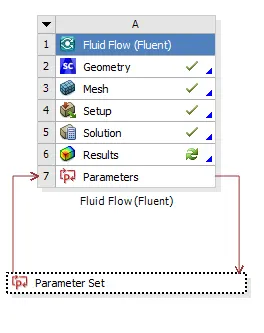
In the above, we can see the Parameterization of the Lift Parameter before and after the Simulation.
We can see the Parametric Set for the study at different Design Points of Lift of the Gate Valve.
After completing the simulation, select “Parameter Set” and give input for different Design Points.
Then Update all Design points and check all the results of different Design points.
Before Update After Update 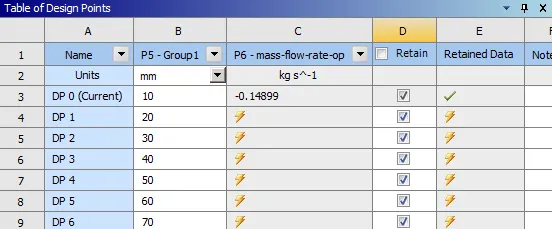
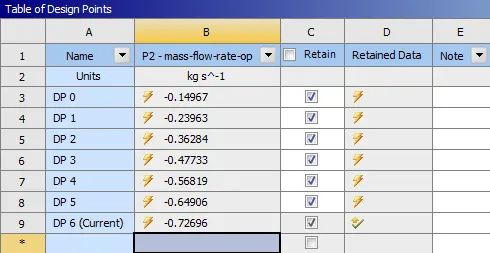
Above, We can see the mass flow rate before and after updating the design points.
Before the Update, we have to give different inputs for the Lift of Gate Disc as 20, 30, 40,50,60, and 70mm & also select all the checkboxes in the Retain column for all the Design Points. Then select “Update All Design Points”.
As we can see in the above image that after updating all the Design Points, results of the Mass Flow Rate of all the Design Points generated automatically. These results are calculated by fluent based on the lift of the “Gate Disc”.
Now we can check all Design Points, one by one for detailed results like Pressure and Velocity Contours, Residual by selecting each Design Point and making it as “Current”.
Results:
Perform a parametric study on the gate valve simulation by setting the opening from 10% to 70%.
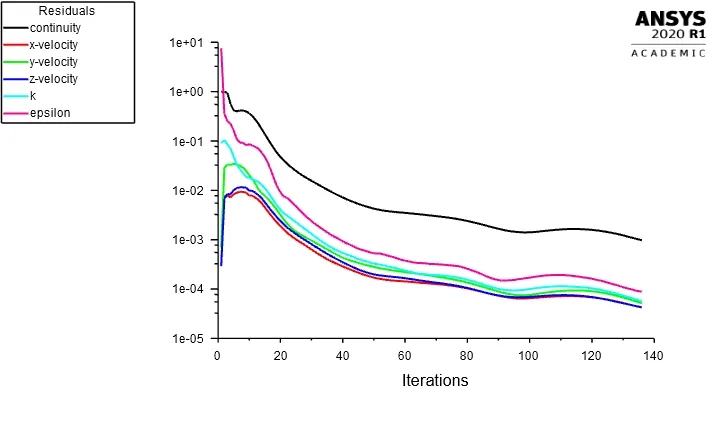
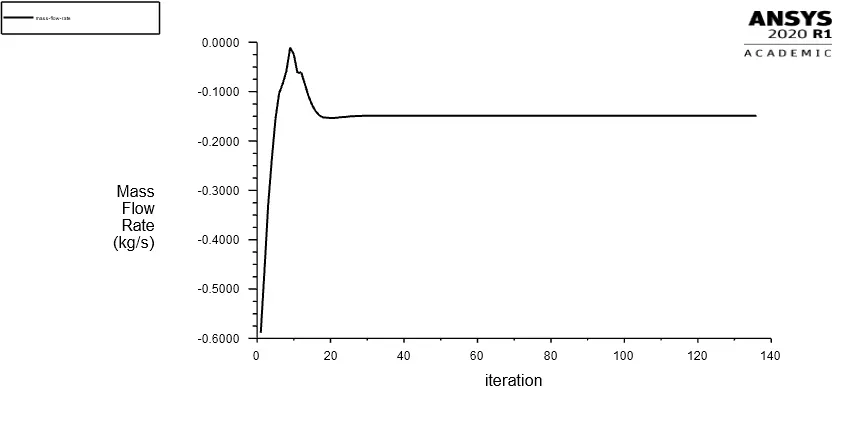
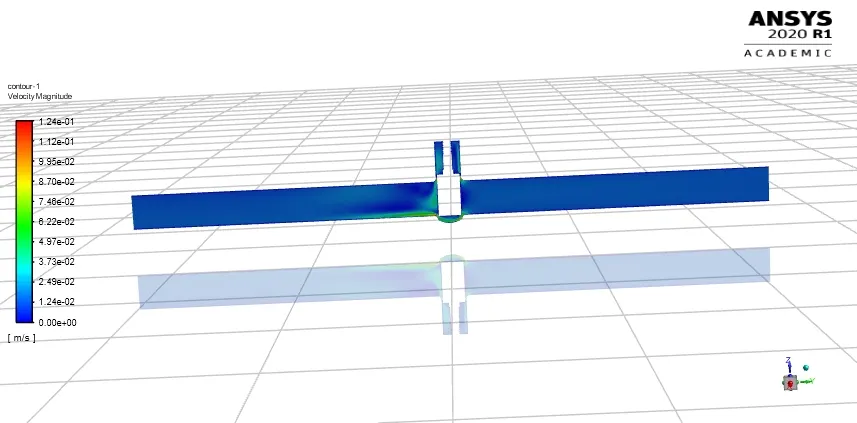
Case1: Lift=10mm:
Residual Plots:
Mass Flow Rate:

Velocity Contours:
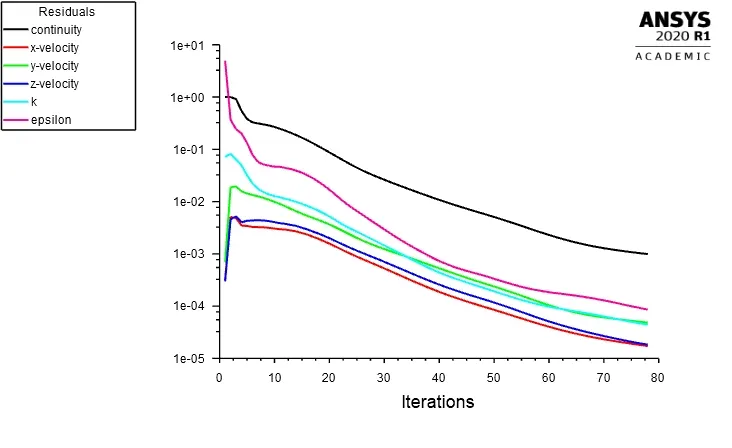
Case2: Lift=20mm:
Residual Plots:
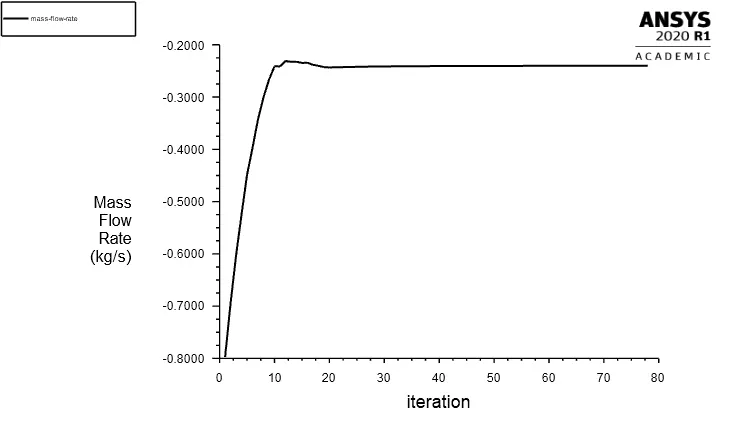
Mass Flow rate:

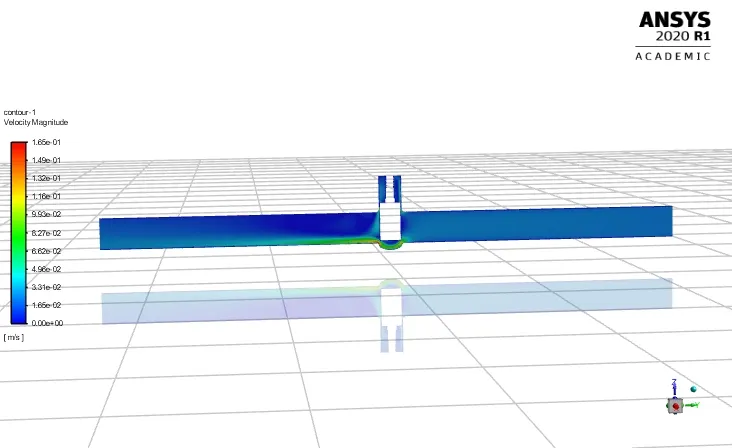
Velocity Contours:
Case3: Lift=30mm:
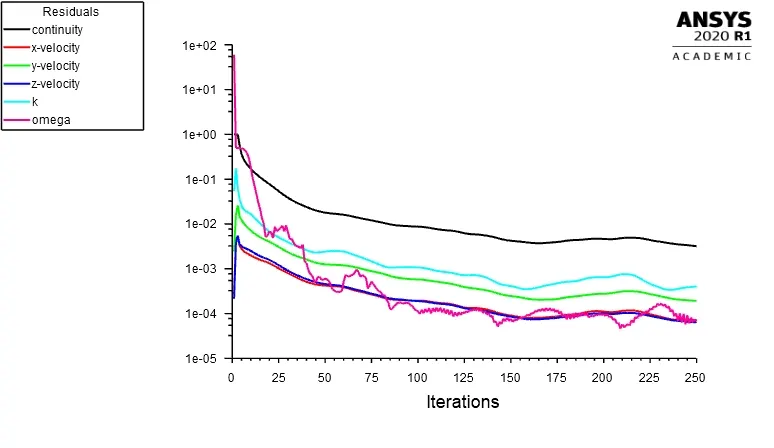
Residual Plots:
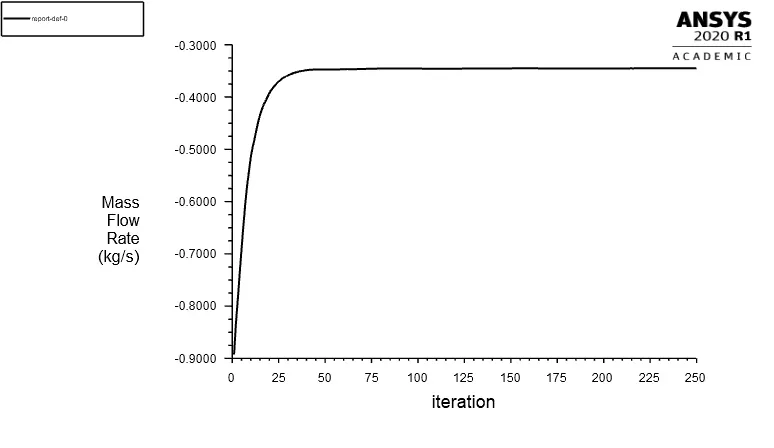
Mass Flow rate:
Velocity Contours:
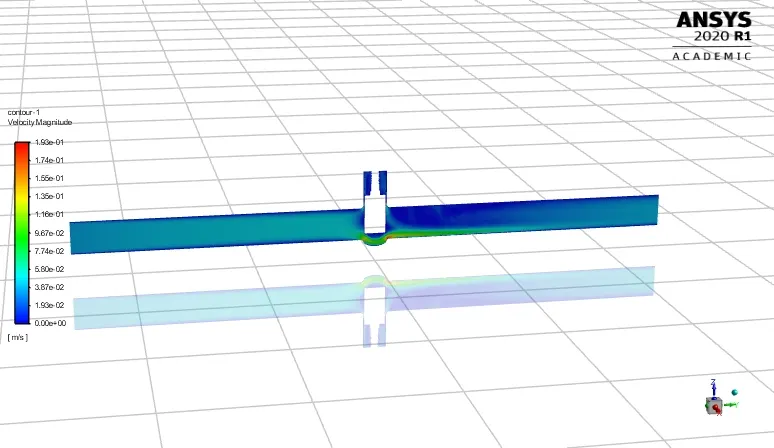
Case4: Lift=40mm:
Residual Plots:
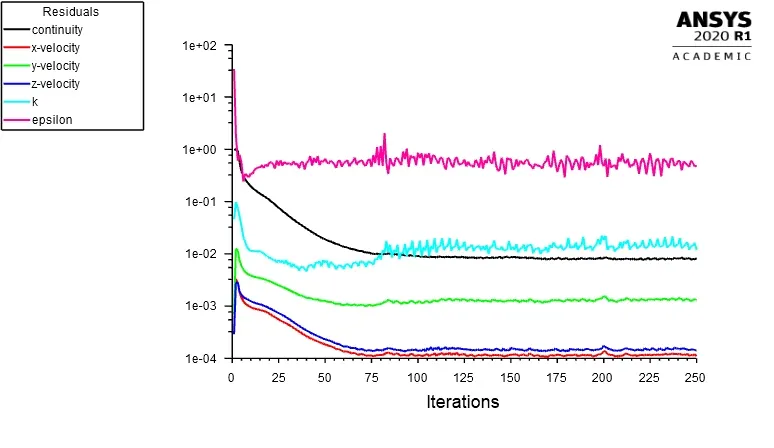
Mass Flow rate:
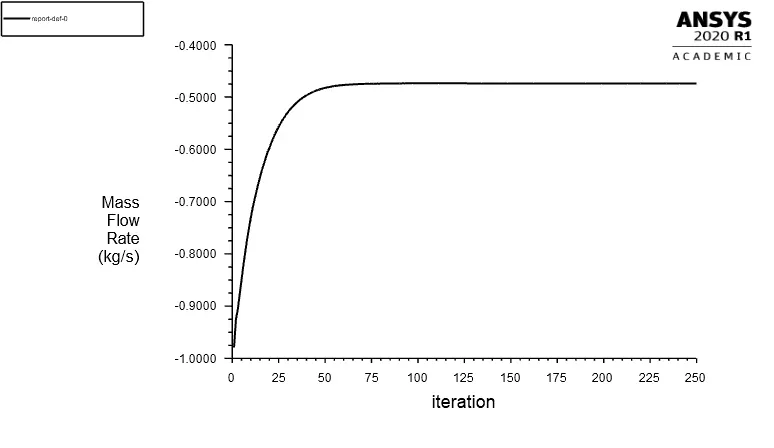
Velocity Contours:
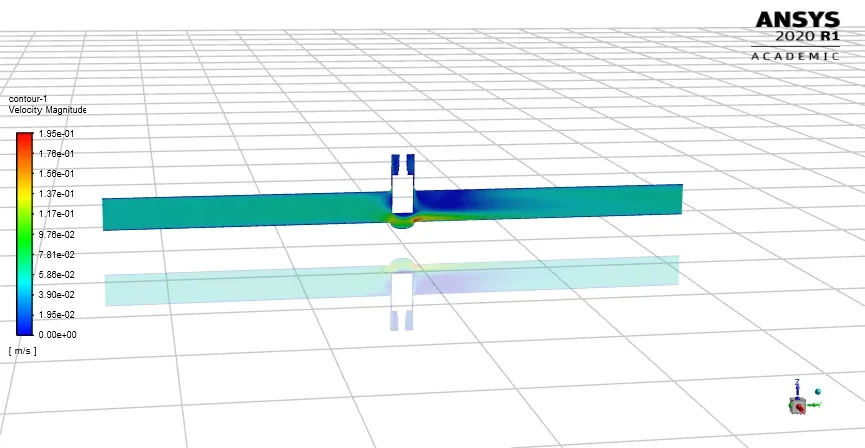
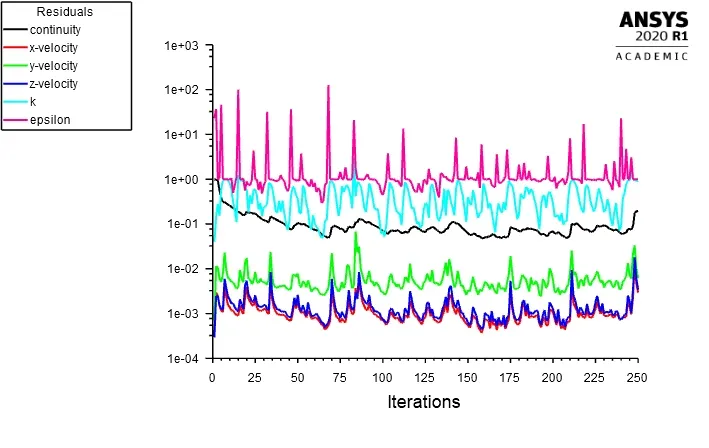
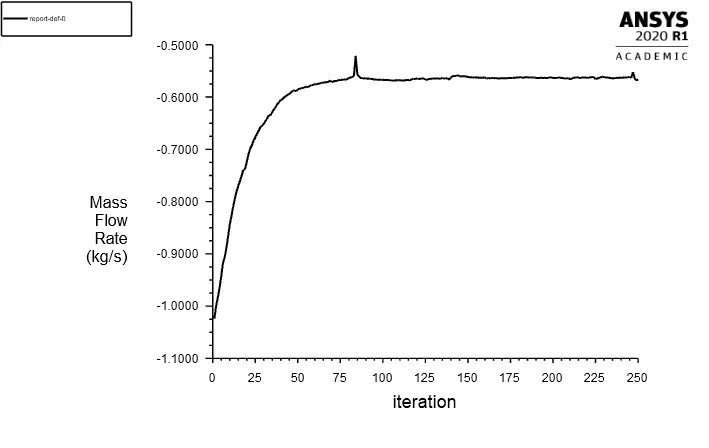
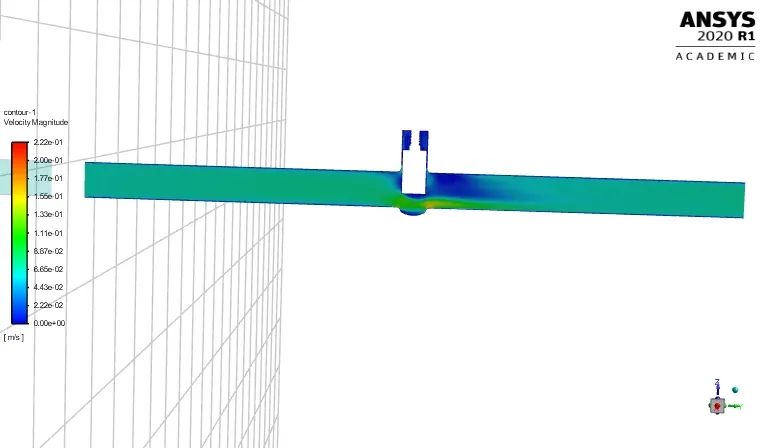
Case5: Lift=50mm:
Residual Plots:
Mass Flow rate:

Velocity Contours:
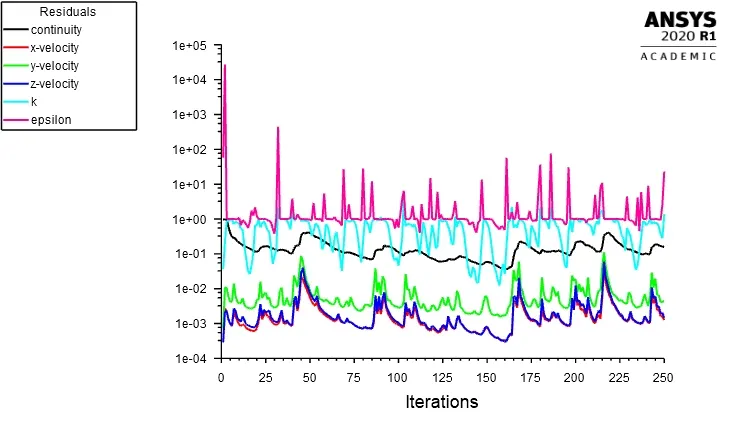
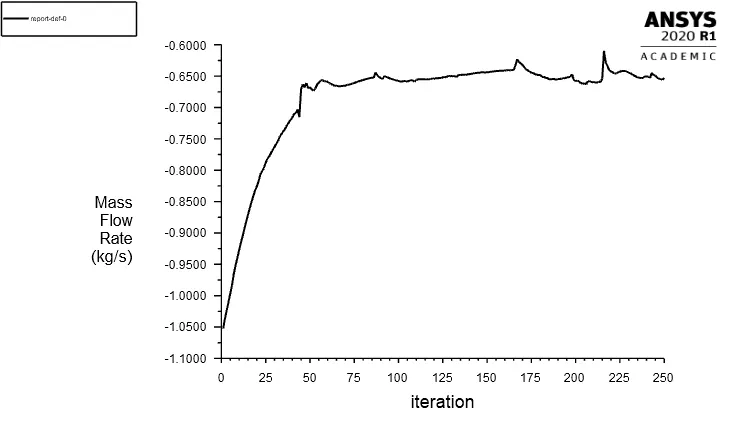
Case6: Lift=60mm:
Residual Plots:
Mass Flow rate:
Velocity Contours:
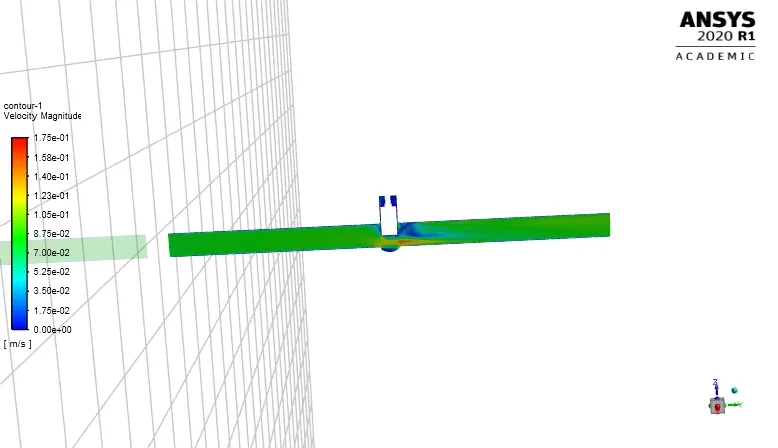
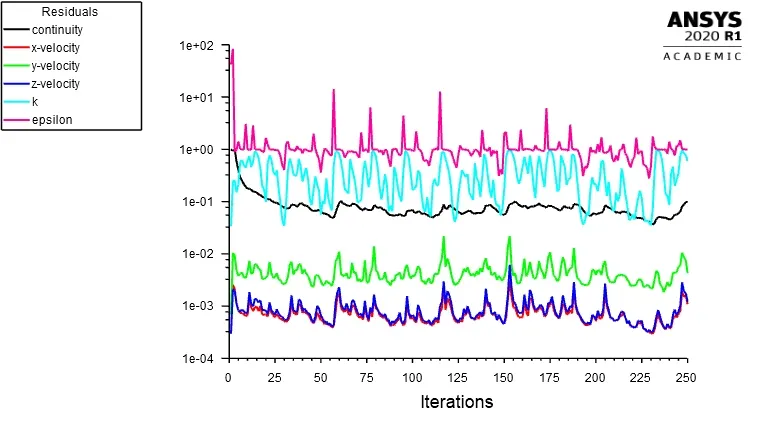
Case7: Lift=70mm:
Residual Plots:
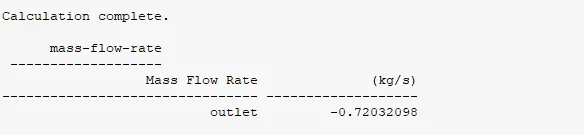
Mass Flow rate:
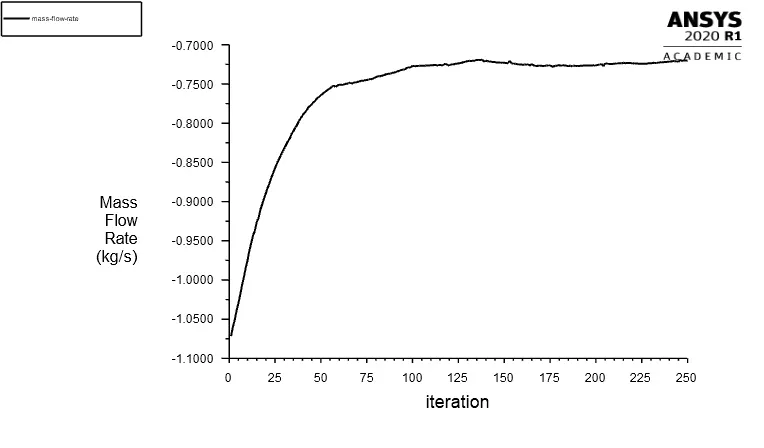
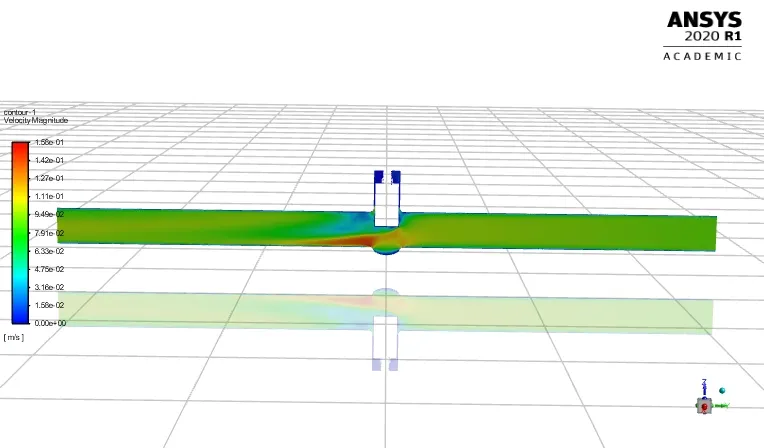
Velocity Contours:
(1). Flow Coefficient :
The flow coefficient of a device is a relative measure of its efficiency at allowing fluid flow. It describes the relationship between the pressure drop across an orifice valve or other assembly and the corresponding flow rate.
Mathematically the flow coefficient Cv (or flow-capacity rating of the valve) can be expressed as :

where:
- Q is the rate of flow,
- SG is the specific gravity of the fluid (for water = 1),
- ΔP is the pressure drop across the valve.
In more practical terms, the flow coefficient Cv is the volume of water at 60 °F that will flow per minute through a valve with a pressure drop of 1 psi across the valve.
(2).Flow Factor :
The metric equivalent flow factor (Kv; commonly used in Europe and Asia) is calculated using metric units :

where
- Kv is the flow factor (expressed in
 ).
). - Q is the flow rate (expressed in cubic meters per hour [
 ]),
]), - SG is the specific gravity of the fluid (for water = 1),
- ∆P is the differential pressure across the device (expressed in [bar]).
Kv can be calculated from Cv using the equation :

Calculations:
SG= Specific gravity of water=1.
Q = 1 kg/s = 3.6 m^3/hr.
ΔP= 10-0 = 10 Pa = 10*10^-5 bar = 10^-4 bar.
Calculating Kv for each case,
(1). Kv=3.6*0.1483*sqrt(1/10^-4) =3.6*0.14967*100=53.8812 .
(2). Kv=86.2668.
(3). Kv=130.6224.
(4). Kv=171.8388.
(5). Kv=204.5484.
(6). Kv=233.66.
(7). Kv=261.70.
Similarly Cv for each case,
Cv=Kv/0.865
(1).Cv=62.29.
(2).Cv=99.73.
(3).Cv=151.00.
(4).Cv=198.65.
(5).Cv=236.47.
(6).Cv=270.127.
(7).Cv=302.54.
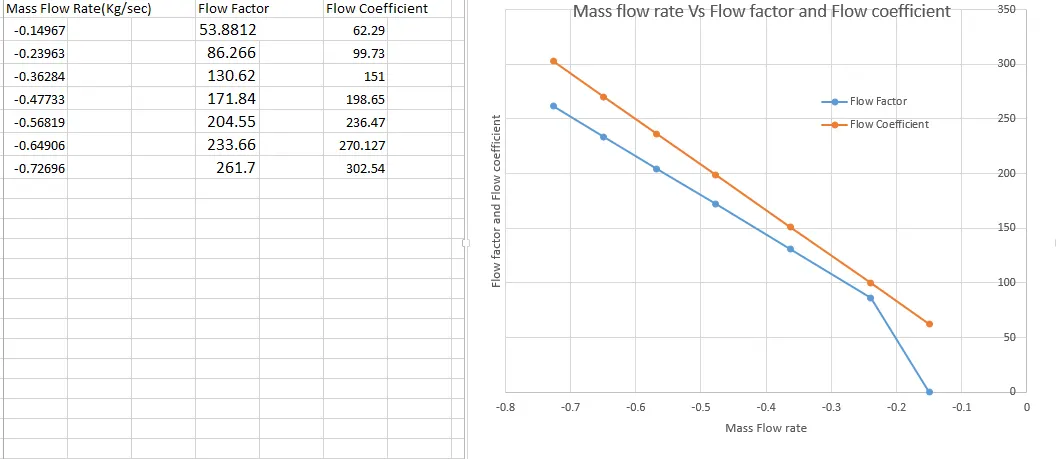
Graph for Mass Flow rate VS Flow Factor and Flow Coefficient:
Conclusions:
(1). The mass flow rate gradually increases as the lift of the gate disc increases.
(2). A parametric study is a time reducing option when studying the effects of changes of certain parameters on a system.
(3). The variation of flow coefficient and flow factor with the opening of the gate valve is studied by using parametric study.
(4). The flow coefficient plays important role in the selection of the valve and sizing of a valve. It also helps us in computing the efficiency of the system and the effect of the pressure on the system.