Flow over a bicycle
Aim:
1.Calculation of drag force against a cyclist using Matlab Tool
2.Plotting a graph between velocity and drag force
3.Plotting a graph between drag coefficient and drag force
Formulae:
The formula used to calculate the drag force against a cyclist is
Drag force`(Fd)=Cd.A.(rhov^2)/2` `(kg-m)/sec` / `N`
Where, `Cd=`Drage coefficient`
`A=`Area `(m/sec^2)`
`rho=`Density of fluid (kg/m^3)`
`v=`Flow Velocity relative to the object (m/sec)`
Inputs:
`Cd=0.6`
`A=0.2 m^2`
`rho`=1.225``((kg)/m^3)`
`v=1(m/sec)`
- In this challenge, while the cyclist is pedalling the frontal area will change constantly. So, I assumed the frontal area as 0.2 m^2.
Matlab code:
1.The program to calculate the drag force in Matlab tool is
% a problem to calculate the drag force against a cyclist
 clear all
 close all
 clc

 %Inputs
 %Drag coefficient
 c_d=[0.6]

 %Area m^2
 A=0.2;

 %Density kg/m^3
 rho=1.225

 %Velocity m/s
 v=1;
 drag_force = rho*A*v.^2*c_d*0.5;
Output:
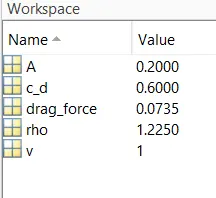
Result:
- The drag force against the cyclist is `Fd=``0.0735` `(kg-m)/sec`
2.The program to plot the graph between velocity and drag force.
%Plotting the graph between Velocity & Drag force
 clear all
 close all
 clc

 %Inputs
 %Drag coefficient
 c_d=[0.6]

 %Area m^2
 A=0.2;

 %Density kg/m^3
 rho=1.225

 %Velocity m/s
 v=[1:10];
 drag_force = rho*A*v.^2*c_d*0.5;
 plot(v,drag_force)
 xlabel('Velocity')
 ylabel('drag_force')
 grid on
Output:
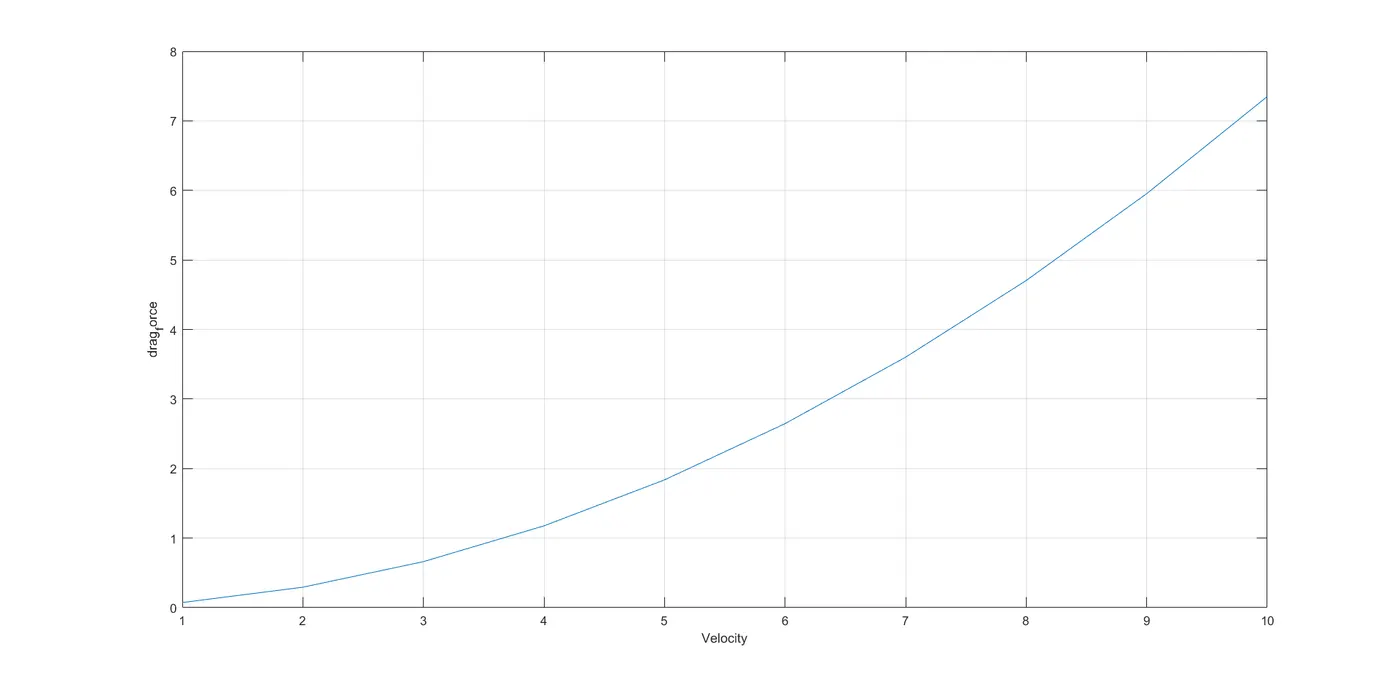
- I assumed the values of velocity were changing from 1m/sec to 10m/sec at the constant drag coefficient to plot the graph
- The above graph shows the plotting a graph between Velocity Vs drag force.
- The program to plot the graph between drag coefficient and drag force.
 % a problem to plot graph between drag coefficient and drag force
 clear all
 close all
 clc

 %Inputs
 %Drag coefficient
 c_d=[0.1:0.9,10]

 %Area m^2
 A=0.2;

 %Density kg/m^3
 rho=1.225

 %Velocity m/s
 v=1
 drag_force = rho*A*v.^2*c_d*0.5;
 plot(c_d,drag_force)
 xlabel('drag_coefficient')
 ylabel('drag_force')
 grid on
Output:
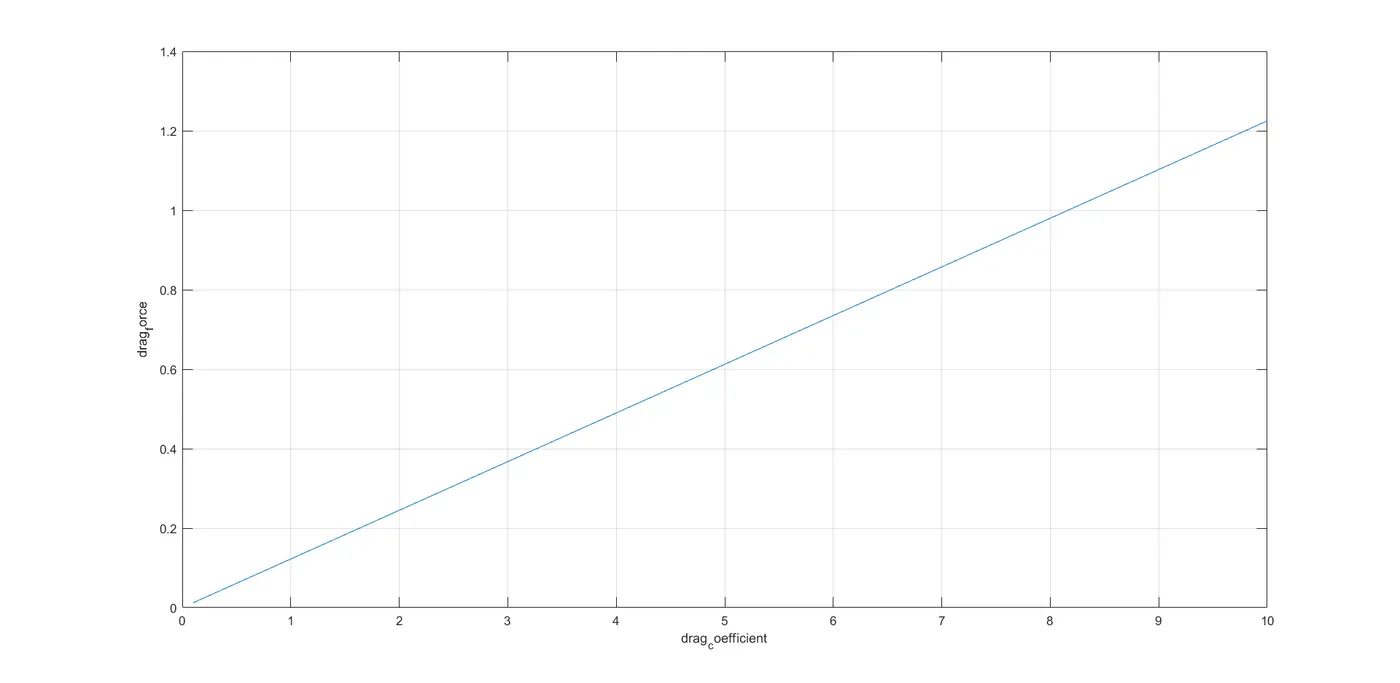
- The above graph shows the plotting a graph between drag coefficient and drag force
- In this challenge I assumed the value of c_d changing from 0.1 to 0.9 to plot the graph between drag force and drag coefficient.
Conclusion:
Hence the drag force of cyclist is calculated and plotted the graphs for drag force vs drag coefficient & drag force vs velocity of cycle.