Final Project: Electric Rickshaw modelling
Final Project:- Electric Rickshaw modelling.
AIM:- Designing a MATLAB (Simulink) model of an Electric Rickshaw (Three wheel Passenger vehicle) as per given detailed.
Objective:-
- Create a MATLAB model of an Three Wheel Pasenger Vehicle.
- Rear wheel driven by Permanent Maganet(PM) Brushed type DC Motor.
- Assume efficiency Points of motor Controller and motor.
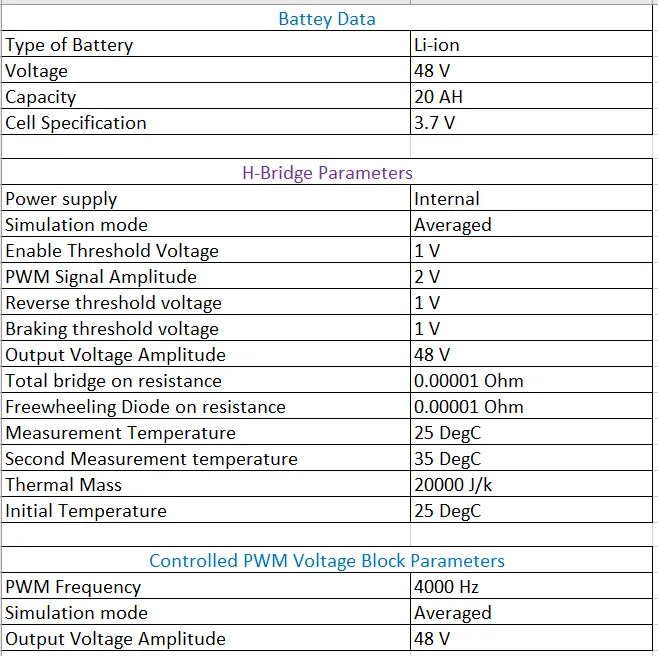
- Make an excel sheet of all input and assumed data.
Abstract:-
E-Rickshaw- A green solution with no petrol, CNG requirements Electrick rickshaws need minimum maintenance and could serve as a solution to last mile commuting problems. Apart from contributing to clean environment; it can also lead to empowerment of people from lower socio-economic backgrounds. These vehicle have gained much popularity owing to the comfortable and economic mode of transport they provide to the fellow commuters. The revolution in the electrification of conventional vehicles due to increased petroleum prices and environmental concerns has had its impact on three-wheeler vehicles as well.Motorized three-wheeled vehicles, known as Auto-rickshaws, are a standard mode of trans- portation in India. Existing battery operated electric rickshaws (known as E-rickshaws) available in major cities of India faces challenges like insufficient charging facility, low driving range, high battery cost, battery replacement/disposal, etc. Two energy sources of complementary characteristics, when operated in tandem, can enhance the over- all performance of a vehicle in terms of weight, volume, and efficiency.They are Three wheeler pulled by an electric motor . Till yet only few foreign countries manufacture these vehicles. Battery run rickshaws could be a low emitter complementary transport for the low-income people.
Introduction:-
India, holding the second largest population in the world, is also home to some of the most polluted cities across the globe. Fourteen of the twenty most polluted cities in the world are in India according to a recent. A major contributor towards pollution in these cities are emissions from motorized vehicles.The rise in air pollution has escalated the research towards improving air quality across the country. Also incompetent petroleum resources which kept the growth of economy in check for the past few decades have raised the necessity to identify alternate fuel propelled vehicles for transportation. Transportation electrification was hence identified as a potential breakthrough to answer all these concerns faced by the country in the present decade and for future. Three wheeled motorized vehicles called as Auto-rickshaws, capable of carrying three to four passengers plays a vital role in public transportation in India along with trains and buses.
E-Rickshaw are small vehicles, with three wheels and use elctric power from batteries to run. They use an electric motor as engine which draws electric power from the rechargeable batteries installed in the rickshaw body. These battery operated vehicles are perfect for small distance transport, both cargo and people; they are perfect for runnning on narrow streets because of their small size. But the biggest reason for their popularity is low operating cost and zero air pollution.In a nutshell you can say they are bigger version for rickshaws powered by electricity. They are like normal rickshaws by electric motor instead of petrol or diesel motor. they are perfect for a pollution free,environment friendly transport system in short distances. Actually they are not capable of running long distances. E-rickshaws are now one of the preferred mode of transport in streets because of its low maintenance cost, low fuel cost, Eco- friendly, no noise pollution, easy to drive last but not the least livelihood, E-rickshaw is a boon to the common man.Without putting in much physical efforts and without investing much amount of money, the earning is quite good for an e-rickshaw driver and hence it is an important means of livelihood for many. These e-rickshaws consist of 3 wheels with a differential mechanism at rear wheels. Basically these vehicles has a mild steel tubular shassis. The motor is PM Brused type motor. The elctrical system used in indian version is 48VDC can run 90-100 Km/full charge, top speed 45 Kmph and this lectric motor power ranging from 650-1400 Watts; the battery takes 8-10 hrs to becomes fulley charged. Basic seating capacity is driver plus 4 passenger total 5 persons.
Need of E-rickshaw:-
As population increases there came to a need for the fast & eco-friendly mode of transports. Then started the evolution of electric vehicles especially E-rickshaws and electric automobiles. So many technologies were there which supported a reliable battery and the weight of the needed number of batteries elevated the price of making an electric vehicle. Battery rickshaw or the electric tricycle is the latest eco friendly vehicle which is most suitable for covering short distances. E-Rickshaws are three wheel battery operated vehicles, which are considered as an upgrade to conventional rickshaws and other fuel varients, these rickshaw, since are battery powered have zero emission, and is often argured to be much better than other rickshaws as they are considered almost pollution free.
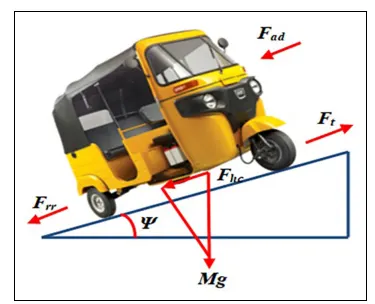
Fig:- Vehicle Load Model
The force acting on E-Rickshaw used following formulas:-
1] Rolling Resistance (Frr):-
`Frr =M*Cr*g*Cosalpha`
2] Aerodynamic drag (Fad):-
`Fad = 1/2*rho*Af*Cd*V^2`
3] Hill Climbing Force (Fhc):-
`Fhc= M*g*Sinalpha`
Where, g is the gravitational acceleration, Cr is tire rolling resistance coefficient, Alpha is the slope angle of the road, rho is the Air density, Af is the vehicle frontal area, Cd is the aerodynamic drag coefficient, and V is the wind speed.
Model of Electric Rickshaw (3-Wheeler Vehicle) using Rear wheels driven by PM brushed type motor as shown in following:-
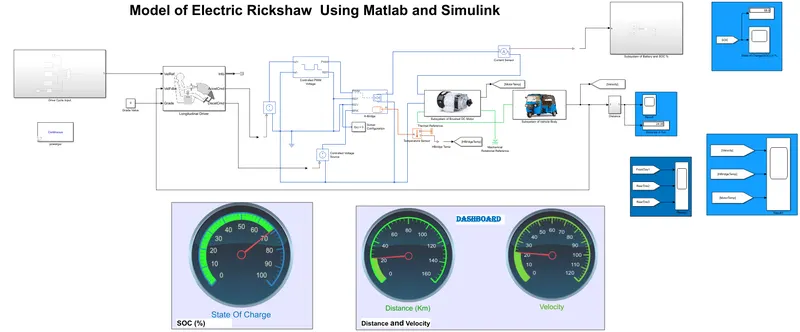
Block name in this model and their explanation as shown following:-
1] Longitudinal Driver block
Block Symbol:-
Explanation:-
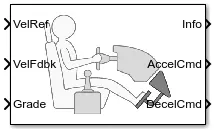
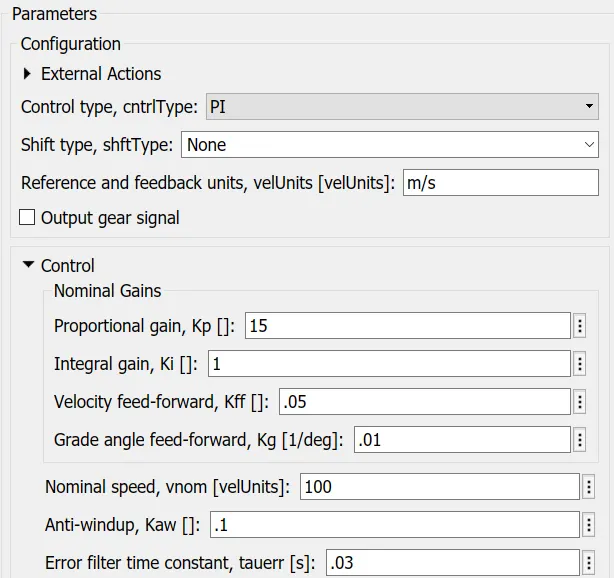
The Longitudinal Driver block implements a longitudinal speed-tracking controller. Based on reference and feedback velocities, the block generates normalized acceleration and braking commands that can vary from 0 through 1. You can use the block to model the dynamic response of a driver or to generate the commands necessary to track a longitudinal drive cycle.
Block Parameter:-
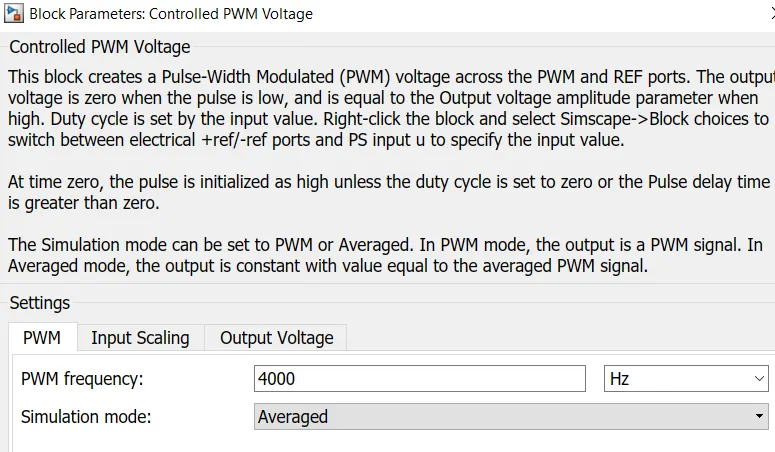
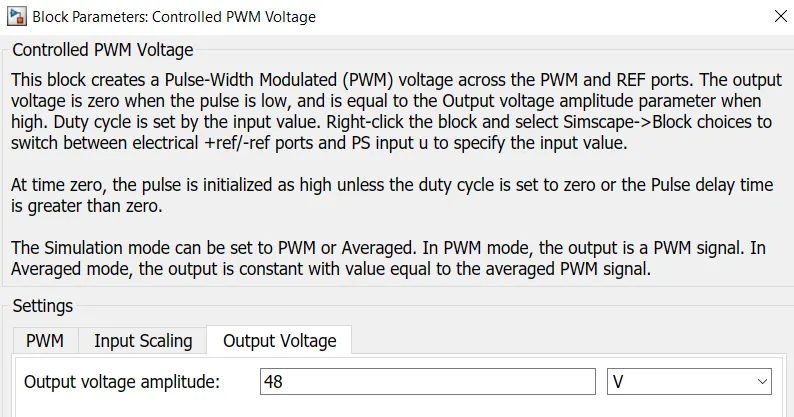
2] Controlled PWM Voltage block
Block Symbol:-
Explanation:-
The Controlled PWM Voltage block represents a pulse-width modulated (PWM) voltage source. You can model electrical or physical signal input ports by setting the Modeling option parameter to either:
-
Electrical input ports — The block calculates the duty cycle based on the reference voltage across its ref+ and ref- ports. This option is the default.
-
PS inputs— Specify the duty cycle value directly by using an input physical signal port.
If you set Modeling option to Electrical Input Ports, the demanded duty cycle is
100∗(Vref−Vmin)/(Vmax−Vmin ) %
where:-
-
Vref is the reference voltage across the ref+ and ref- ports.
-
Vmin is the minimum reference voltage.
-
Vmax is the maximum reference voltage.
The value of the Output voltage amplitude parameter determines amplitude of the output voltage.
Block Parameter:-
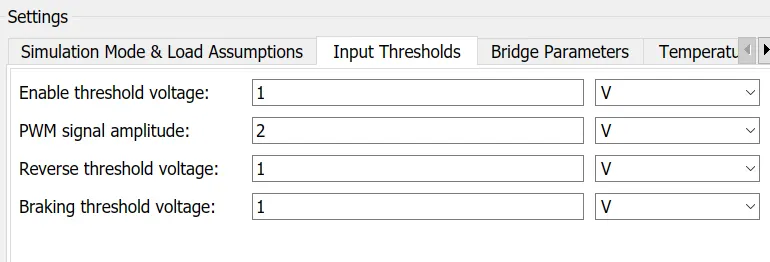
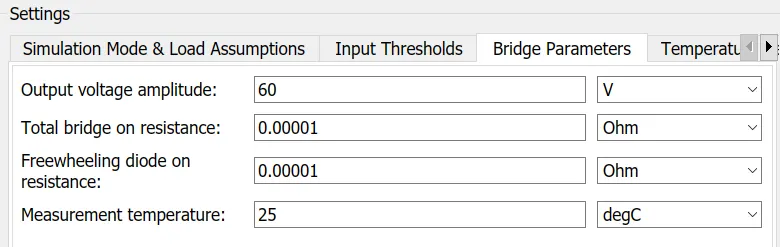
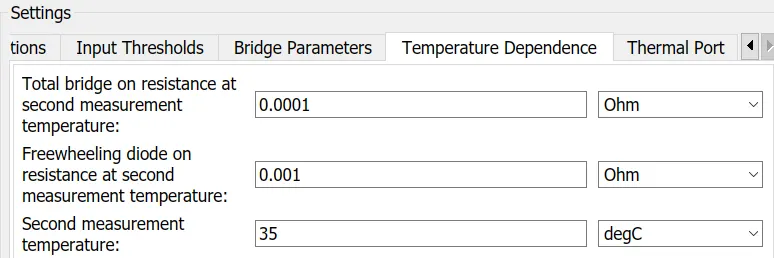
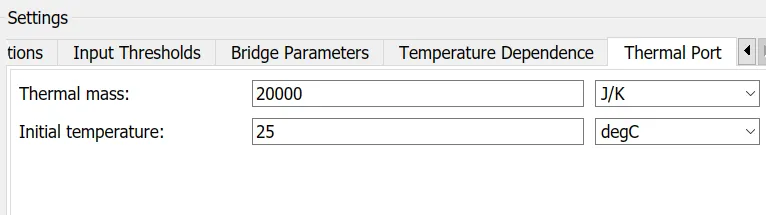
3] H-Bridge Block with thermal port:-
Block Symbol:-
Explanation:-
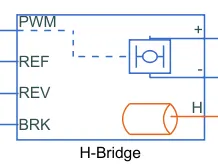
In this block there 4 port left side are mentioned following:-
1] PWM
2] REF
3] REV
4] BRK
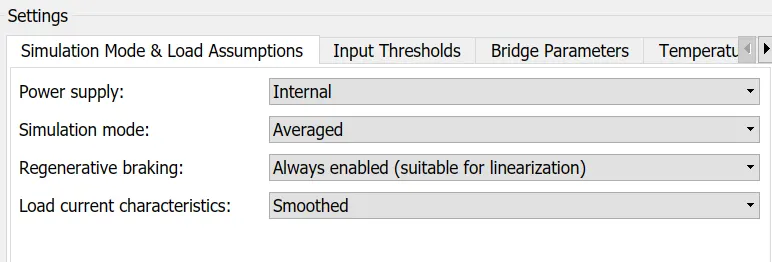
This is a power converter which is needed to provide power of correct from and magnitude from the component to other. The power converter is needed to provide a DC voltage from the battery of the Electric Vehicle to the DC motor.
Parameters:-
4] Brushed DC motor with thermal port:-
Block Symbol:-
Explanation:-
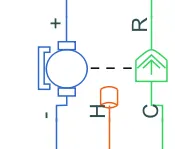
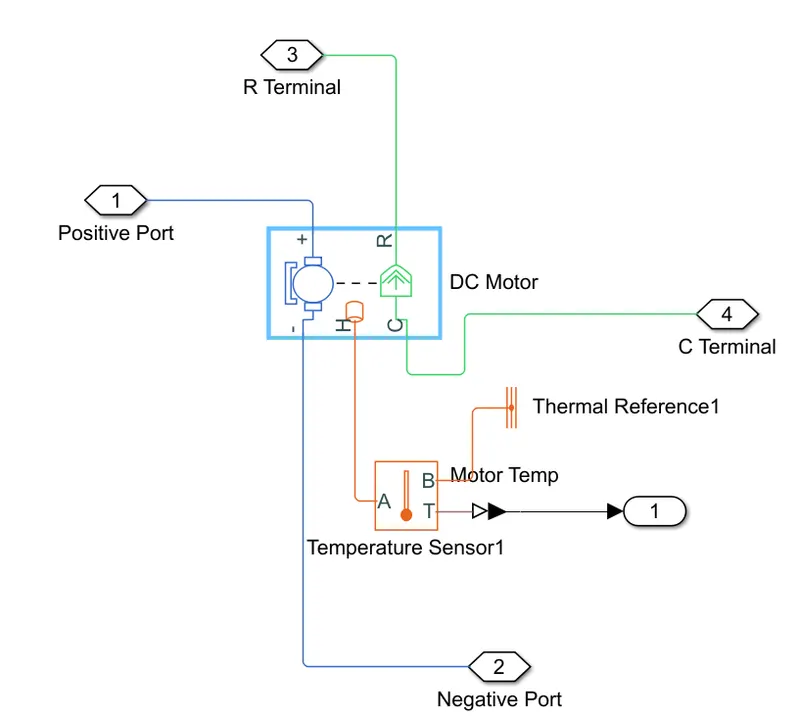
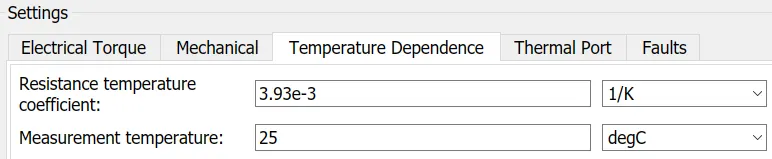
This block represents the electrical and torque characteristics of a DC motor. We have used permanent magnet DC motor. there are two side of in this block. The mechanical side is on the right and Electrical side is on the left. In mechanical side there are two port name as C and R port.C stand for Casing and R shand for rotor which is produce torque.The electrical side has a Positive and Negative terminal port for the voltage to be applied.When a positive current flows from the electrical + to - ports, a positive torque acts from the mechanical C to R ports. Motor torque direction can be changed by altering the sign of the back-emf or torque constants.
Subsystem:-
Block Parameters:-

5] Temperature Sensor:-
Block Symbol-
Explanation:-
The Temperature Sensor block represents an ideal temperature sensor, that is, a device that determines the temperature differential measured between two points without drawing any heat.
Connections A and B are thermal conserving ports that connect to the two points where temperature is being monitored. Port T is a physical signal port that outputs the temperature differential value.
The block positive direction is from port A to port B. The measured temperature is determined as T = TA – TB.
6] Vehicle Body:-
Block Symbol-
Explanation:-
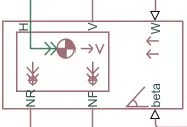
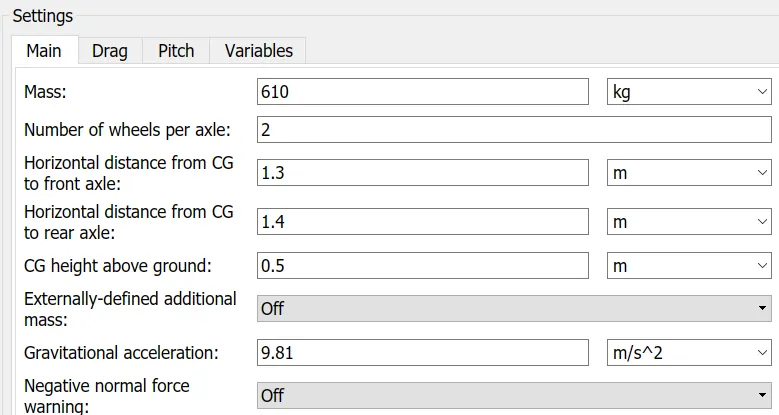
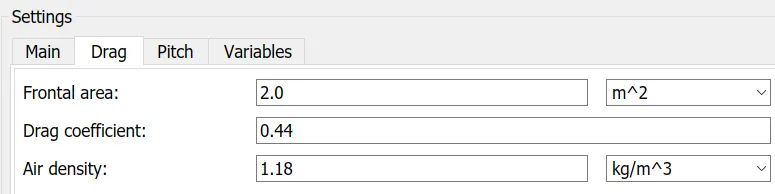
Above block shows that W, V, H NR, NF and beta are the six input and output physical signal ports or connections of the “vehicle body” block. Connections beta and W of the “vehicle body” block are the physical signal input ports associating to the road inclination angle and headwind speed respectively. Connections NF, NR and V of vehicle body block are the physical signal output ports associated with normal force on the front wheel, rear wheel and velocity of the vehicle respectively. Connection H of the “vehicle body” block is a translation conserving port associated with the horizontal movement. The “vehicle body model” block represents a two-axle vehicle along longitudinal dynamics, adjustable mass, drag properties, motion, and geometry. The axles have diferent wheel counts and same wheel in case of two wheel per axle.
Subsystem:-
Block Parameters:-
7] Tire (Magic Formula):-
Block Symbol-
Explanation:-
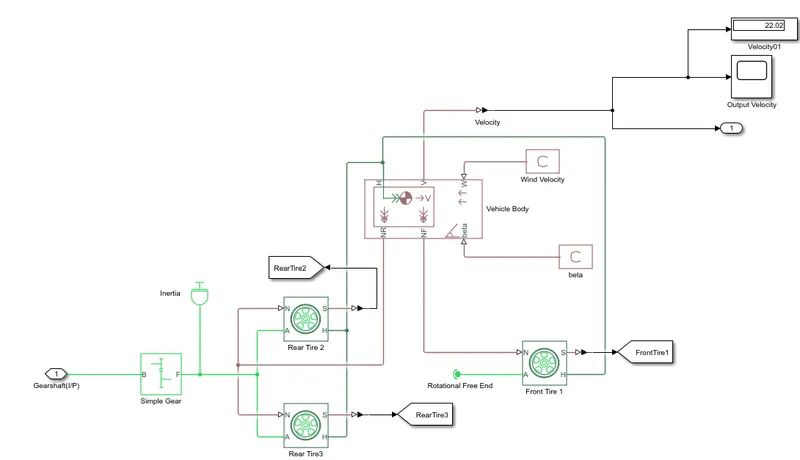
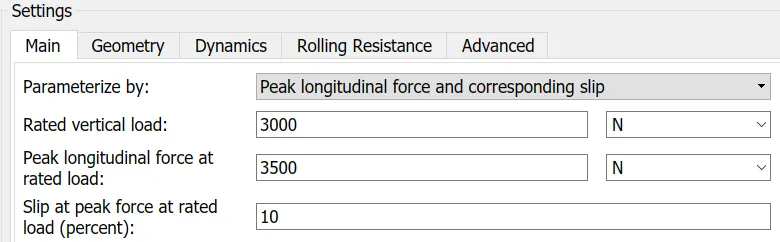
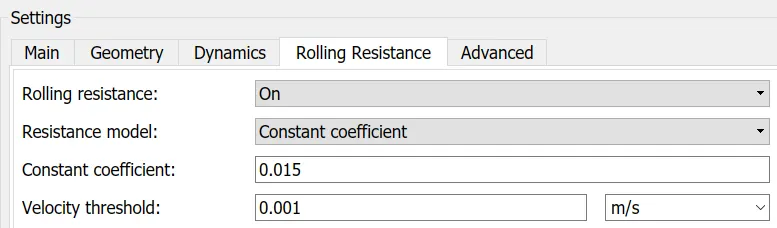
Above block shows that S, N, A and H are the input and output physical signal ports of each “tire block” for Simscape vehicle model. Connection N of tire block is associated with a normal input force on the tire. Connection N of the rear left, and right tire blocks are connected to NR port of vehicle body. Connection N of front tire block relates to port NF of the vehicle body. Connection A of rear wheel tire block belongs to the mechanical rotational port associated with the axle of the tire and connected to the diferential gear. H port of all tires is associated with machine translation and connected with H port of the vehicle body. Port S of all tire blocks are associated with the slip between tire and road is connected to PS Terminator block. The three-wheeled vehicle having the confguration of one front wheel and two rear wheels are considered for the present work. Magic formula tire block that represents a model of a tire with longitudinal behaviour given by an empirical equation based on four ftting coefcients is employed for Simscape vehicle modelling
Block parameters:-

8] Simple Gear Block:-
Block Symbol:-
Explanation:-
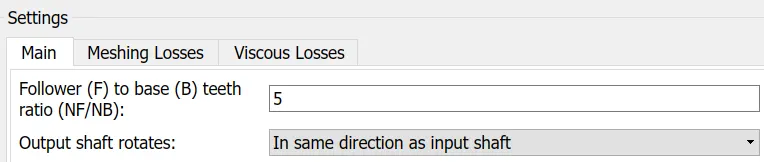
This block Represents a fixed-ratio gear or gear box. No inertia is modeled in this block. You can optionally include gear meshing and viscous bearing losses. In this block two port B port and F port. B stand for Base and F stand for follower. This port are mechanical rotational conserving ports.
Block parameters:-
9] Lithium-Ion Battery:-
Block Symbol:-
Explanation:-
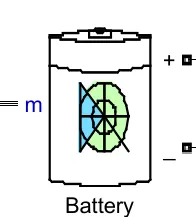
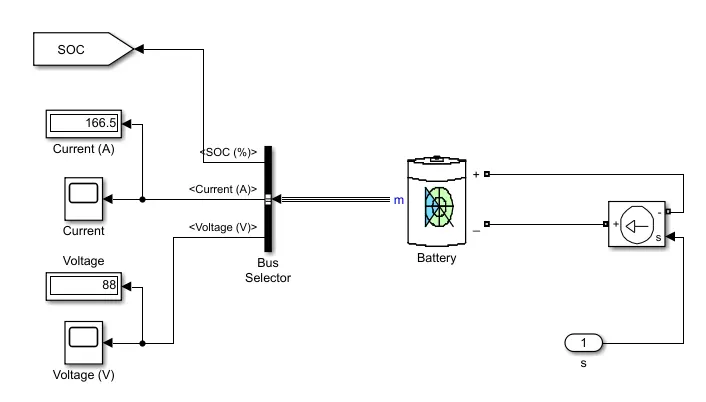
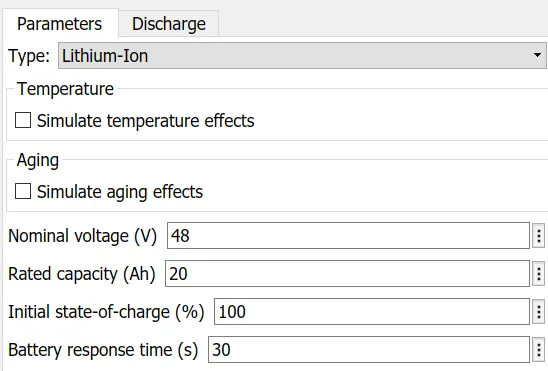
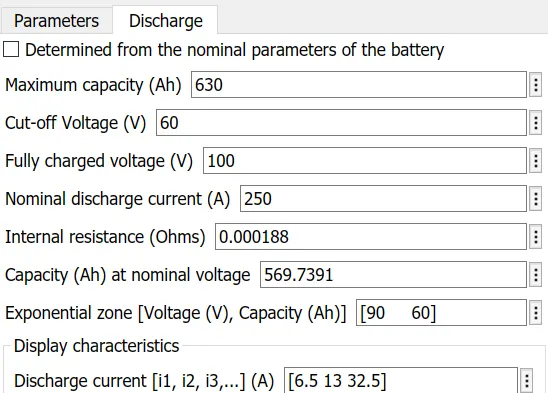
This battery is used for most popular battery types.Temperature and aging effect can be specified for Lithium Ion battery type. This battery give direct State of Charge (SOC %).
Subsystem:-
Block Parameters:-
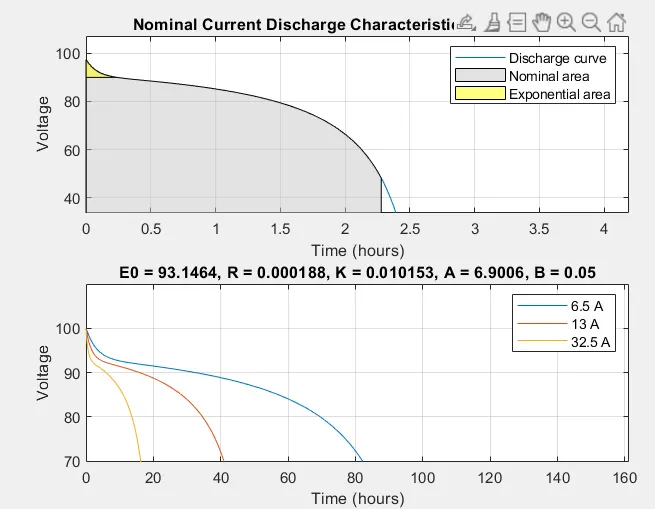
Battery Discharge characteristics:-
10] Multiport Switch:-
Block Symbol:-
Explanation:-
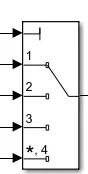
This block has a left side multi port input signal and one output port signal.the input signals corresponding to the truncated value of the first input. The inputs are numbered top to bottom (or left to right). The first input port is the control port. The other input ports are data ports.
11] Signal Builder:-
Block Symbol:-
Explanation:-
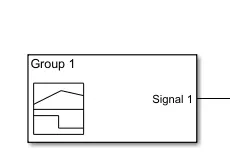
This block is used to create build for signal input.
Signal:- 1
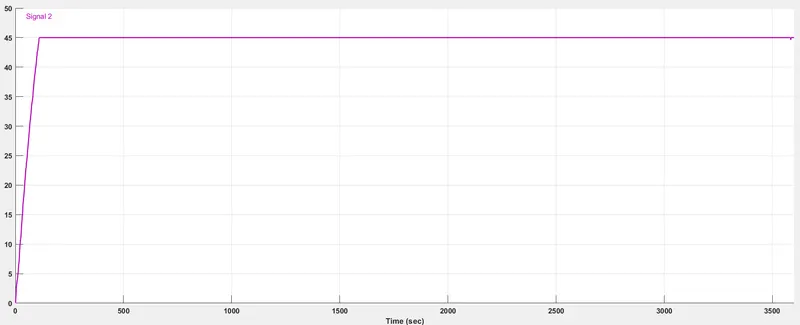
Signal:- 2
12] Drive Cycle Source:-
Block Symbol:-
Explanation:-
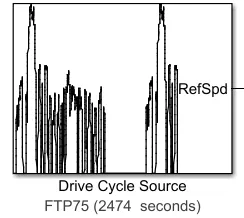
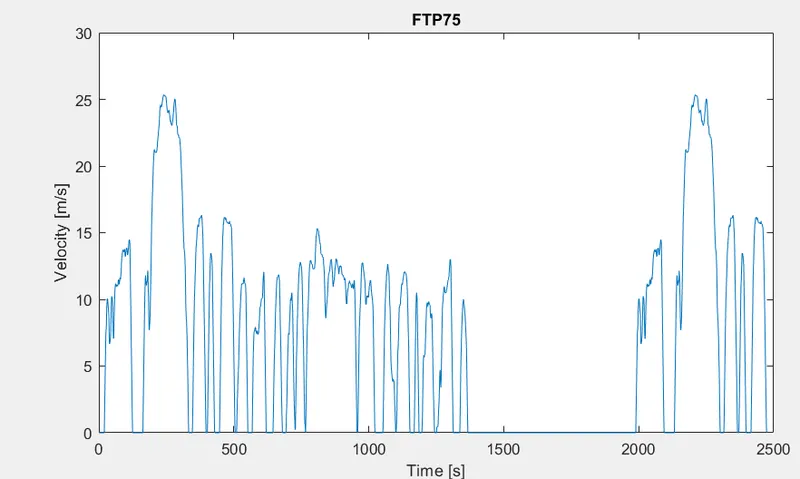
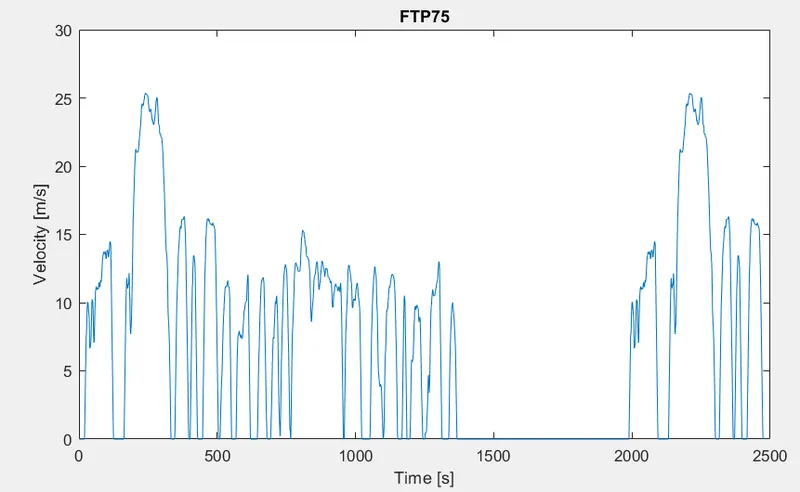
The Drive Cycle Source block generates a standard or user-specified longitudinal drive cycle. Drive cycles from predefined sources. By default, the block includes the FTP–75 drive cycle.The block output is the specified vehicle longitudinal speed, which you can use to::-
1) Predict the engine torque and fuel consumption that a vehicle requires to achieve desired speed and acceleration for a given gear shift reference.
2) Produce realistic velocity and shift references for closed loop acceleration and braking commands for vehicle control and plant models.
3) Study, tune, and optimize vehicle control, system performance, and system robustness over multiple drive cycles.
4) Identify the faults within tolerances specified by standardized tests, including:-EPA dynamometer driving schedules and Worldwide Harmonised Light Vehicle Test Procedure (WLTP) laboratory tests.
Plotting Drive Cycle:-
13] Current Sensor Block:-
Block Symbol:-
Explanation:-
This block represents an ideal current sensor. It used a device that converts current measured in any electrical branch into a physical signal proportional to the current.In this block there are three port. The current in the battery circuit and the DC motor.in this block two terminal port name as Positive and Negative terminal across which the current sensor is inserted in to the circuit.The 3rd port output the physical signal.
14] Controlled Current Source:-
Block Symbol:-

Explanation:-
This block represents an ideal current source that is powerful enough to maintain the specified current through it regardless of the voltage across it. The output current is I = Is, where Is is the numerical value presented at the physical signal port.
15] Controlled Voltage Source:-
Block Symbol:-

Explanation:-
This block represents an ideal voltage source that is powerful enough to maintain the specified voltage at its output regardless of the current passing through it. The output voltage is V = Vs, where Vs is the numerical value presented at the physical signal port.
16] Solver Configuration Block:-
Block Symbol:-
Explanation:-
Each physical Simscape™ block Network requires exactly one “Solver Confguration” block to be connected to specifes the solver parameters that your model needs before you can begin the simulation.
17] Electrical Referance:-
Block Symbol:-
Explanation:-
The Electrical Referance block repesent an electrical ground. electrical port of the block are directly connected to ground.
18] Mechanical Rotational Reference:-
Block Symbol:-
Explanation:-
The “mechanical rotational reference” block act as a reference point or frame (ground) for all mechanical rotational ports that are rigidly clamped.
19] Simulink-PS Converter:-
Block Symbol:-

Explanation:-
This block is used to Converts the Simulink input signal to a Physical Signal.
20] PS-Simulink Converter:-
Block Symbol:-

Explanation:-
The working of the “PS-Simulink” block is to convert the physical signal into a Simulink signal for simulation.
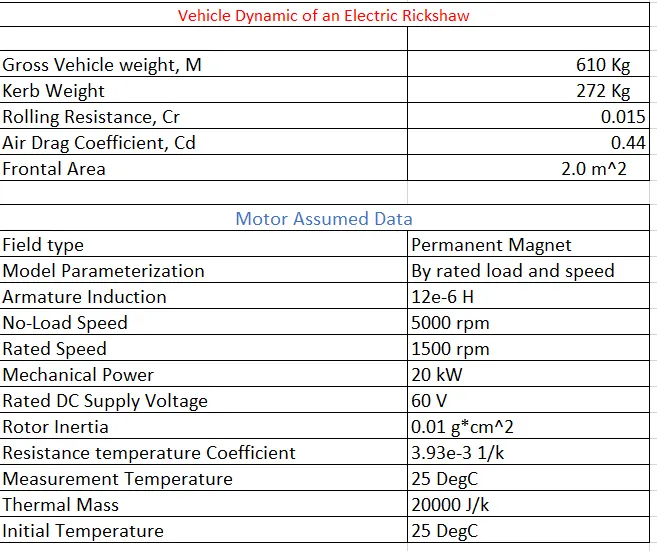
Excel File Data:-
Drive Cycle 1 Result:-
FTP75 Drive Cycle Source:-
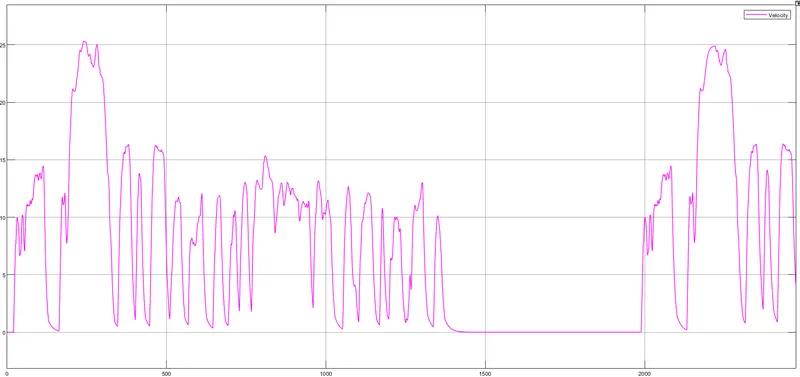
Velocity Graph:-
Graph for Motor and H-bridge Temperature:-
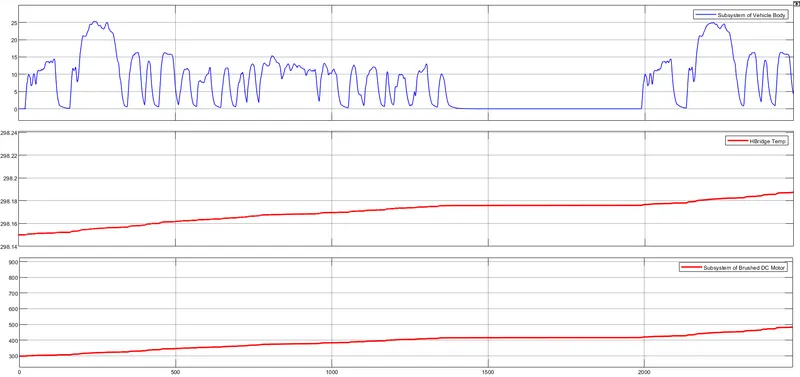
In the H-Bridge graph- The Temperature at initial start from 298.15 K and we have run then the run the model the thermal temperature increases reaches at 298.19 K.
In the Motor graph- The Temperature at initial start from 298.15 K and after run model for 2474 sec. The Thermla temperature of motor increases and reaches at 450 K.
Graph for Distance Covered by Vehicle:-
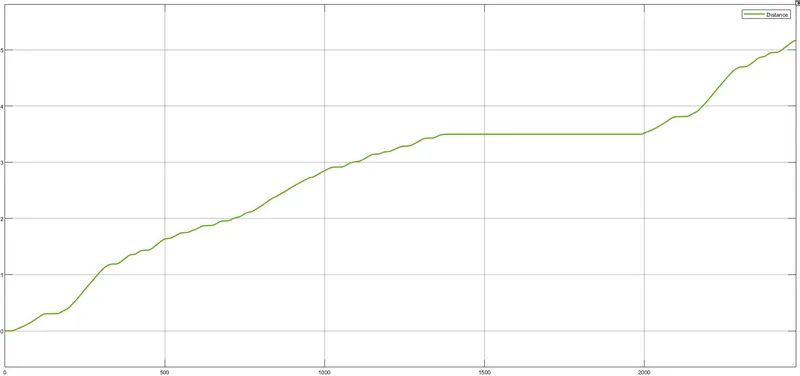
Above Graph shown for the Vehicle covered Distance in Km. When the vehicle is start and run for our simulation model for 2474 second.The Vehicle covered distance 5.165 Km in one cycle completed in 2474 Sec.
Graph for State of Charge (SOC):-
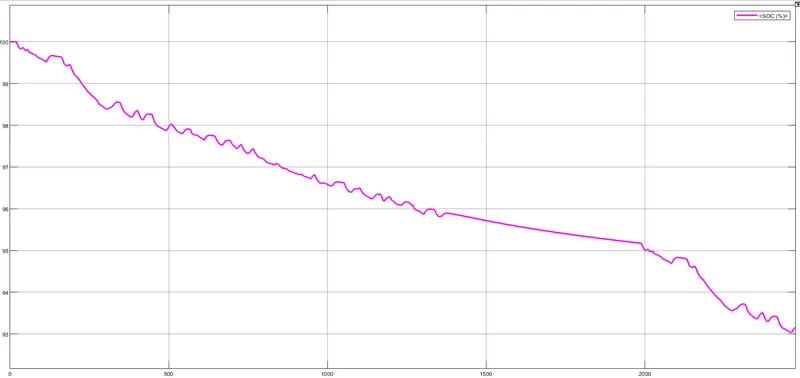
Above graph shown the State of Charge (SOC). Initial State of Charge 100 %. When the run the simulation for 2474 Sec. State of charge reducing at reaches 93.14 %. The Battery discharge 6.86%.
Graph for Current (A):-
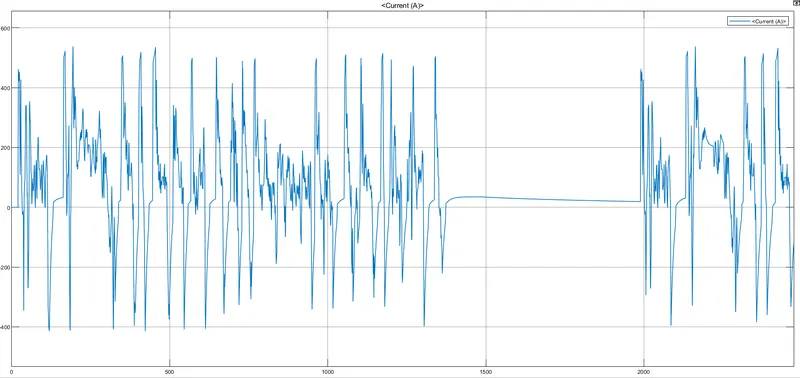
Above graph shown the current (A). Assumed a constant source voltage of 48 V the Source current is calculated and as shown in above ghraph.We can see in graph when the load applied the current flowing Positive and Negative value and end at -122.7. The Positive value is 450 A and The Negative value is -420 A.
Graph for Voltage (V):-
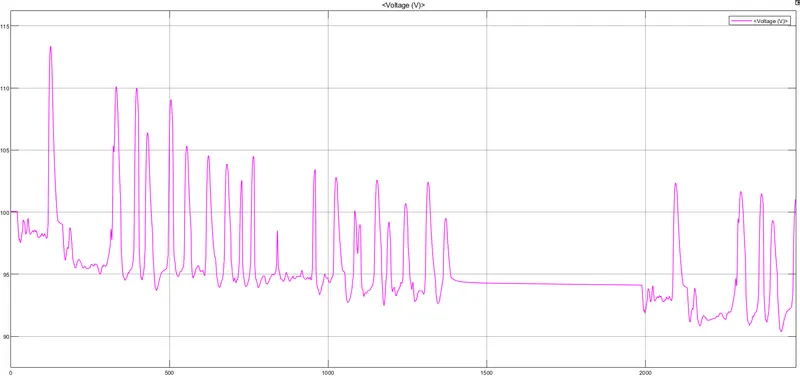
Above graph shown the Voltage (V). We have Run the model the Voltage source give to inverter from the battery pack. Then the Voltage send to motor and vehicle is movement. We can see in graph the voltage first initial start from 100 V and got to reducing voltage and end the drive cycle time the voltage at end 101 Voltage.
Drive Cycle 2 Result:-
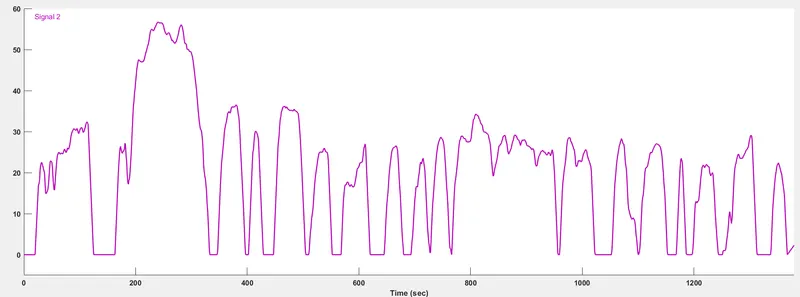
Graph for Created Signal in Signal Builder Block:-
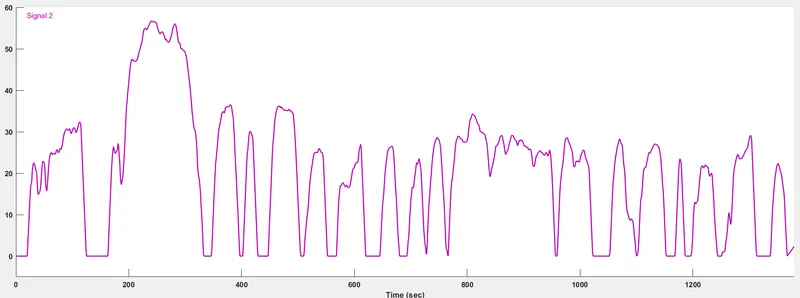
In this plot we have give the maximum speed 58 Km/h and time give 1370 Sec.
Plot of Velocity:-
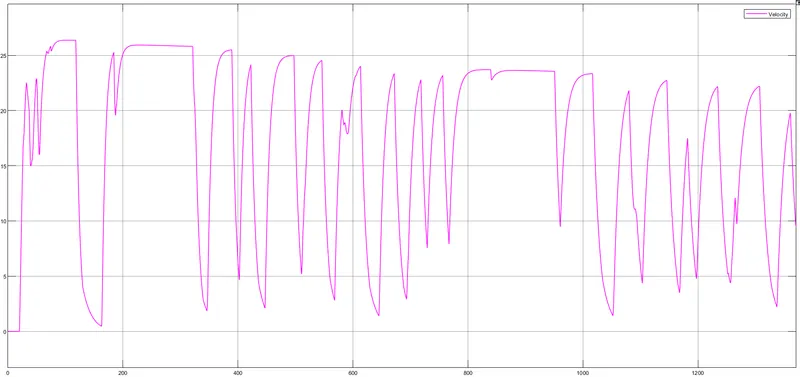
In above graph the simulation start for 1370 sec the start form 0 Km/h the maximum velocity reaches at 25.4 Km/h.
Plot of Motor, H-Bridge Temperature:-
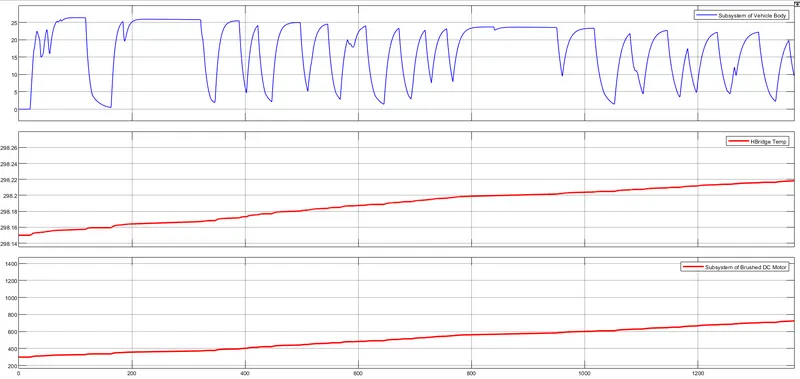
In the H-Bridge graph- The Temperature at initial start from 298.15 K and we have run then the run the model the thermal temperature increases reaches at 298.22 K.
In the Motor graph- The Temperature at initial start from 298.15 K and after run model for 2474 sec. The Thermla temperature of motor increases and reaches at 650 K.
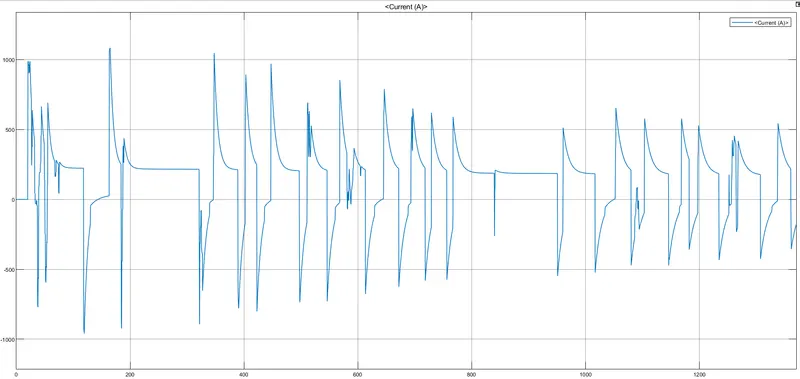
Plot of Current (A):-
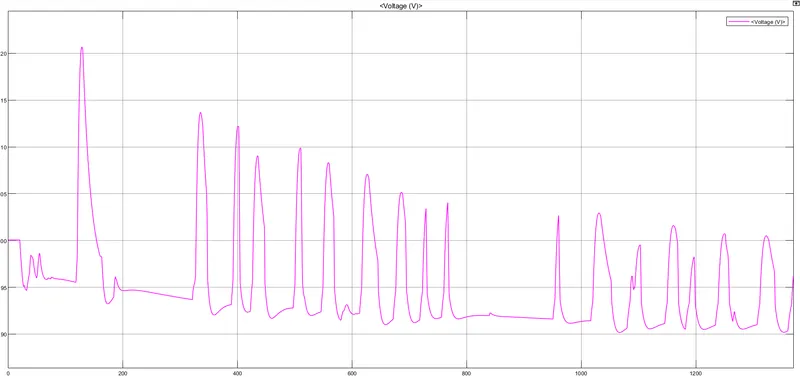
Plot of Voltage (V):-
Plot of State of Charge (SOC %):-
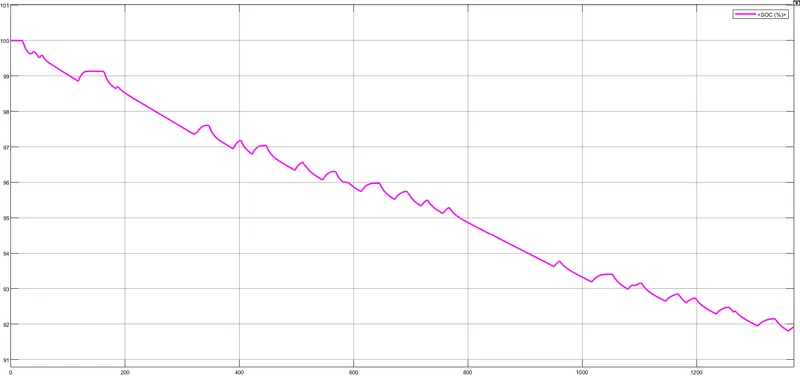
Above graph shown the State of Charge (SOC). Initial State of Charge 100 %. When the run the simulation for 1370 Sec. State of charge reducing at reaches 91.91 %. The Battery discharge 8.09%.
Plot of Distance Covered by Vehicle:-
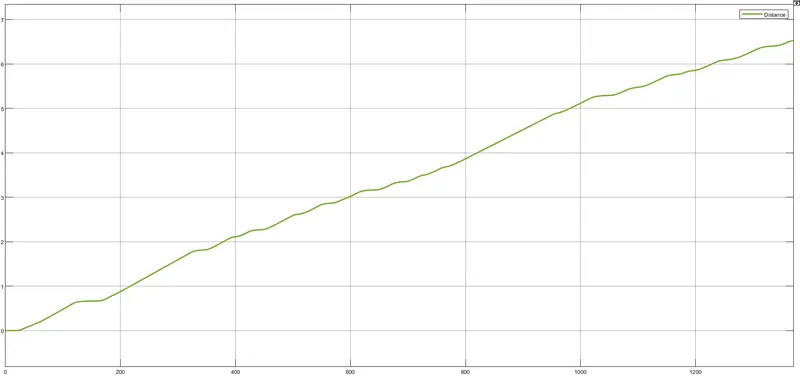
Above Graph shown for the Vehicle covered Distance in Km. When the vehicle is start and run for our simulation model for 1370 second.The Vehicle covered distance 6.529 Km in one cycle completed in 1370 Sec.
Drive Cycle 3 Result:-
Graph for Created Signal in Signal Builder Block:-
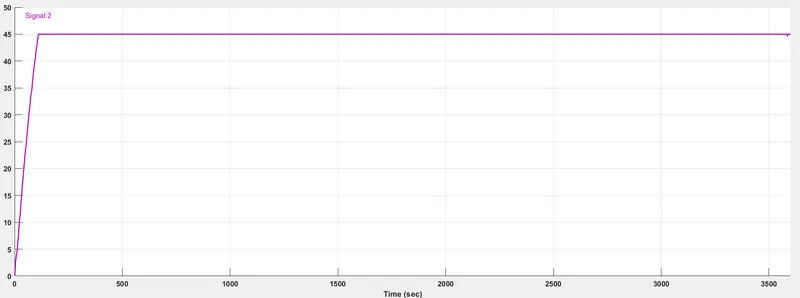
Above plot shown the Speed Vs time , The we have increases speed with respect to time and at 45 km/h the run model from 3600 sec.
Plot of Velocity, Motor and H-Bridge Temperature:-
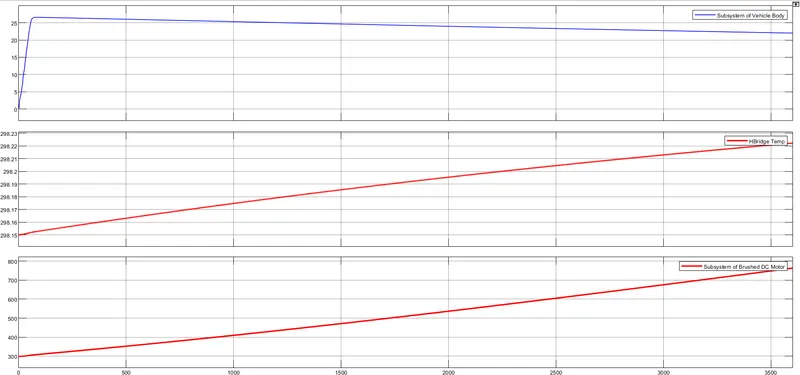
In the H-Bridge graph- The Temperature at initial start from 298.15 K and we have run then the run the model the thermal temperature increases reaches at 298.23 K.
In the Motor graph- The Temperature at initial start from 298.15 K and after run model for 3600 sec. The Thermla temperature of motor increases and reaches at 790 K.
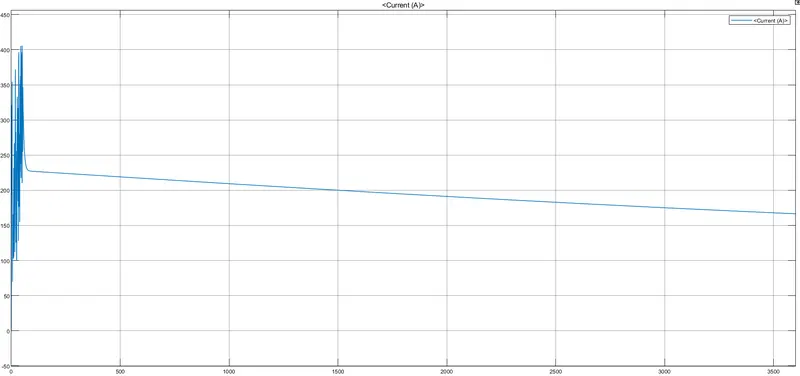
Plot of Currrent (A):-
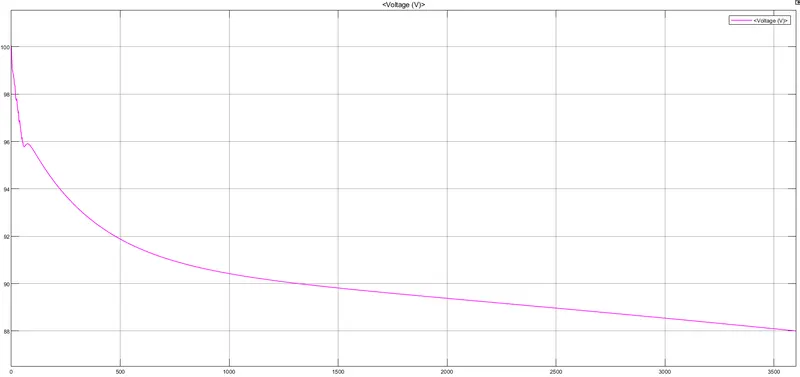
Plot of Voltage (V):-
Plot of SOC %:-
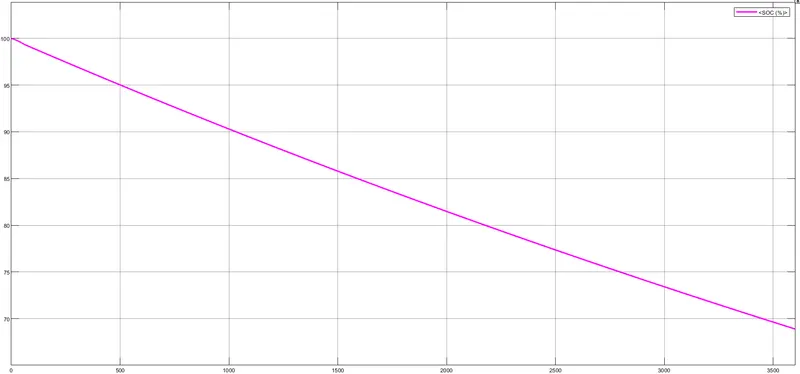
Above graph shown the State of Charge (SOC). Initial State of Charge 100 %. When the run the simulation for 3600 Sec. State of charge reducing at reaches 68.9 %. The Battery discharge 31.1%.
Plot of Distance Covered by Vehicle:-
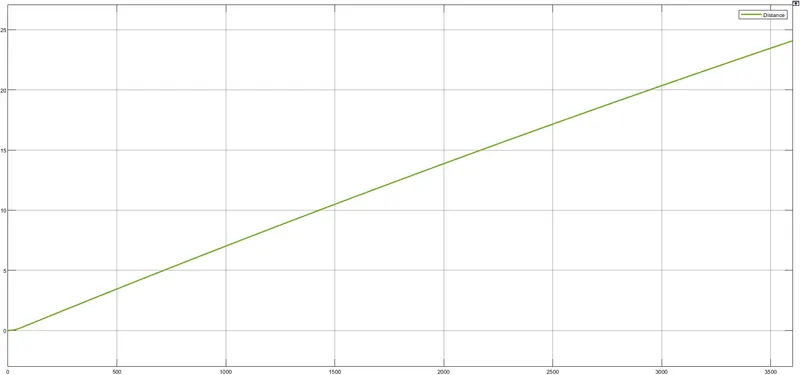
Above Graph shown for the Vehicle covered Distance in Km. When the vehicle is start and run for our simulation model for 3600 second.The Vehicle covered distance 24.09 Km in one cycle completed in 3600 Sec.
Drive Cycle 4 Result:-
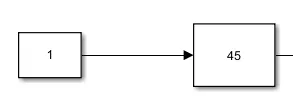
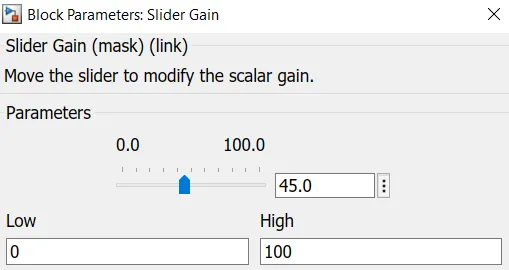
Used Slider Gain Block:-
Plot of Velocity, Motor and H-Bridge Temperature:-
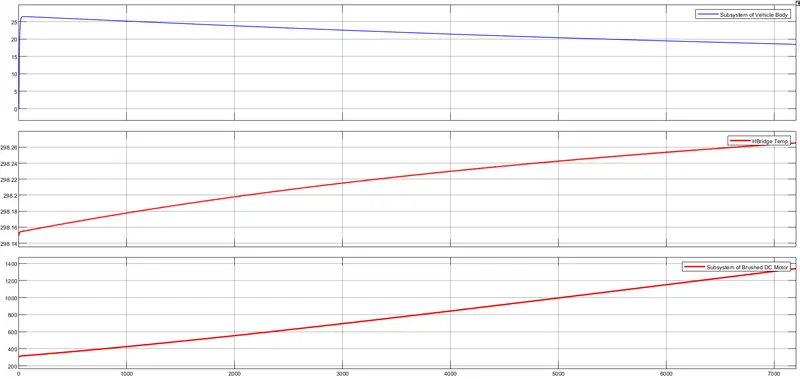
In the H-Bridge graph- The Temperature at initial start from 298.15 K and we have run then the run the model the thermal temperature increases reaches at 298.27 K.
In the Motor graph- The Temperature at initial start from 298.15 K and after run model for 3600 sec. The Thermla temperature of motor increases and reaches at 1350 K.
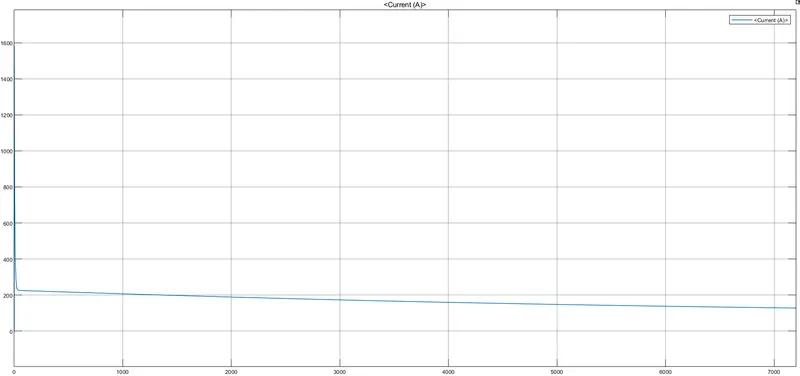
Plot of Current (A):-
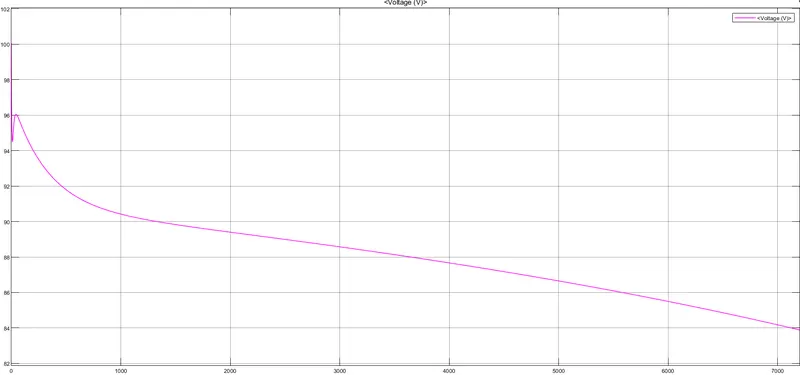
Plot of Voltage (V)
Plot of State of Charge (SOC %):-
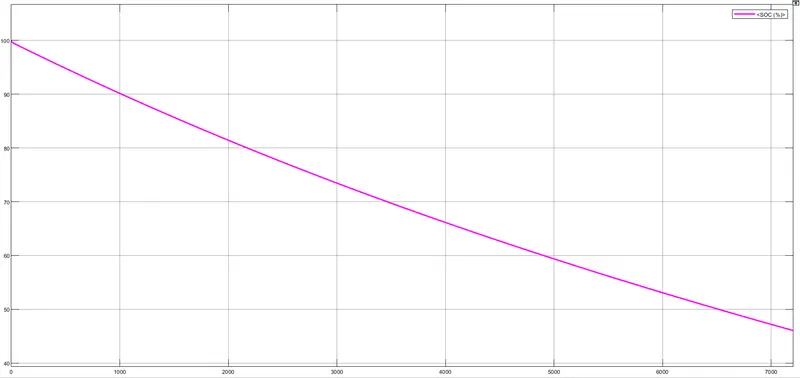
Above graph shown the State of Charge (SOC). Initial State of Charge 100 %. When the run the simulation for 7200 Sec. State of charge reducing at reaches 46.09 %. The Battery discharge 53.91%.
Plot of Distance Covered By Vehicle:-
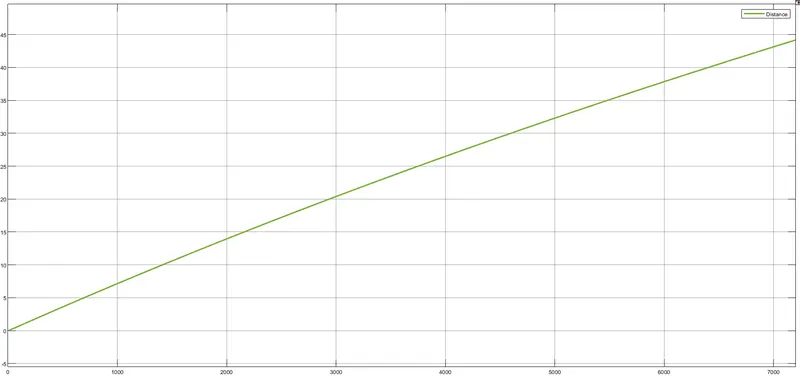
Above Graph shown for the Vehicle covered Distance in Km. When the vehicle is start and run for our simulation model for 7200 second.The Vehicle covered distance 0 to 44.17 Km in one cycle completed in 7200 Sec.
Conclusion:-
We have create a model of Electric Three Wheeler vehicle which is used Battery and a Rear wheels driven by PM brushed type motor using the Simulink Software is done.We have done the model for Different Three types of Input Drive Cycle.