Final Project: Design of an Electric Vehicle
Create a MATLAB model of electric car which uses a battery and a DC motor. Choose suitable blocks from Powertrain block set. Prepare a report about your model including following:
Objectives:
1. System level configurations
2. Model parameters
3. Results
4. Conclusion
Solution:
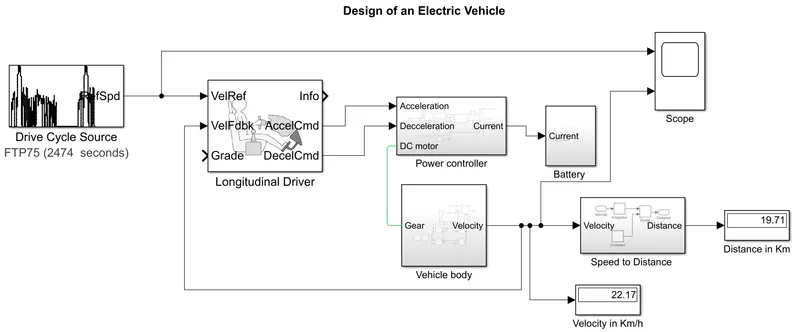
- An electric vehicle mainly consists of four parts which are consider as crucial while designing those are: Drive Source, Motor and its Power controller, Battery and Vehicle Body.
- Based on this image will create MATLAB model considering different subsystems.

- For btter understanding a subsystem is created for each part under which detailed designing is done keeping parameters in mind.
- Below is shown MATLAB model of an Electric vehicle.
- As per above discussion briefing each of the subsystem, starting with vehicle body.
- Below is shown the image of subsystem of Vehicle body.
1. Vehicle Body subsystem:
- Here input is receiving from DC motor which is present in Power controller subsystem.
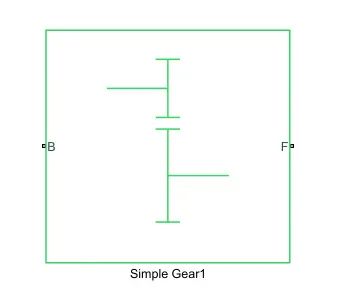
- Simple gear is the ratio of motor speed to driven wheels which we kept as 1 here.
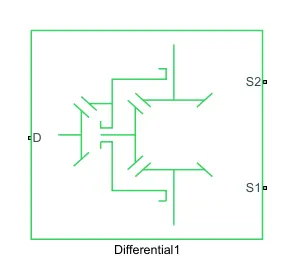
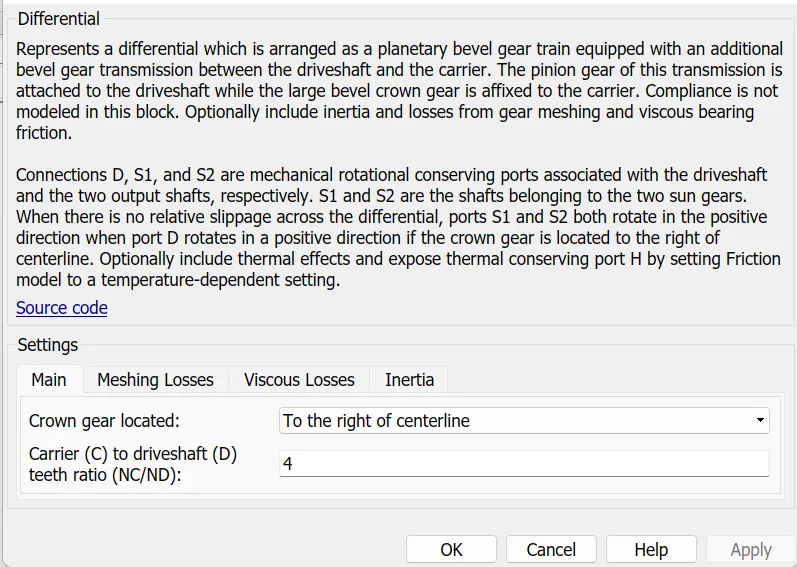
- After gear, differential block is used for providing tractive force equally to front and rear wheels.
- For vehicle body we have not considered any gradient and wind effect such that its showing 0 value on display.
- Output of this subsytem is velocity which is converted into Km/hr by adding gain block of value 3.6
- Below is shown the parameters of various blocks used in this subsystem.
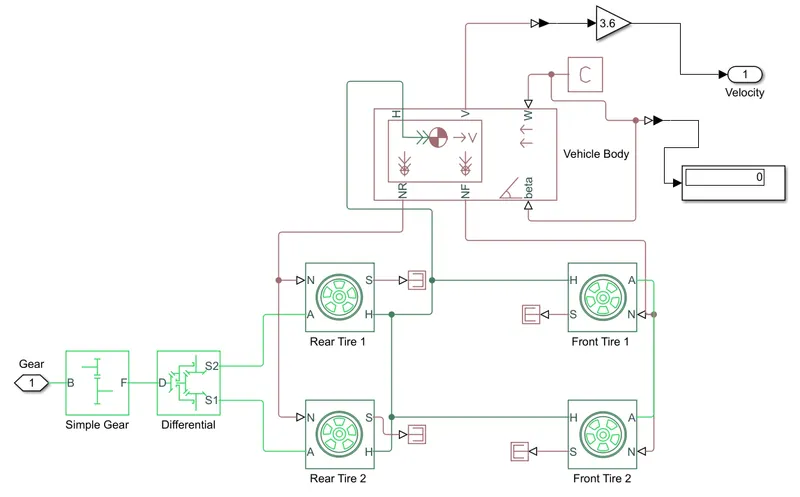
Main blocks used in this subsystem are as: Tire Magic, Vehicle body, Simple gear and Differential.
Vehicle Body:
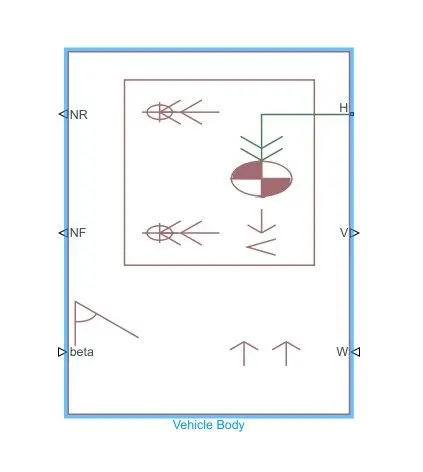
- Beta: It is a input port which represents a inclination angle in radians.
- W: Here the letter W means wind so to create any wind speed effects (in m/s) input signal is provided on this port.
- V: This is the output port represents velocity of the vehicle (in m/s).
- H: Output port represents horizontal movement of tires.
- NR & NF: These two are output ports which represents axle force applied on rear and front tire, which is considered as braking.
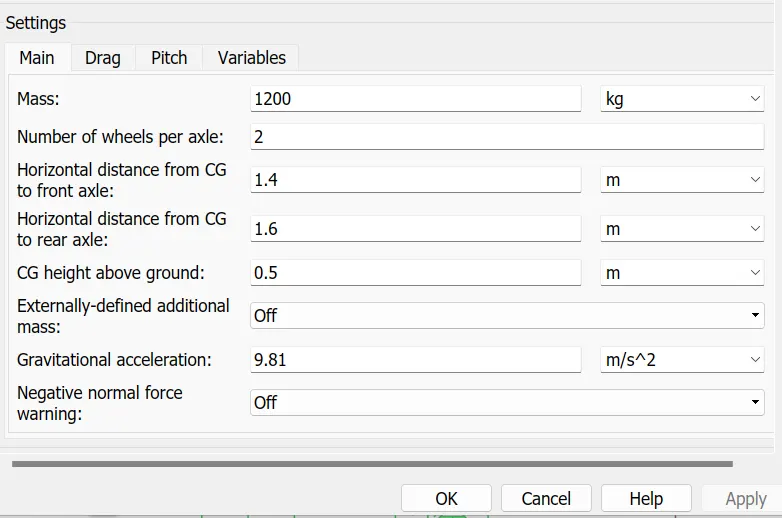
Paramters adjusted in this block:
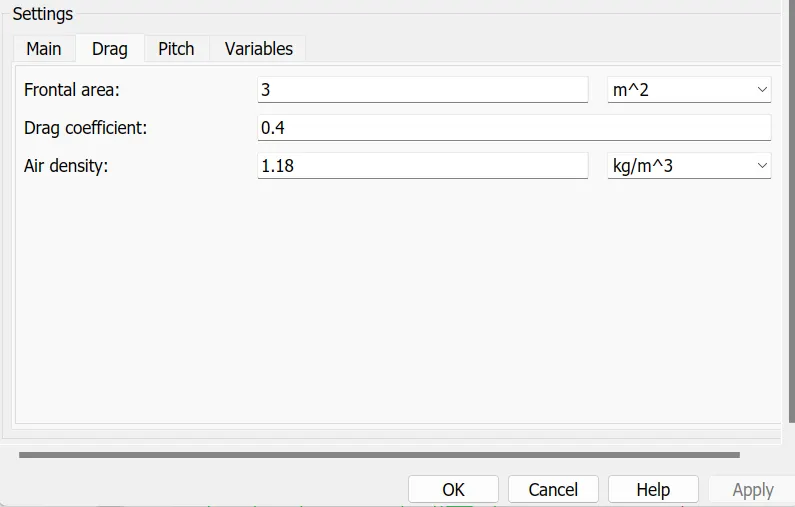
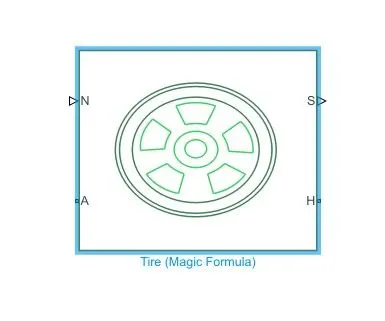
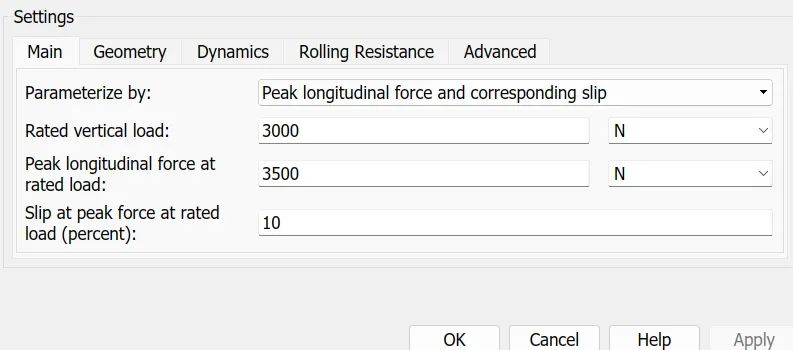
Tire block: It represents longitudinal behaviour of highway.
Simple Gear: It represents fixed gear ratio or gear box for transmission of tire.
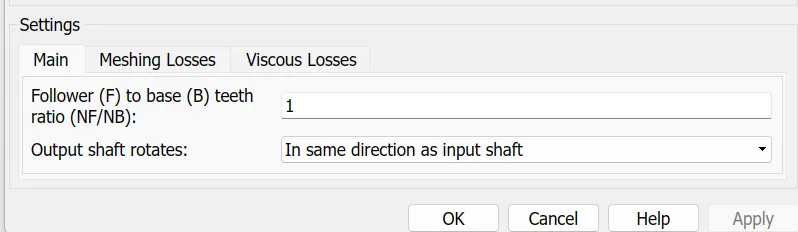
Differential:
2. PowerController subsystem:
- From longitudinal driver we receive 2 inputs which are Acceleration and decceleration which is shown here as input 1 and 2.
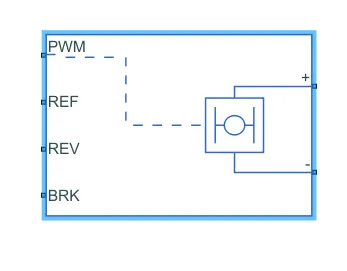
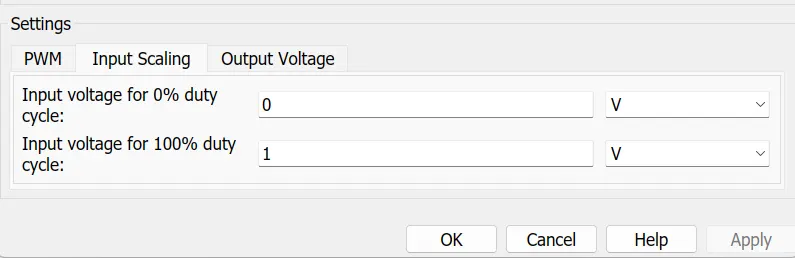
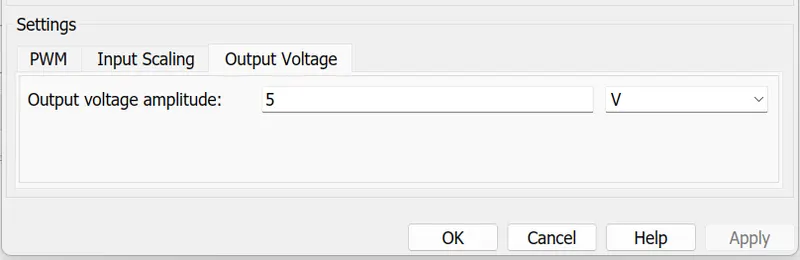
- Controlled PWM voltage block is used to create PWM voltage from the controlled voltage source, when pulse is low output voltage is zero, and its high when pulse is equal to output voltage.
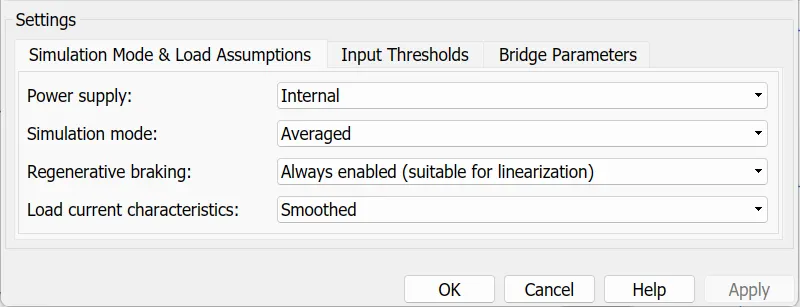
- H-bridge is the power converter used in this model which will fetch power from battery via Controlled PWM voltage block and deliver to DC motor as per the requirements.
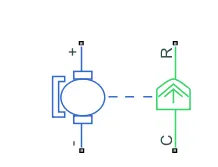
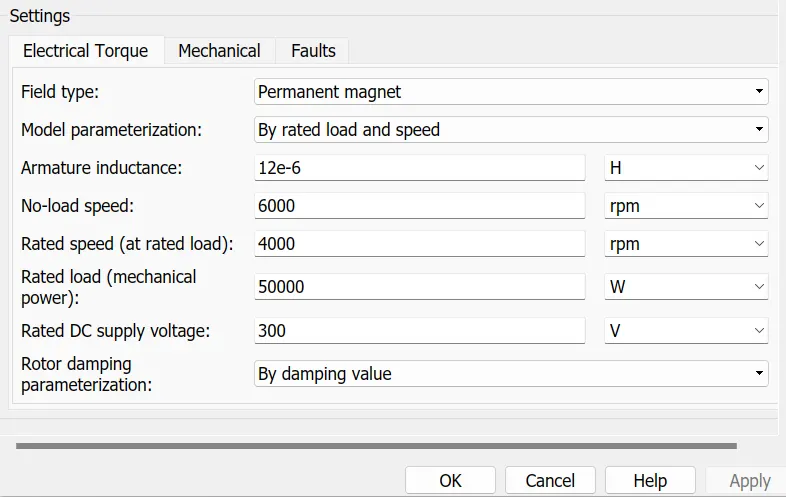
- DC motor is used of 50KW, with rated DC supply voltage of 300V output of this motor is feed to gear in above discussed subsystem.
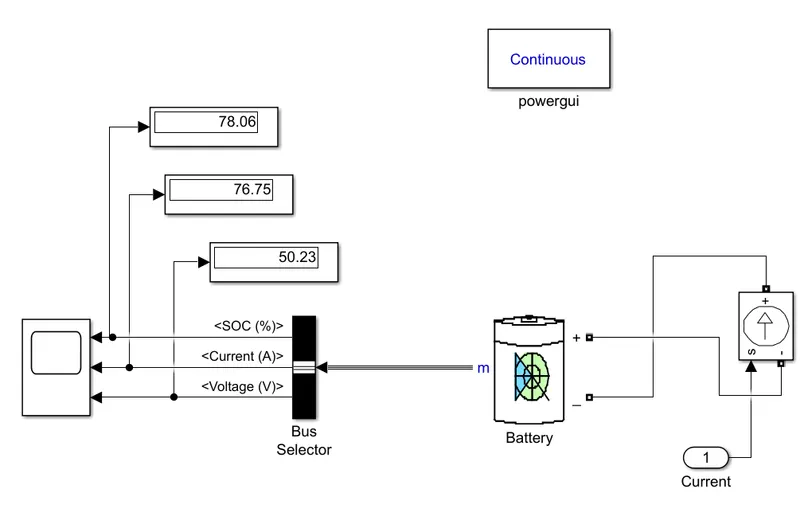
- Second output from current sensor is feed to controlled current source block in battery subsystem.
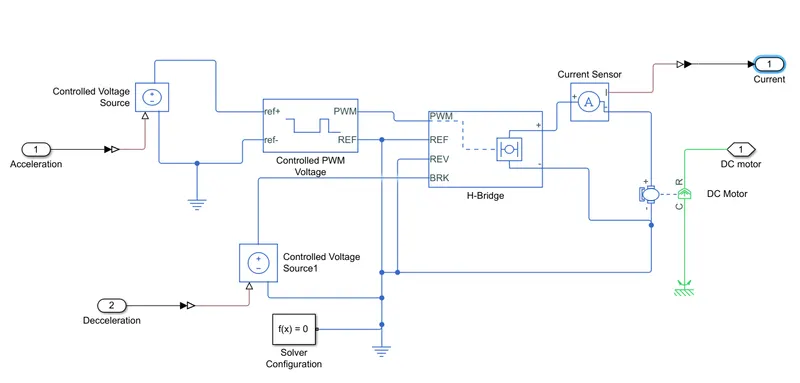
Main blocks used in this subsystem are as: DC motor, Controlled PWM Voltage and H-bridge
DC Motor:
H-bridge:
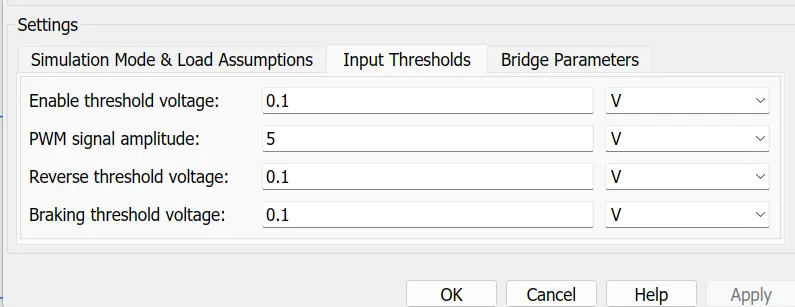
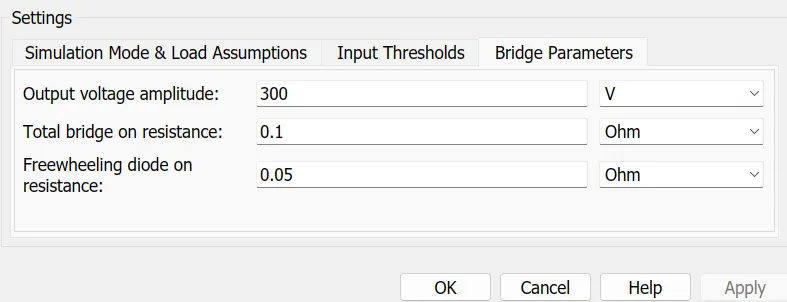
Controlled PWM Voltage:
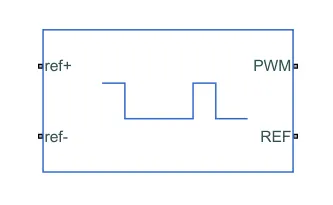
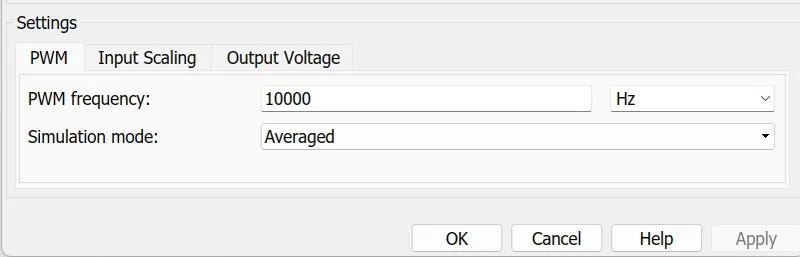
3. Battery subsystem:
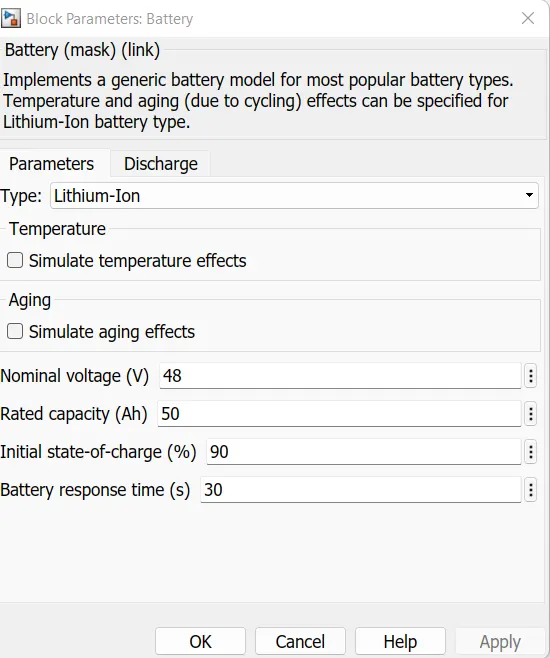
- Lithium-ion battery is used of 50Ah capacity with nominal voltage of 48V.
- This battery pack is used for storing the energy in vehicle, during acceleration it helps to drive DC motor.
- Where as in decceleration mode with the use of regenrative mode of braking these batttery gets charged by DC motor.
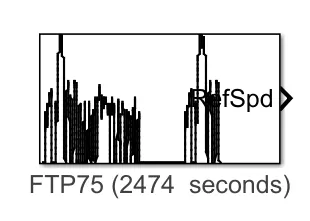
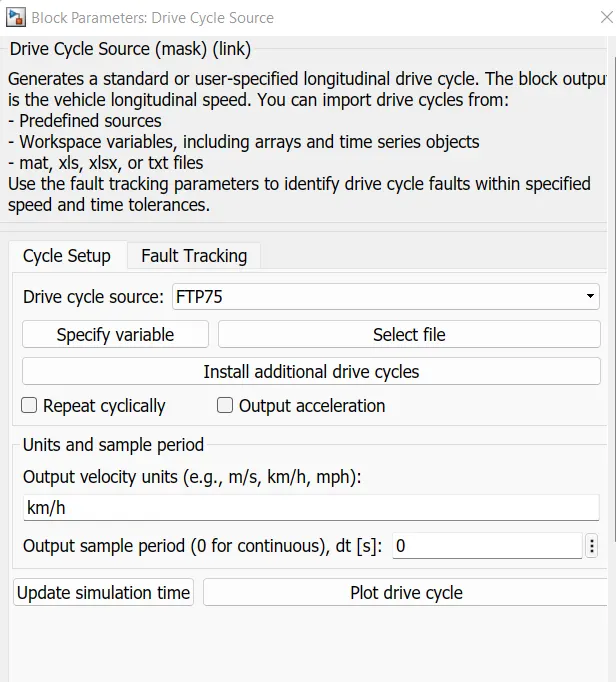
4. Drive Source:
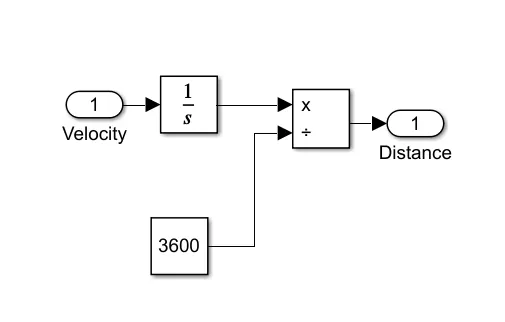
Speed to Distance:
This subsystem is used to derive distance (Km) from speed (Km/hr) just for observation by using integrator, constant and divide block
List of other small blocks used in this model are as follows:
- Longitudinal driver
- Controlled voltage source
- Controlled current source
- Currnt sensor
- PS terminator
- PS constant
- Gain
- Constant
- Divide
- Integrator
- PS-Simulink converter
- Scope
RESULTS:
Conclusion:
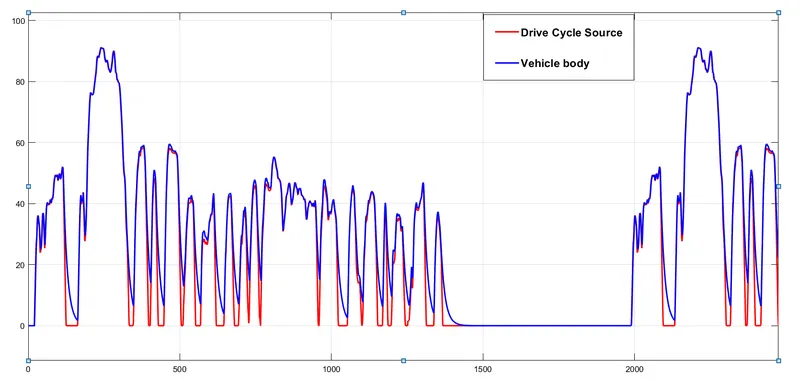
- From first result which is comparison of input data and the actual distance covered by an EV which is observed that actual data is very close to input one.
- It is seen that when FTP75 was touching 0 axis that time actual drive cycle didnt reached.
- FTP75 drive cycle is 17.7Km where as actual drive cycle has covered couple of Kms more in 2474 seconds.
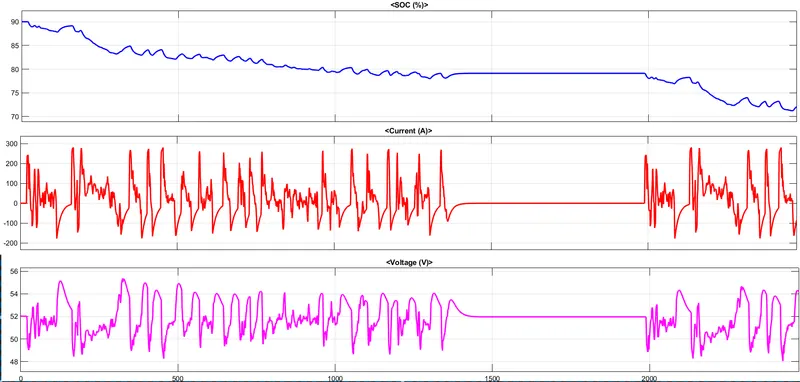
- In second result there are total 3 graphs taken from battery block those are: SOC, Current and Voltage.
- SOC: State of charge at the end of Drive cycle has reached to near about 70% and also few spikes are observed in this which is because of regenerative braking.
- Range of current is from -190 to 290A which is related to decceleration and acceleration reapectively.
- Spikes seen in voltage needs to lower down which can bring more reliability to vehicle.