Week-4 Challenge WOT Condition Part-2
1. What is the difference between mapped and dynamic model of engine, motor and generator? How can you change model type?
Solution:
The Powertrain blockset has two types of combustion engine models such as: Mapped model and Dynamic model.
Main difference between Mapped model and Dynamic model are stated below:
Mapped model:
- This model is also known as static model in which datas are inserted in the form of look up tables most preferrably 1-D 0r 2-D lookup table.
- It is mostly used for anaysis and design purpose which do not requires more subsystem blocks.
- The rate of convergence for this modelis fast compared to Dynamic model.
Dynamic model:
- This model is comparatively slow while running as it uses real time data.
- It takes care of dynamic characteristics while designing and anyalysis data.
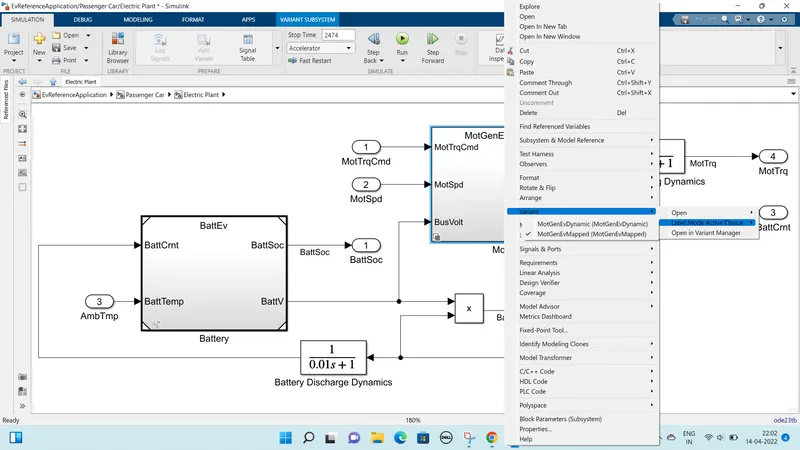
Now to convert mapped model to dynamic model following are the steps:
- Open the EV reference model.
- Click on the Passanger block set, inside that click on Electric plant.
- In electric plant blockset, right click on Motor block under which select Variant go to Label Motor active choice it has two options select any desired one.
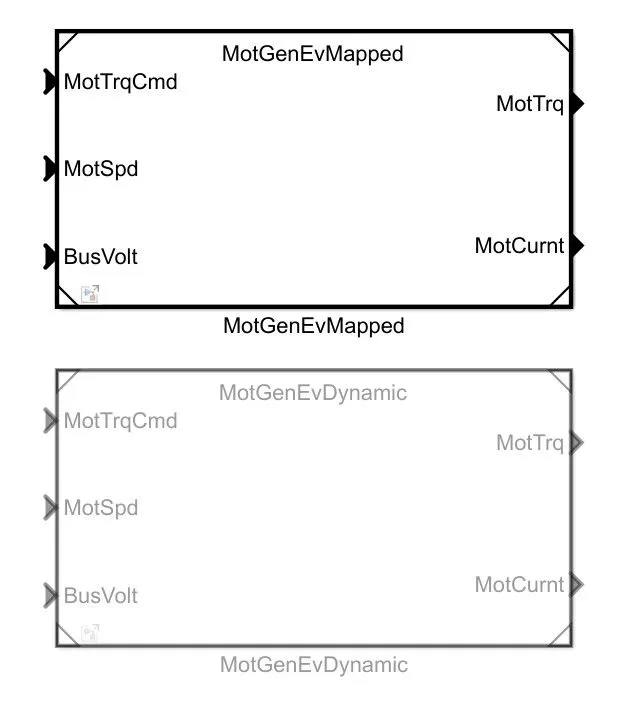
- Double click on Motor block inside that two blocks will be seen as: MotGenEvMapped and MotGenEvDynamic
- Whichever block is active will be seen as dark and other one will have light border.
2. How does the model calculate miles per gallon? Which factors are considered to model fuel flow?
Solution:
- Miles per gallon(mpg) is the number says how much miles a vehicle can run in per gallon of fuel, this decides the efficiency of fuel for engine vehicle
- Now for electric vehicles alternate of fuel is electric energy so for that to get the efficiency of electric vehicles mpg is converted to mpge thar is miles per gallon equivalent is used. This number decides how much of electricity is required equivalent to fuel.
- As per (EPA) Environmental Progress Agency 1 gallon of gas is equivalent to 33.7Kwh amount of electric energy.
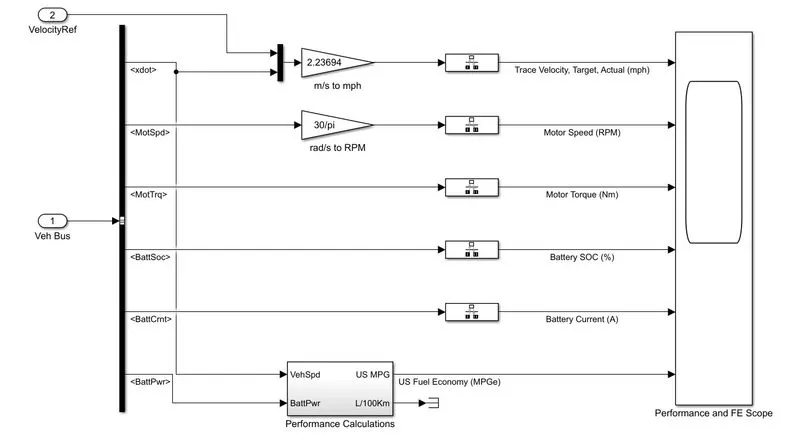
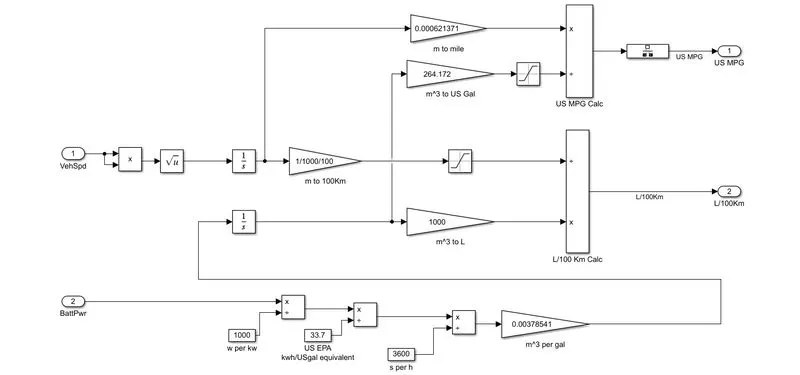
To calculate mpg value open the visualization block in EV reference application model which is shown below. Double click on Power calculations block which will show the calculation using mathematical operators.
Here 2 inputs are taken:
- First is vehicle speed which is in m/s and it is converted to distance in metres by integrating it wrt to time. Then distance in metres is converted to miles by multiplying it with constant 0.000621371.
- Second input is battery in Wh which is converted to first KWh and then divided by 33.7 and then again divide by 3600 this we got in gallon equivalent per seconds.
- Now convert the above unit into cubic metre per gallon by multiplying it with 0.00378541. Integrate the value and multiply it by constant value of 264.172 this converts it to US gallon.
- Divide the second term with first one which will give the result as miles per gallon.
3. Run the HEV ReferenceApplication with WOT drive cycle. Change the grade and wind velocity in the environment block. Comment on the results.
Solution:
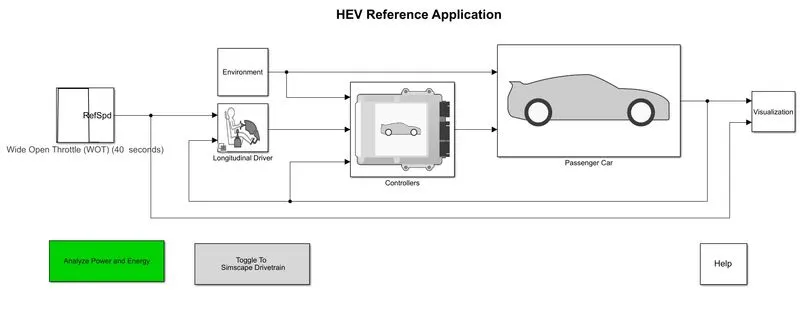
- HEV reference application is selected from HELP section under search option of GET STARTED WITH POWERTRAIN BLOCK SET
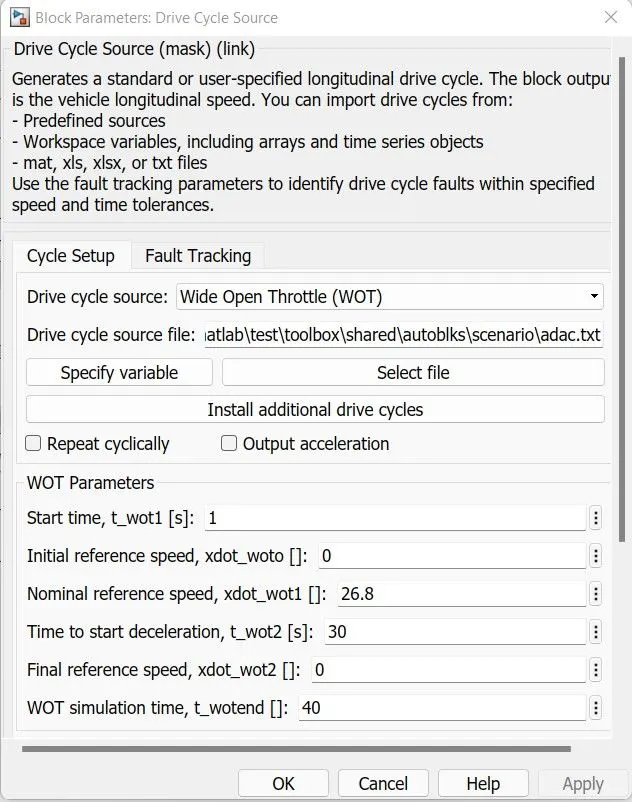
- WOT cycle is selected in DRIVE CYCLE SOURCE block by keeping default parameters.
- Picture is shown below of the model and the WOT parameters.
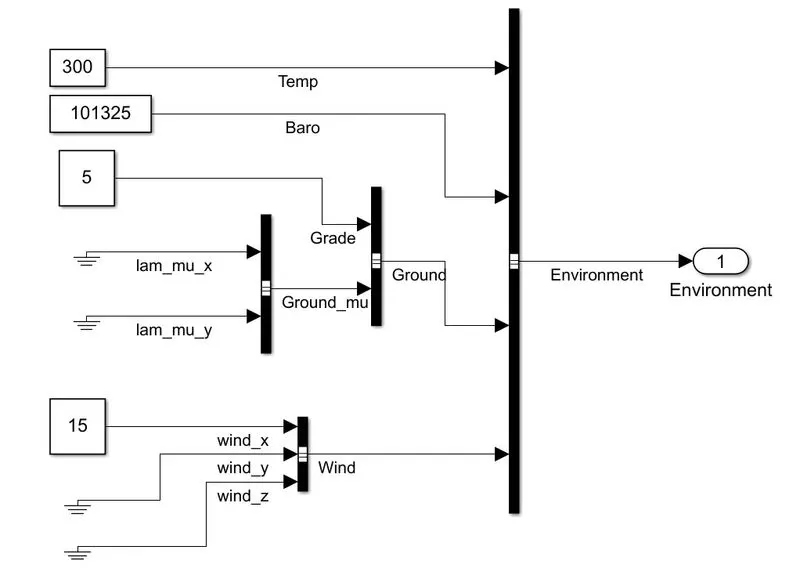
- Considering environment block parameters: Grade = 5 and Wind = 15
RESULTS:
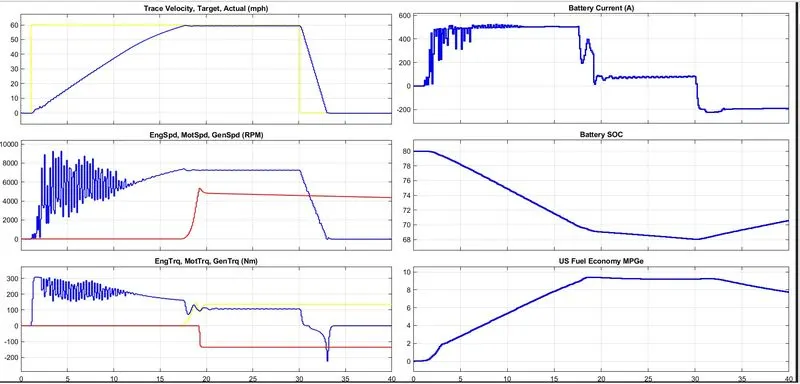
PLOT 1: Trace velocity, Target, Actual(mph)
- Trace velocity accelerates at 1st second which is shown in yellow colour, where as actual one takes 17secs to reach at speed of 60mph. It travels with this constant speed for about 12-13secs and then decelarates.
PLOT 2: Engine Speed, Gen Speed and Motor Speed (RPM)
- Motor speed is shown with blue colour graph which is maximum at 17th second with value = 6700RPM. Where as Gen and Engine is running together so the single graph is visible in red. As soon as motor reaches it maximum capacity after that whatever load is there it is contributed by engine thus it started after 17th second.
PLOT 3: Engine and Motor torque (Nm)
- Initially motor develops the torque to move forward or backward for any vehicle thus blue colour graph is seen to have positive value. Later as soon as engine contributes the remaining desired value torque developed in yellow colour refers to that.
- Now for generator which is in red colour is negative as power developed is negative thus the value is shown with negative sign.
PLOT 4: Battery current
- Initially while acceleration battery draws much amount of current which is near about 500A, during constant region between 17th - 30th second engine contributes the power so the amount of current is reduced. While in decelerating region engine charges the battery which is known as regenaration mode this can be state from the negative value in graph.
PLOT 5: Battery SOC
- Initially battery is at 80% SOC, it gets drain uptil 68% at 30th second, as the vehicle decelarates after 30th second battery gets recharge with the help of engine showing its SOC again rising after 30th second.
PLOT 6: Fuel Economy
- Fuel consumption rate from initial level to 17th second is high as vehicle is accelerating, while in constant region consumptionrate is also constant and further decreases as speed decreases.
4. Keeping all other parameters same, compare the simulated results of hybrid and pure electric powertrains.
Solution:
- Below is shown EV reference application Model from MATLAB help data. Drive cycle selected is WOT and keeping all the parameters as default as above.
- Considering environment block parameters same as above that is Grade = 5 and Wind = 15
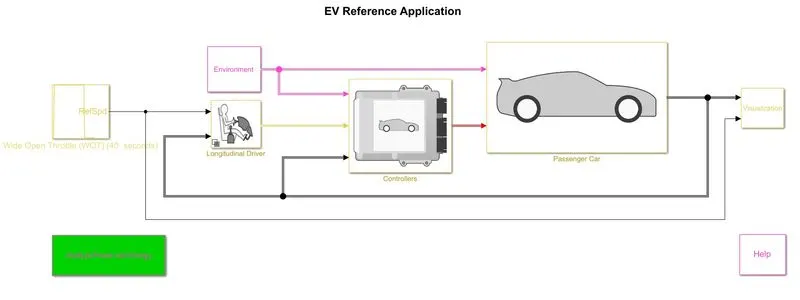
RESULTS: In reference of comparison from above graph of HEV model
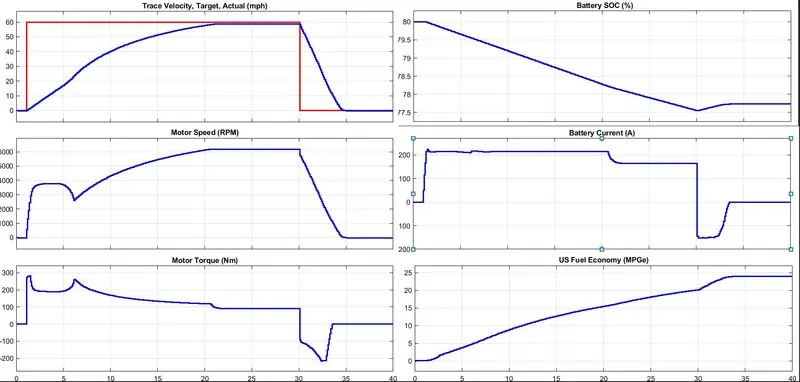
PLOT 1: Trace velocity, Target, Actual(mph): Takes 22 second to reach maximum speed.
PLOT 2: Motor Speed (RPM): Reaches to the near by value of 1000RPM at 22nd second.
PLOT 3: Motor torque (Nm): For initial start torque is high this is also observed in HEV model, while decelerating region motor works as generator showing value in negative.
PLOT 4: Battery current: This shows almost same result as compared to HEV model.
PLOT 5: Battery SOC: Minimun rate of SOC is 77.5 which is better compared to HEV model as it can run for long duration of time.
CONCLUSION:
- EV vehicle took 5 seconds more time to reach at maximum speed.
- Motor speed and Torque is more stable in EV compared to fluctuating in HEV.
- Batteries are more efficient in EV as it is the only driving unit, which can be seen by comparing SOC value at 30th second for both models.
- Fuel economy is higher in EV as it is more efficient than HEV.
NOTE: As environment parameters are considered the maximum mph is little bit less than 60 for both models.