FEA analysis for bending in Beams
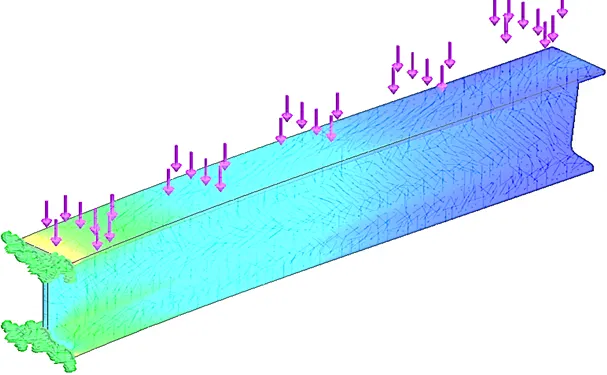
AIM: FEA analysis for bending in Beams of different cross sections
Objective: The main objective of this project is to Simulate bending in beams for same loading condition and optimizing solution for different cross sections using Static Analysis Study in Solidworks.
Key points:
- Material Stress-Strain Diagram
- What is Beam and Bending in Beam
- What is FEA
- Introduction to Solidworks Simulation.
- Geometry of beams. Case 1,2,3
- Setting up simulation.
- Result comparison
- Conclusion
- References
Material Stress-Strain Diagram:
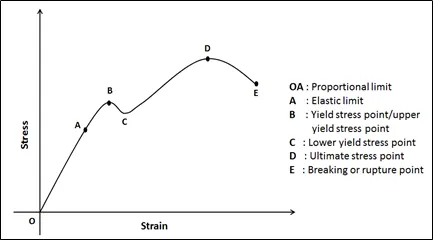
It represents behavior of material which is under loading. To obtain this diagram for any material, component is tested under tensile load until rupture. Plays vital role to understand material behavior under different load values. There are certain things which can be observed from Stress strain curve.
- OA is the elastic limit region. Under this, component shows elastic behavior and regains its shape upon unloading. Stress, strain relation is linear.
- B, C are yield stress point where material will show some amount of deformation when unloaded.
- D is an ultimate stress point which shows maximum stress a component can withstand. Region under B to D, is called plastic region. Relation between stress, strain is non-linear.
- E is a fracture point. At this point the component fails when load is increased.
What is Beam?
Beam is a structural member that resists loads when applied to lateral axis of beam. Primarily it shows bending deflection. Resultant of reaction forces applied to the beam produces shear stress and bending moments within the beam. Those induce stresses, strains and deflection of the beam.
Bending in Beams
When any structural member has one of its dimensions considerably small or typically 1/10th or less than other two, it induces bending. In case of beams, length of the beams is considerably longer than width and thickness, then beam may be subjected to bending depending upon forces applies.
What is FEA
Finite Element Analysis method popularly known as FEA, is the mathematical approach to solve governing equations to get unknowns involved in real world problems. FEA tool uses computer simulation software to solve real world problems thereby reducing number of physical prototypes and experiments. Saves lot of time and cost to optimize the components in design phase itself. FEA problem usually referred at a structural analysis problem.
Structure analysis is further classified into Static and dynamic analysis depending upon the nature of forces acting upon the components.
Static analysis: Forces acting upon component are quasi-static, i.e., forces increase gradually so that all the time dependent components can be neglected. Intermediate results are not reliable. Static analysis is used only where user is interested in last output values only.
Dynamic analysis: Forces and their behavior changes with respect to time. In other words, all the inertial and damping effects are considered during analysis. It is clear that dynamic analysis is more complex than static analysis. In Dynamic analysis, Intermediate values are reliable to get the end output.
For ex. In a Beam, we can perform Static analysis for displacement values while to know how the deformation progresses over span, we perform dynamic analysis to get intermediate values.
In 1D analysis, component is taken as single element and expressed in terms of coordinates only. Rod, bars, beam are taken as 1D element. 2D analysis components have constant thickness and is less compared to other dimensions. Shell, surface, plane, wall is 2D elements. Critical Volumetric parts are taken into 3D analysis. 1D,2D,3D analysis is used as and when we required to lower computational power and time.
As per stress-strain diagram, any material will have elastic limit, beyond which it behaves non-linearly and finally in rupture. In order to capture effects of forces under elastic limit, we need linear analysis method and beyond elastic limit, we perform non-linear analysis.
Types of nonlinearities
- Geometric – Large deformation in geometry of component such as hole in a plate.
- Material- creep (related to stiffness), elastic limit (non-metals).
- Contact non-linearity: depending upon contacts with other component, we have to decide analysis type.
Introduction to Solidworks Simulation:
Solidworks Simulation is an easy-to-use structural analysis tool that use Finite Element Analysis (FEA) method to solve real-world physical behavior of parts. The portfolio provides linear, non-linear static and dynamic analysis capabilities.
Solidworks Simulation has different Types of Analysis
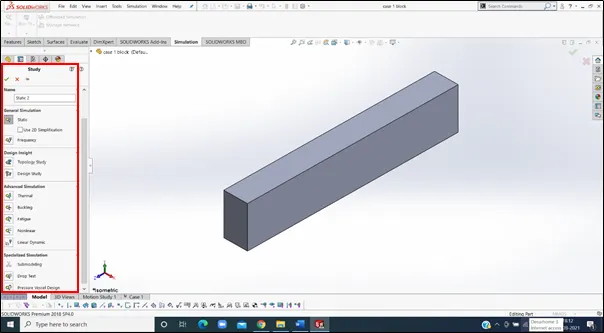
Static: calculates stress, strain, displacement, forces, moment etc.
Fatigue: repeated loads, determine amount of life consumed by cyclic loads.
Frequency: vibration frequency associated with given load and natural frequency.
Buckling: FOS, to predict the failure loads of beams.
Thermal: Calculates temperature flux, gradient, conduction, convection and radiation.
Optimization: to find optimum design based on un-optimized initial design and initial conditions
Pressure vessel design: Individual option, pressure vessel design from initial static/dynamic analysis values.
Vibration: To analyze natural or forced vibration frequencies into component.
Drop test: simulate dynamic problem depending on velocity and dropping distance.
Geometry of beams:
- Rectangular beam 2. I-Section Beam 3. C-Section Beam
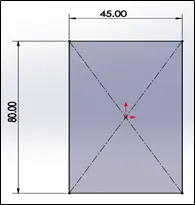
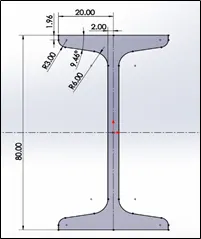
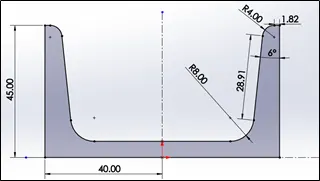
All beam sections are created using Solidworks 3D module and extruded length of beam is 400mm for each case.
Setting up Simulation:
Since we are interested in optimizing Beams for optimum Cross-section by comparing maximum stress values for each case, we will opt for Static analysis model under FEA.
Pre-processing:
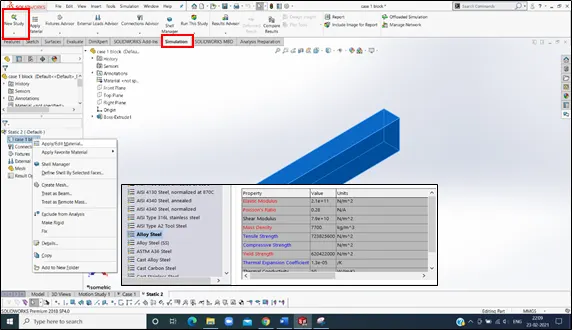
- Defining material for each beam. We have selected default material as alloy steel (same for each case) from Solidworks material library. Below image shows material properties. Need to consider here that Alloy Steel Maximum Yield strength is 620 N/mm2.
- Open Solidworks Simulation and opt for New study.
Solving:
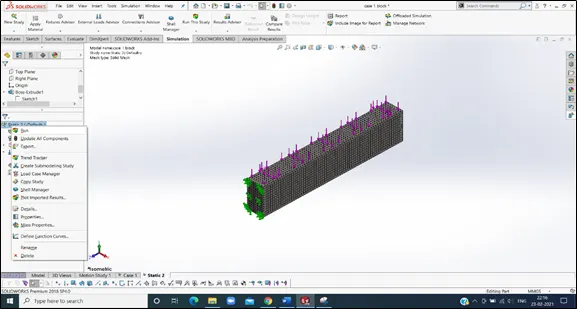
- Run the static Analysis model from following screen. As we have listed above, Solidworks have many more models to perform various studies. One of which is Static model.
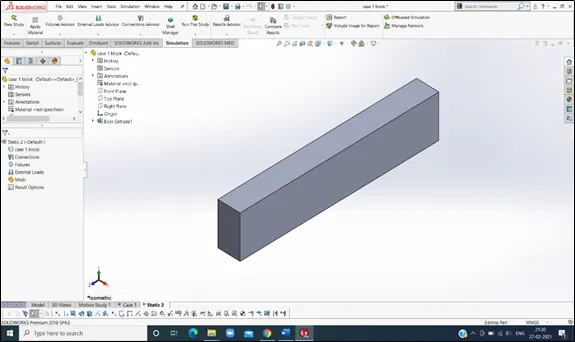
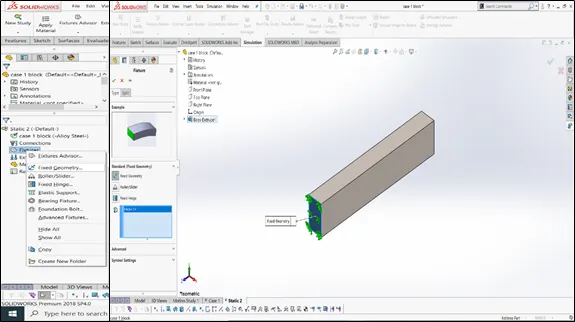
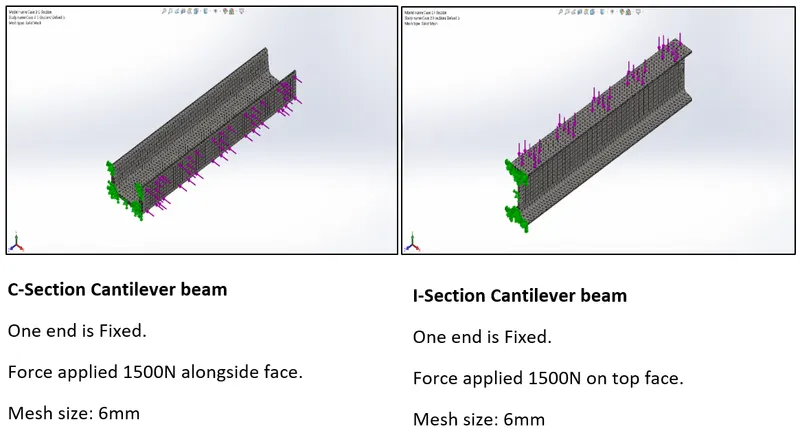
2. Next, we will apply boundary conditions. As it is a cantilever beam, one end of beam is fixed with respect to its cross-sectional plane.
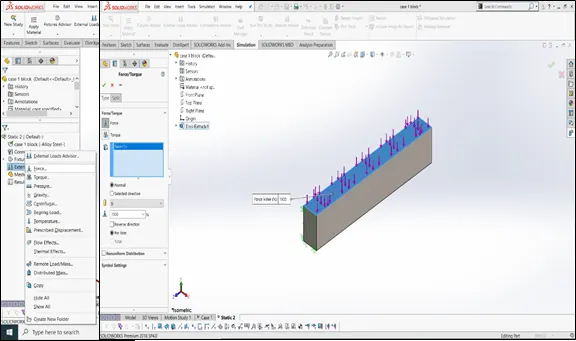
3. Here applied force is 1500N for each case.
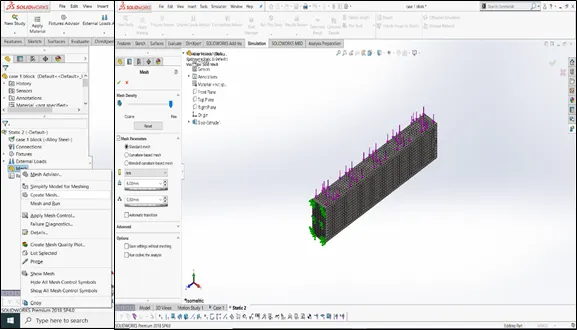
4. Next step is meshing. Meshing is a process also called as discretization which splits whole component into small elements. Each element is solved for defined boundary condition. Then data is interpolated for whole component. Here default mesh of 6mm is used.
A brief on mesh:
Solidworks majorly uses two types of mesh elements, triangle and quadrilateral. Depending upon model complexity, mesh needs to refine. Finally, we can perform Grid dependency test to check accuracy of results. Which means, we re-run the simulation by varying mesh up to a point where results are optimum even after refining mesh.
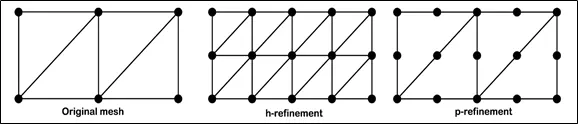
For mesh refinement, Solidworks has two methods used for increasing DOF of model.
H-method: Refines mesh by introducing more elements of same type.
P-method: Refines mesh by introducing more nodes while keeping same number of elements.
5. After finalizing boundary conditions, we can run the simulation. Here it will give values appropriate for Von-mises stress, Strain and displacement.
Below Image shows 3D meshed models of other two C/S beams along with loading condition.
Post processing:
Post processing will consist of data which we required as output of simulation study. Here we are interested in Comparing Stress, Strain and displacement values of different C/S beam. Results are discussed in latter para.
Case 1: Rectangular Section Beam
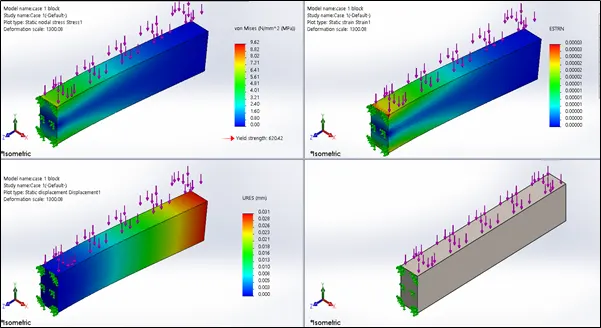
Observation:
Max Von Mises Stress: 9.62 N/mm2
Displacement: 0.031 mm
Strain: 0.00003
Weight: 11.09 kg
Case 2: I-Section Beam
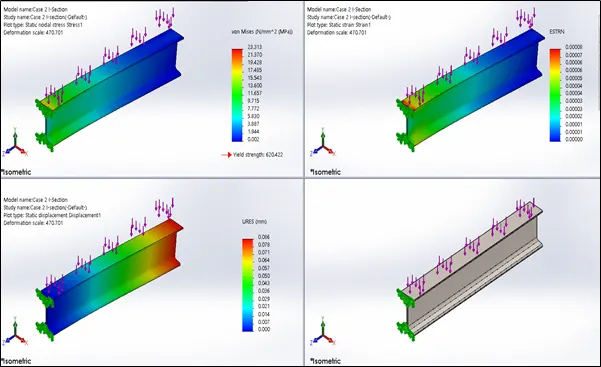
Observation:
Max Von Mises Stress: 23.31 N/mm2
Displacement: 0.086 mm
Strain: 0.00008
Weight: 2.36 kg
Case 3: C-Section Beam
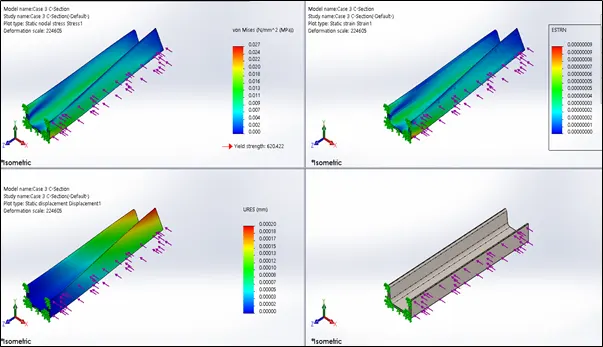
Observation:
Max Von Mises Stress: 0.027 N/mm2
Displacement: 00020 mm
Strain: 0.00000009
Weight: 3.23 kg
Summary of results obtained:
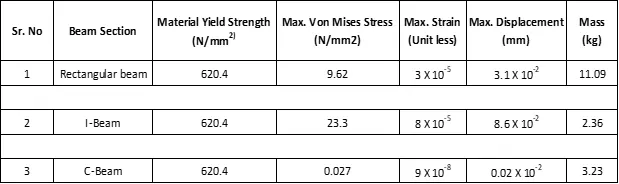
Conclusion:
- Since C-section is subjected to torsion under the 1500N load, it is not a good choice. Among other two sections, Rectangular section has optimum values of Von-mises stress, Strain and displacement over the I-Section beam.
- If the end application is weight sensitive, we can opt for I-section as it has lowest weight among all three. Also stress distribution profile among I-section is much better. So, it is preferrable over rectangular section.
- Among all three, I-section has advantages of even stress distribution profile and lowest weight, we can say I-section is the most optimum among all three.
References: