Centrifugal pump design and analysis
Aim : To design a centrifugal pump and analyse the internal flow simulation.
Objective :
- Design a centrifugal pump.
- Calculate the Pressure Ratio.
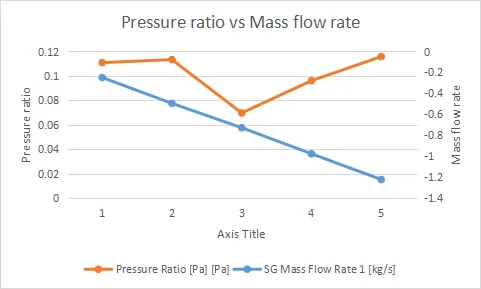
- Obtain the relationship between Pressure ratio and mass flow rate.
Theory/Introduction :
What is centrifugal pump? A Centrifugal pump is a mechanical machine that pumps the fluids by converting the mechanical power into the pressure energy of the fluid flow. This mechanical power generally supplies by the electric motor or engine. A centrifugal pump uses a centrifugal force to pump the fluids. The fluid enters the pump impeller along or near to the rotating axis and is accelerated by the impeller, flowing radially outward into a diffuser(volute casing) from which it exits.
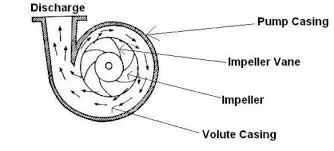
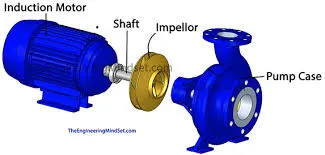
Centrifugal pumps are generally suitable for liquids with a relatively low viscosity that pours like water or light oil. It is commonly used for water, sewage, agriculture, petroleum, and petrochemical pumping. Centrifugal pumps are often chosen for their high flow rate capabilities, abrasive solution compatibility, mixing potential, as well as their relatively simple engineering.
Mass Flow Rate : The mass flow rate is the mass of a liquid substance passing per unit time. Also known as the rate of movement of liquid pass through a unit area. The mass flow is directly dependent on the density, velocity of the liquid, and area of cross-section.Its unit is kilogram per second (kg/s) in SI units.
Pressure Ratio : The pressure ratio is defined as the ratio between outlet pressure to inlet pressure.
Pressure Ratio = Outlet Total Pressure / Inlet Total Pressure
Simulation Setup
Parameters
Simulation type : Static simulation
Analysis type : Internal flow
Physical Features : Rotation (local region(Averaging))
Fluid : Water
Flow type : Laminar & Turbulence
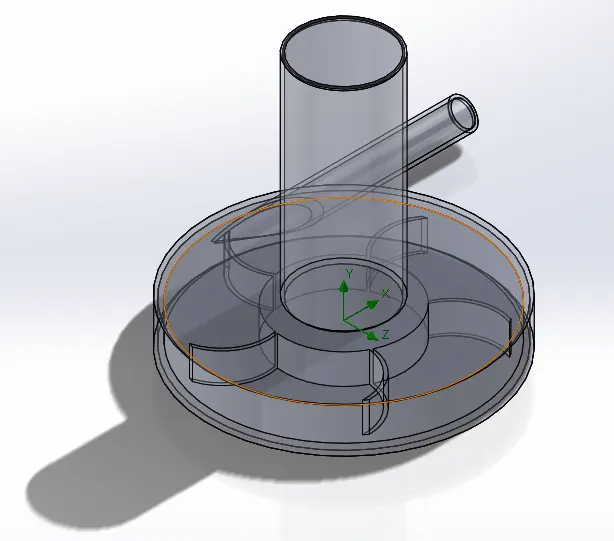
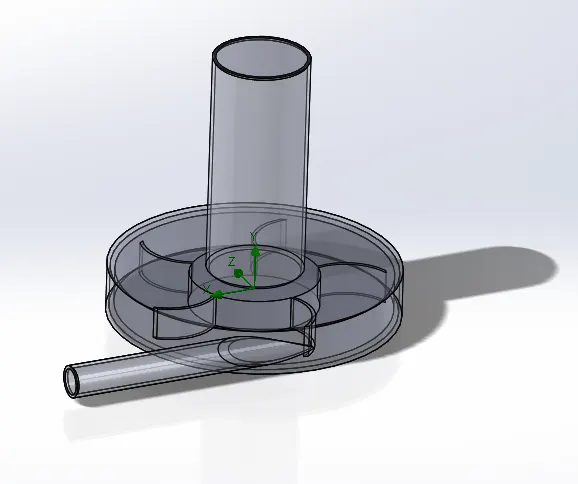
Centrifugal Pump Modal
Procedure
- Design a centrifugal pump as shown above
- Insert Lids for both of the opening of the pump
- Run the wizard tool with the parameters given above
- Set the boundaries for the simulation
- enviromental pressure at the inlet = 101325 Pa
- Outlet velocity at the outlet = 5 m/s
- Add surface goals(Total pressure & Mass flow rate) to the outlet lid
- Check the advance channel refinement box at the mesh setting for a better mesh generation
- Velocity-Pressure cut plot, Flow trajectories and goal plots are created at the result setting
- Run a parametric study with different outlet velocity(5, 10, 15, 20 m/s) as an input
- Velocity-Pressure cut plot, Flow trajectories and goal plots are set as the output
Result :
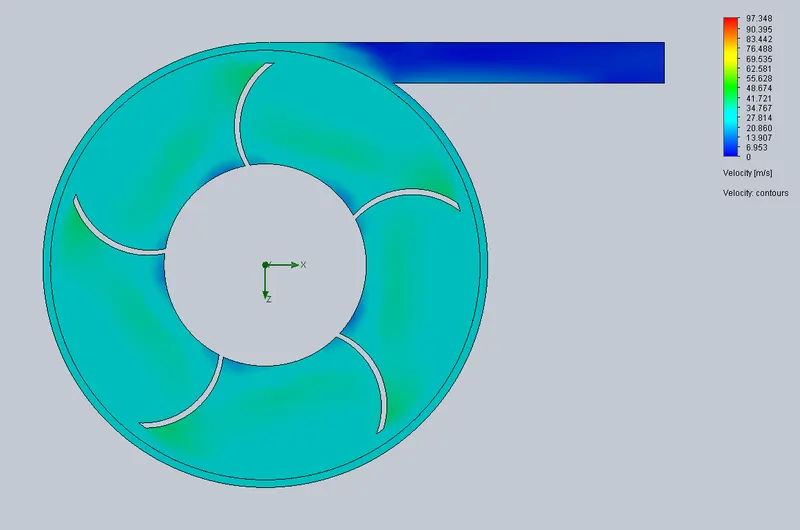
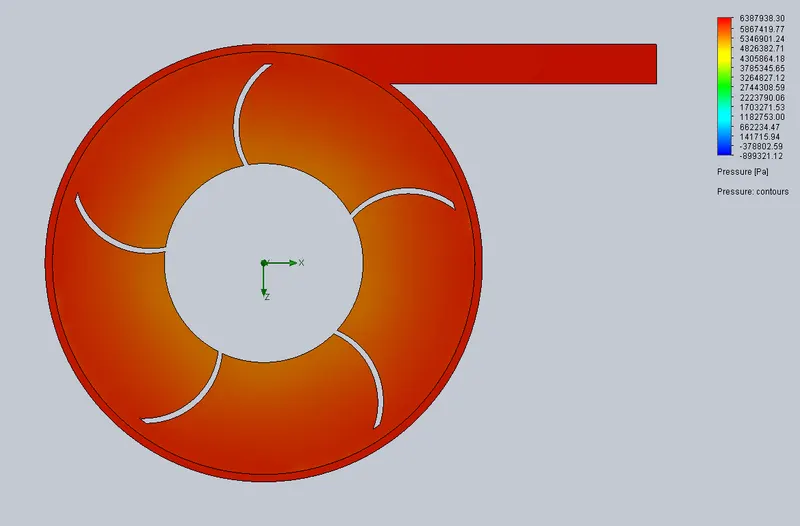
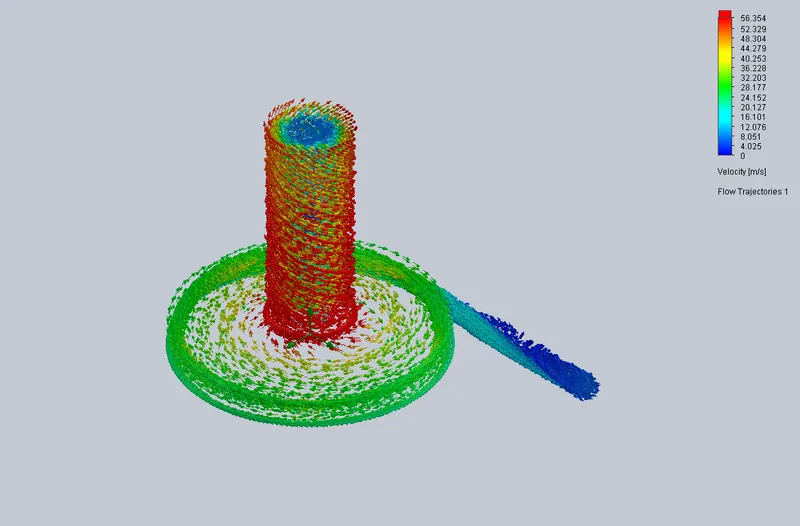
Case Study 01 (Outlet velocity = 5 m/s)
Velocity Plot
Pressure Plot
Flow Trajectory
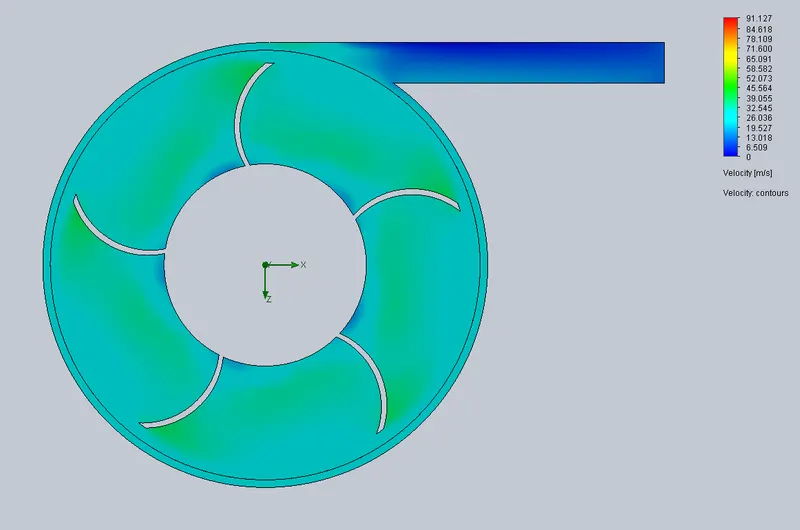
Case Study 01 (Outlet velocity = 10 m/s)
Velocity Plot
Pressure Plot
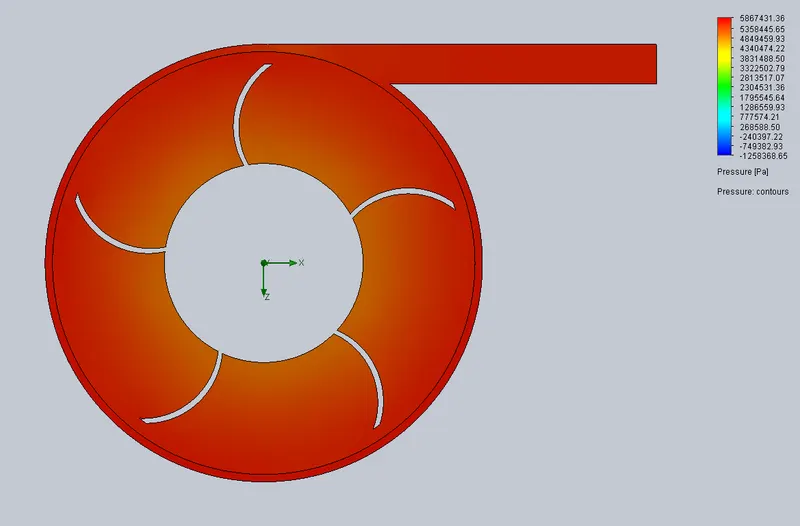
Flow Trajectory
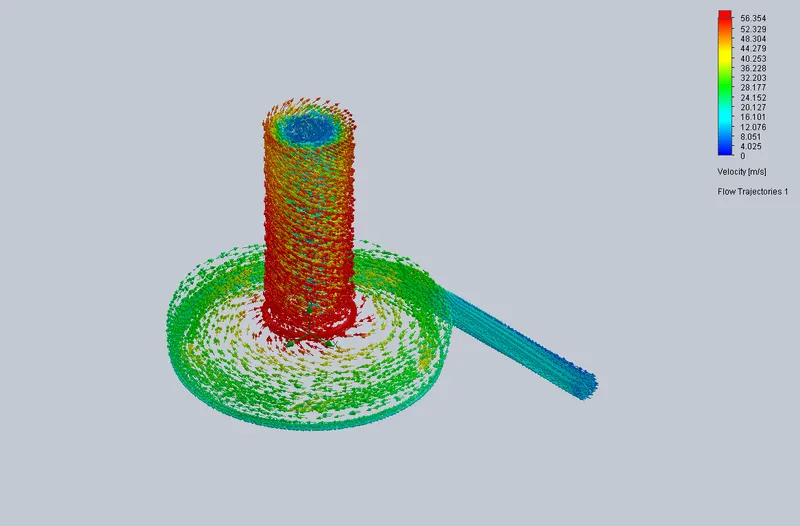
Case Study 01 (Outlet velocity = 15 m/s)
Velocity Plot
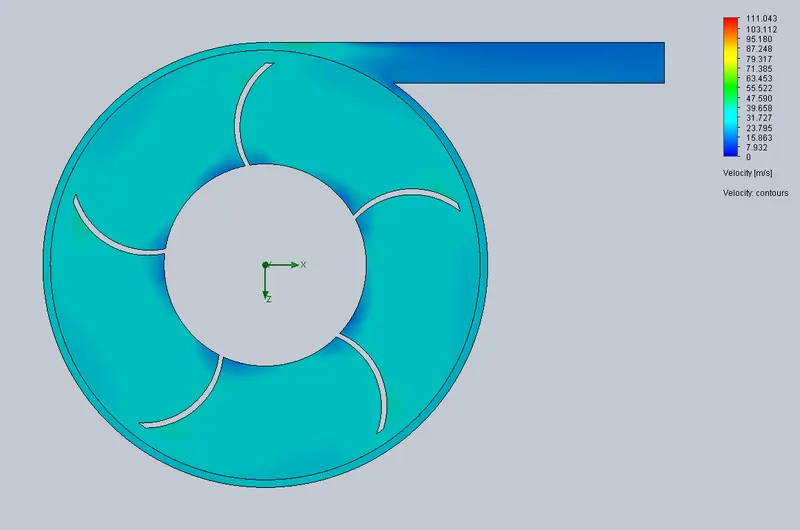
Pressure Plot
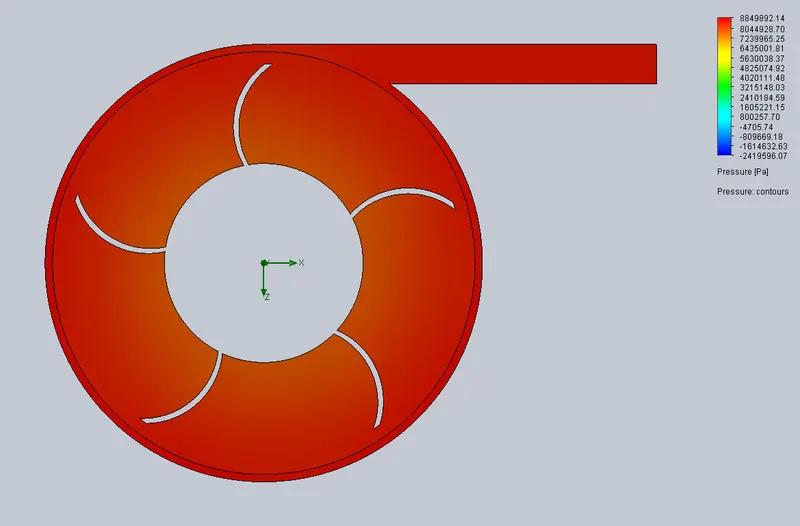
Flow Trajectory
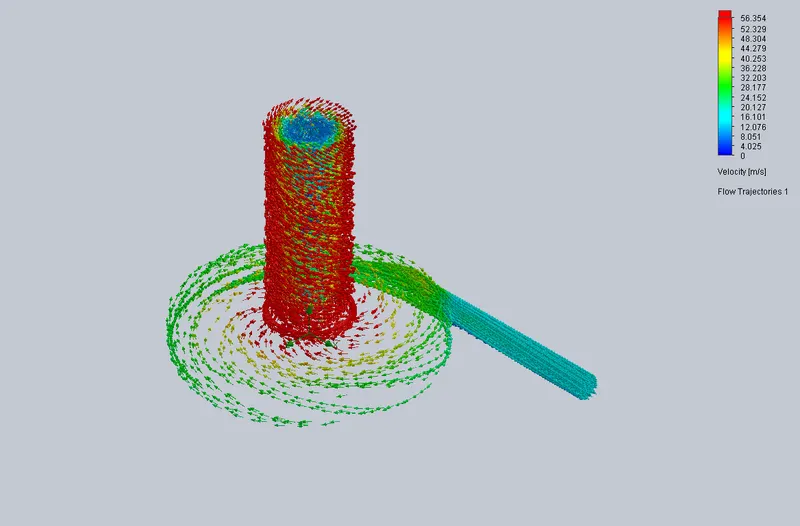
Case Study 01 (Outlet velocity = 20 m/s)
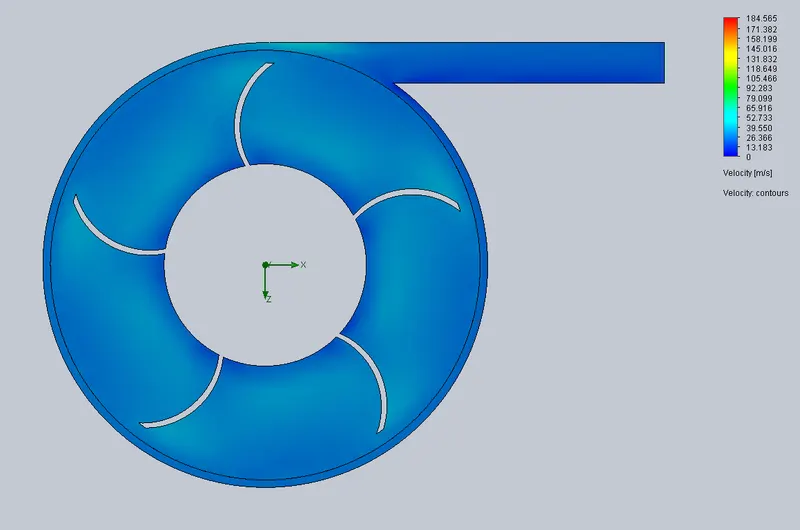
Velocity Plot
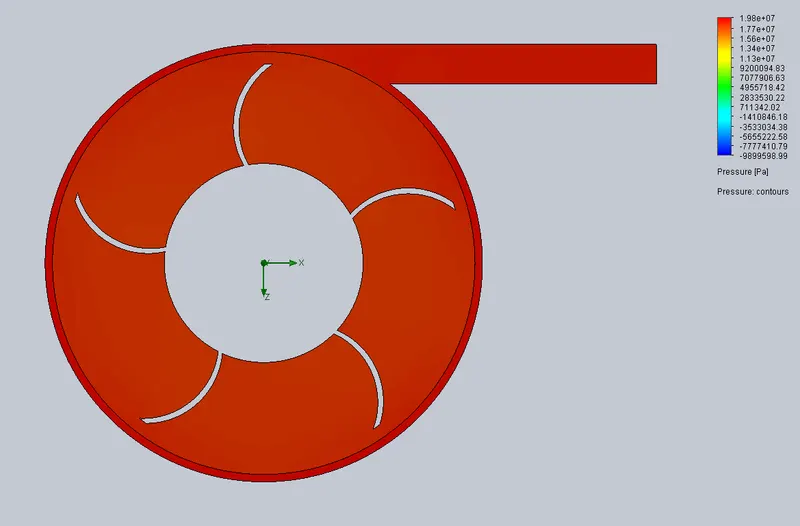
Pressure Plot
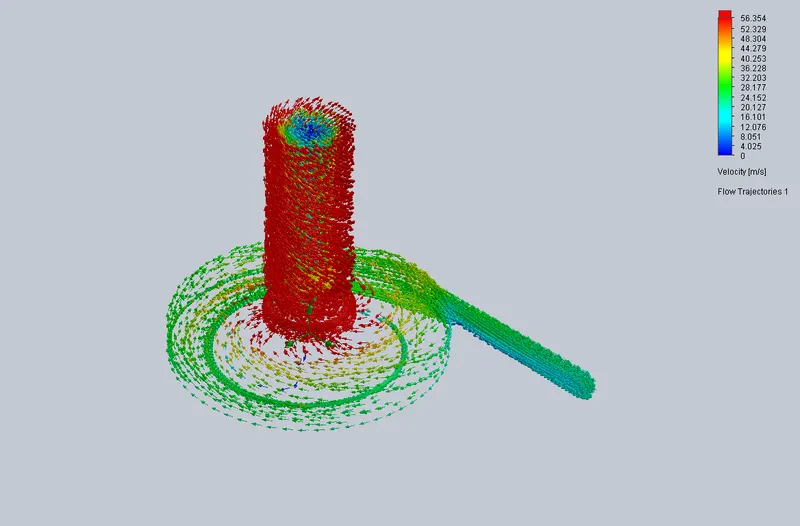
Flow Trajectory
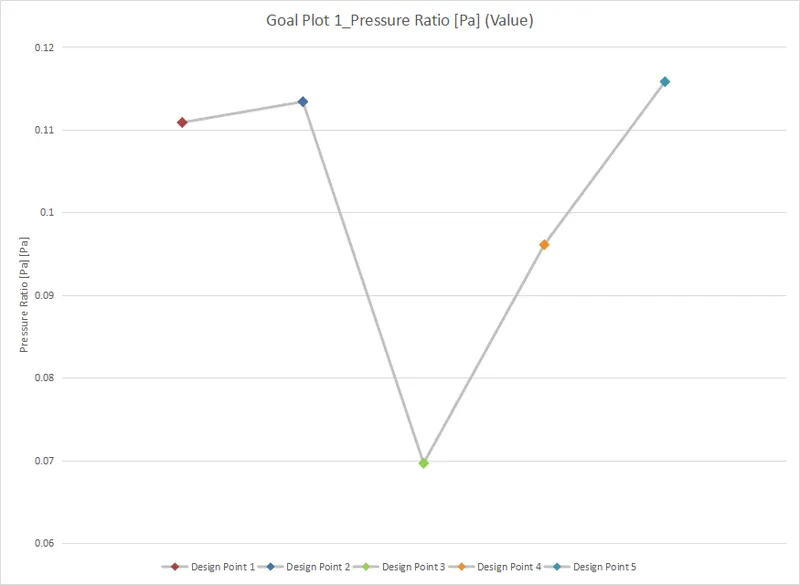
Pressure Ratio
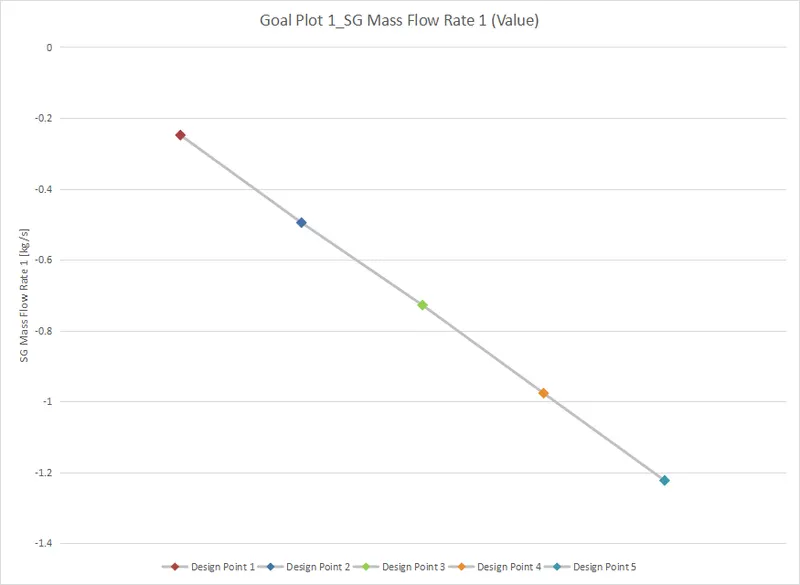
SG Mass Flow Rate Plot
Pressure ratio vs Mass flow rate
Conclusion/Observation :
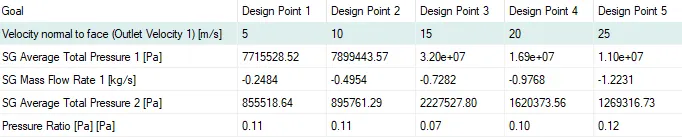
- From the table above, we can conclude that when the inlet velocity increses the mass flow rate decreases.
- When the mass flow rate decreases, the pressure ratio increases .
- The velocity - pressue cut plot shows that when the outlet velocity increases, the maximum presssure decreases.