Flow over a cylinder
Aim : To study the flow over a cylinder using Solidworks for baseline simulation with varying Reynold Number by a factor of 20%, 40% and 100%.
Objective :
- Calculate the baseline case Reynolds number.
- Then increase the Reynolds number by a factor of 20%, 40%, and 100% then run the transient flow simulation.
- Calculate the Flow through time and Simulation end time.
- Create animations for pressure-velocity for all the three Reynolds number.
Theory
What is Transient flow? Transient Flow is ia when the flow velocity and pressure are changing with time. Transient Flow exist in situations such as starting or stopping a pump, closing or opening a valve or changes in tank levels.If the flow velocity and pressure are not affected by the time the system is at a steady state.
Transient flow is also the phase of flow that occurs between laminar and turbulent flow, and corresponds to Reynolds numbers. In this type of flow, there is a mixture of laminar and turbulent flows present.
Calculation
Parameters
Cylinder diameter : 0.04 m
Cylinder length : 0.05 m
Fluid : Air
Density : 1.225 kg/m3
Dynamic viscosity : 18.13*10-6 kg/(m·s)
Initial Velocity : 10 m/s
Formula
Reynold Number = (p * V * d) / μ
Flow through time = Domain Length / Velocity
Simulation end time = 2 * Flow through time
Baseline Simulation
- (Re = 100%)
Re = (1.225 * 10 * 0.04) / 18.13*10-6
Re = 27027.03, where Velocity = 10 m/s
Flow through time : 0.005 sec
Simulation end time : 0.01 sec
- (Re = 120%)
Re = 32432.44
32432.44 = (1.225 * V * 0.04) / 18.13*10-6
Velocity,V = 12 m/s
Flow through time : 0.004167 sec
Simulation end time : 0.008334 sec
- (Re = 140%)
Re = 37837.84
37837.84 = (1.225 * V * 0.04) / 18.13*10-6
Velocity,V = 14 m/s
Flow through time : 0.003571 sec
Simulation end time : 0.007142 sec
- (Re = 200%)
Re = 54054.06
54054.06 = (1.225 * V * 0.04) / 18.13*10-6
Velocity,V = 20 m/s
Flow through time : 0.0025 sec
Simulation end time : 0.005 sec
Result
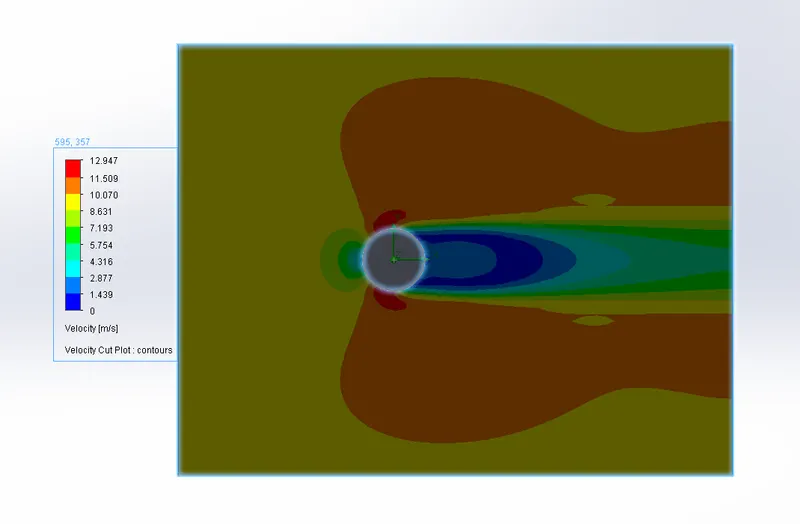
(For Re = 100%, 27027.03)
Velocity distribution over cylinder
Pressure distribution over cylinder
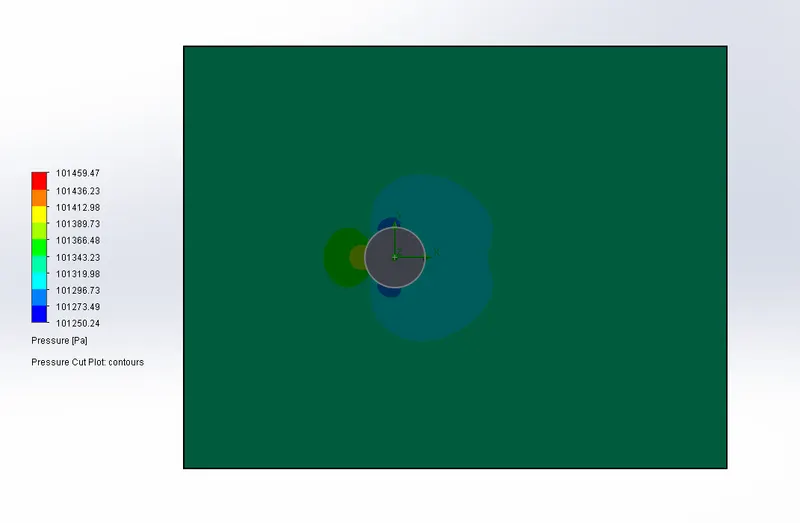
The maximum velocity is 12.947 m/s whereas the minimum velocity is 1.439 m/s . whereas the maximum pressure is 101412 Pa and minimum pressure is 101250 Pa.
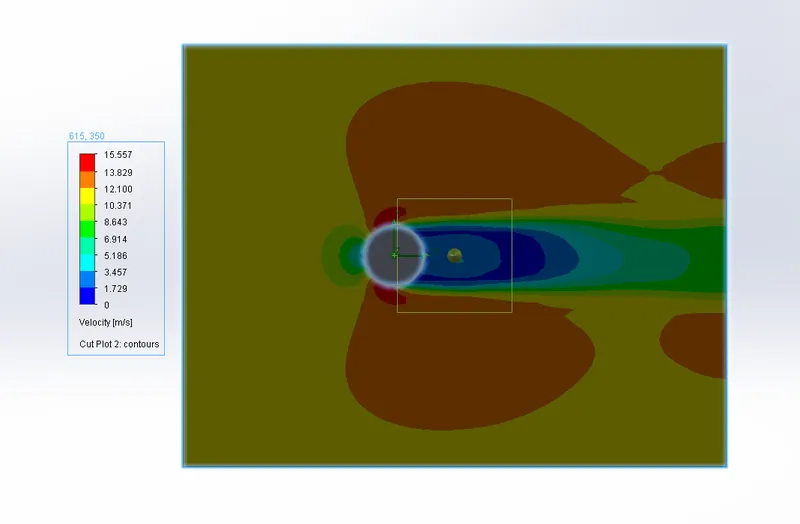
(For Re = 120%, 32432.44)
Velocity distribution over cylinder
Pressure distribution over cylinder
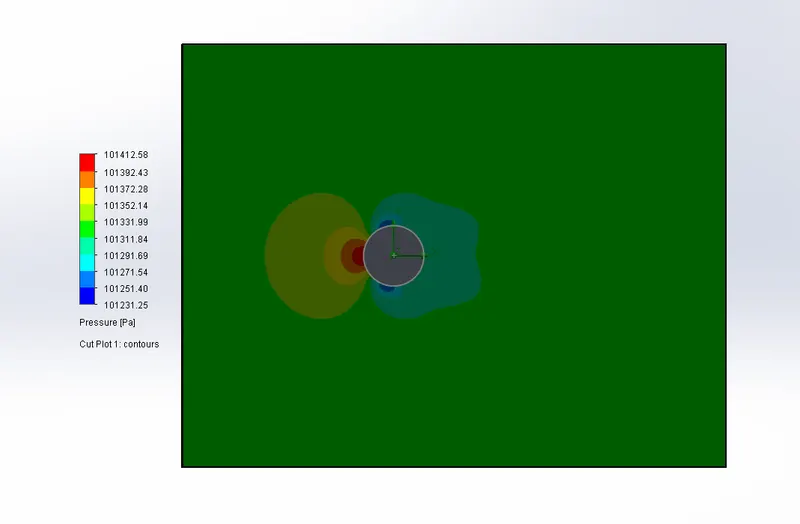
The maximum velocity is 15.557 m/s whereas the minimum velocity is 1.729 m/s . whereas the maximum pressure is 101412 Pa and minimum pressure is 101250 Pa.
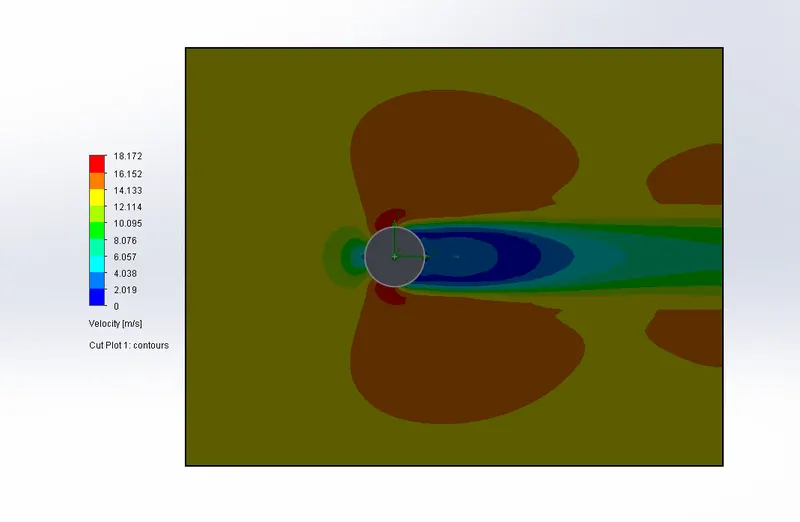
(For Re = 140%, 37837.84)
Velocity distribution over cylinder
Pressure distribution over cylinder
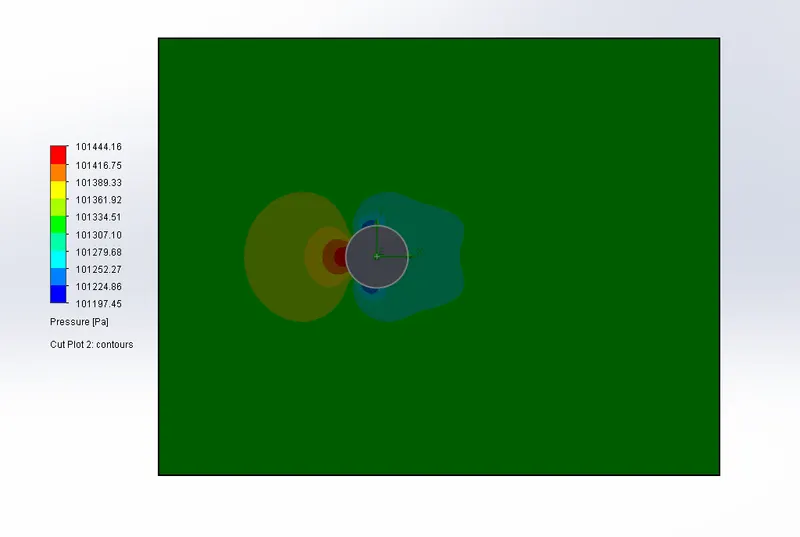
The maximum velocity is 18.172 m/s whereas the minimum velocity is 2.019 m/s . whereas the maximum pressure is 101444 Pa and minimum pressure is 101197 Pa.
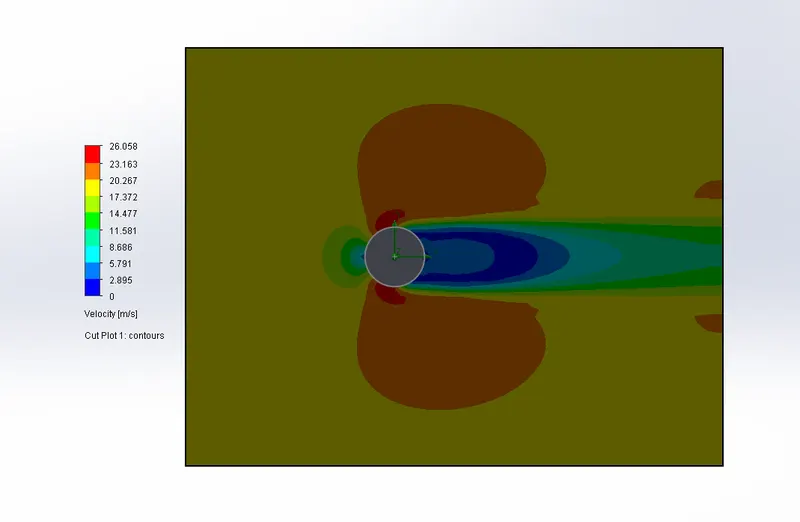
(For Re = 200%, 54054.06)
Velocity distribution over cylinder
Pressure distribution over cylinder
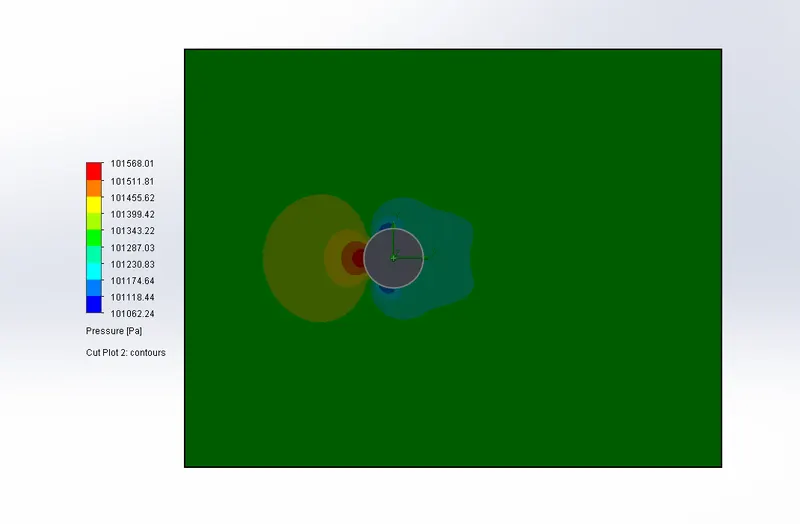
The maximum velocity is 26.058 m/s whereas the minimum velocity is 2.895 m/s . whereas the maximum pressure is 101568 Pa and minimum pressure is 101062 Pa.
Animation
https://drive.google.com/drive/folders/1zAU7-ovF4AG0m7TrS27dNLPDszG6KkNA?usp=sharing
Conclusion / Observation
From the cut plot graph and animation above we can conclude that
- When the Reynold Number increases the Velocity increases.
- The velocity slightly drops at the surface of the cylinder and gradually increses.
- High pressure values are recorded at the cylinder surface facing the inlet velocity.