Assignment 6-Frontal Crash Simulation Challenge
AIM
Frontal car crash simulation of Dodge Neon BIW using RADIOSS solver and Preprocessing using HyperMesh / HyperCrash.
OBJECTIVE
- To check the unit system and either follow [Mg mm s] or [Kg mm ms].
- To create the appropriate interface, friction 0.2, and recommended parameters.
- To make sure of no penetrations and intersections.
- To correct rigid bodies if any issues.
- To create a rigid wall with friction 0.1.
- To compare the model weight with the full-scale 300k nodes model and use added masses to reach the target weight of 700kg while getting CG about the required range.
- To create an initial velocity of 35 mph.
- To input Time-step:0.5 to 0.1 microseconds and Run 80 ms.
ABSTRACT
The crash test is a virtual reconstruction that replicates the same forces and speeds that would occur if the vehicle was to be involved in an actual crash. In this type of testing, since nothing is physically impacting the Body-in-White (BIW), no physical deformation or damage occurs to the body’s structure, allowing multiple crashworthiness tests to be conducted in succession. This type of simulation is an integral part of the design process and can help save both time and money since it can be implemented instead of costly, destructive testing programs.
For this project, the case set up and simulation are to be done in Hypermesh and Hypercrash, whereas Hyperview and Hypergraph 2D will be used for post-processing. Hypergraph will be used to plot energies, Von-Mises stresses, plastic strains, acceleration curves, and force and Hyperview will be used to view the simulation.
As part of the process, we are to create a rigid wall, check penetrations, assign an initial velocity of 35mph, carry out mass balancing to ensure the total weight comes to 700 kgs, and finally, create sections, intrusions and accelerometers as part of the output request requirements.
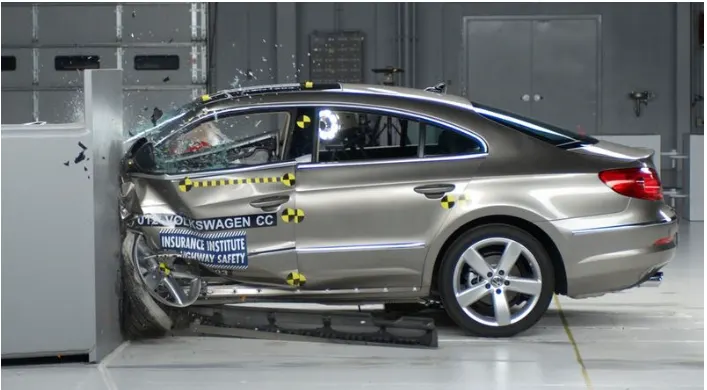
A crash test is a form of destructive testing usually performed in order to ensure safe design standards in crashworthiness and crash compatibility for various modes of transportation or related systems and components.
Various Crash Test
A crash test is a form of destructive testing usually performed in order to ensure safe design standards in crashworthiness and crash compatibility for various types of vehicles like small, medium, and heavy-duty and its related systems and components for the sake of getting the performance of the vehicle under the different conditions of the crash at different angles with taking certain object like a rigid wall, cables specially three-strand cable, concrete barriers, guardrail systems, etc. It will be performed either by numerical simulations or experimentally. The figure below illustrates different types of crash tests generally used.
- Frontal Impact test- In this test a fully front structure of the vehicle collides with another object like another vehicle, rigid wall etc. at a given speed.
- Offset Test- In this test, only a part of the front portion of the vehicle strikes on some barrier usually a vehicle at a given speed.
- Small Overlap Test- In this only a small portion of the vehicle strikes an object like a tree, pole or if a car were to clip another. This situation loads a maximum value of force into the vehicle structure at a particular given speed. This test usually comprises 15% to 20% of the front structure.
- Side Impact Test- In this test sometimes the vehicle is in static condition or in dynamic and another vehicle or an object collide at the side surface having some speed.
- Roll-Over Test- In this test a vehicle is in rollover condition having a certain angle by which they test (specifically the pillars holding the roof) to support itself in a dynamic impact. It is also done for the static crash testing condition.
- Roadside Hardware- These are performed to ensure that the crash barriers and crash cushions will protect vehicle occupants from roadside hazards.
- Old Versus New- In this, an impact is done between an old car against a new car and the big car against a small car it is performed to show the advancements in crashworthiness.
Crash tests are conducted under rigorous scientific and safety standards. Each crash test is very expensive so the maximum amount of data must be extracted from each test. Usually, this requires the use of high-speed data acquisition, at least one triaxial accelerometer and a crash test dummy, but often includes more. A crash test is much important which helps in minimizing the losses such as deaths, injuries and property damages from vehicle crashes on the roads.
In this Project, we have to perform the Frontal crash of the vehicle. Frontal impacts are the impacts undertaken against the solid barrier with precise speed. The test requires the front portion of the vehicle to impact the barrier.
In the New Car Assessment Program (NCAP), passenger vehicles are crashed at 35 mph into a rigid barrier that covers the full width of the vehicle. The Institute runs offset frontal tests instead of full-width frontal tests. In an offset crash only one side of a vehicle front end, not the full width, hits the barrier.
HOW CRASH TESTING WORKS
A crash test is a form of destructive testing usually performed in order to ensure safe design standards in crashworthiness and crash compatibility for various modes of transportation-related systems and components.
Crash test dummies have been the subject of public service announcements, cartoons, parodies, even the name of a band. Real crash test dummies, however, are true life-savers as an integral part of automotive crash tests. Even though cars get a little safer each year, and fatality rates are declining, car crashes are still one of the leading causes of death and injury in the United States.
One of the reasons cars have been getting safer is because of a well-established testing program.
The dummies contain three types of instrumentation:
- Accelerometers
- Load sensors
- Motion sensors
Accelerometers
These devices measure the acceleration in a particular direction. This data can be used to determine the probability of injury. Acceleration is the rate at which speed changes. For example, if you bang your head into a brick wall, the speed of your head changes very quickly (which can hurt). But, if you bang your head into a pillow, the speed of your head changes more slowly as the pillow crushes (and it doesn't hurt).
The crash-test dummy has accelerometers all over it. Inside the dummy's head, there is an accelerometer that measures the acceleration in all three directions (fore-aft, up-down, left-right). There are also accelerometers in the chest, pelvis, legs, feet and other parts of the body.
Load Sensors
Inside the dummy are load sensors that measure the amount of force on different body parts during a crash.
Movement Sensors
These sensors are used in the dummy's chest. They measure how much the chest deflects during a crash.
Crashworthiness Requirements
The vehicle structure should be sufficiently stiff in bending and torsion for proper ride and handling. It should minimize high-frequency fore-aft vibrations that give rise to harshness. In addition, the structure should yield a deceleration pulse that satisfies the following requirements for a range of occupant sizes, ages, and crash speeds for both genders: Deformable, yet stiff, front structure with crumple zones to absorb the crash kinetic energy resulting from frontal collisions by plastic deformation and prevent intrusion into the occupant compartment, especially in case of offset crashes and collisions with narrow objects such as trees. Short vehicle front ends, driven by styling considerations, present a challenging task to the crash-worthiness engineer. Deformable rear structure to maintain the integrity of the rear passenger compartment and protect the fuel tank.Properly designed side structures and doors to minimize intrusions in side impact and prevent doors from opening due to crash loads. Strong roof structure for rollover protection. Properly designed restraint systems that work in harmony with the vehicle structure to provide the occupant with an optimal ride down and protection in different interior spaces and trims. Accommodate various chassis designs for different power train locations and drive configurations.
PROCEDURE
- Check for UNIT SYSTEM
- Import model in HYPERCRASH
- Add masses to reach a target weight of 700kg
- Export changes file and import in HYPERMESH
- Create Interface contact's
- Check for penetration and intersection
- Create a rigid wall
- Add velocity to the nodes
- Create cross-section's
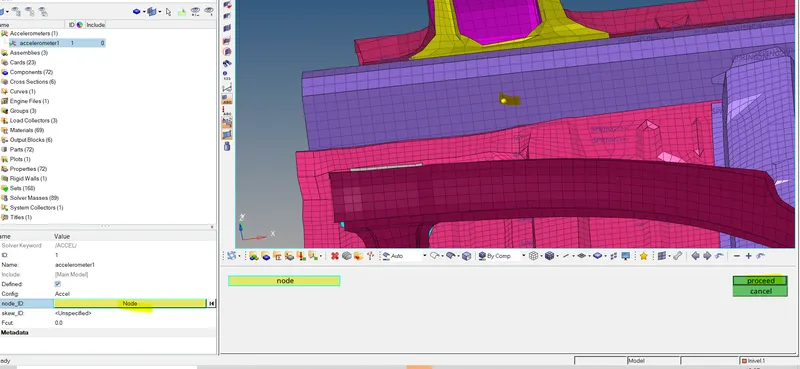
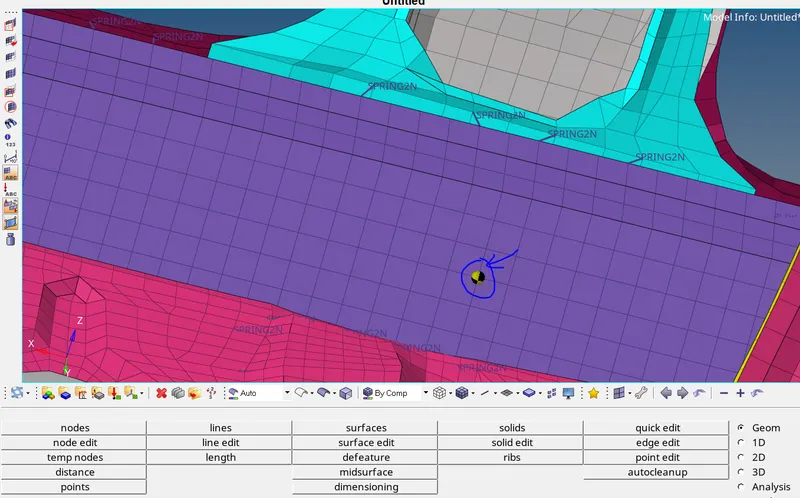
- Create acceleration nodes
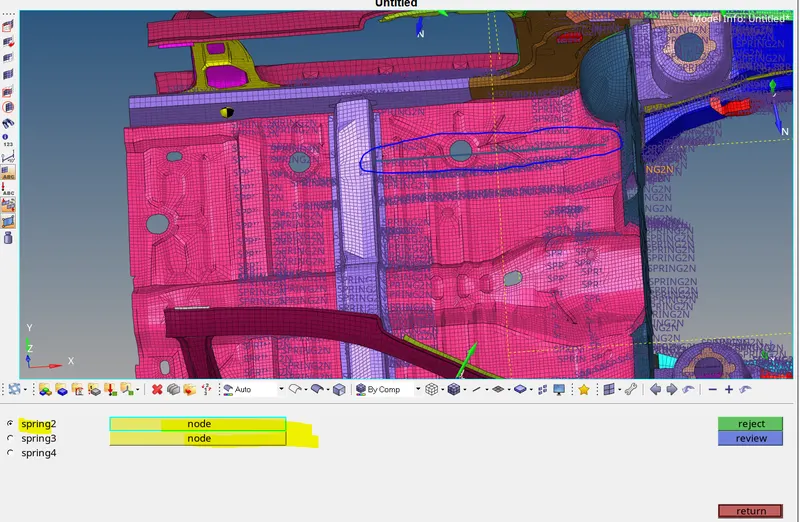
- Create springs to check deflection
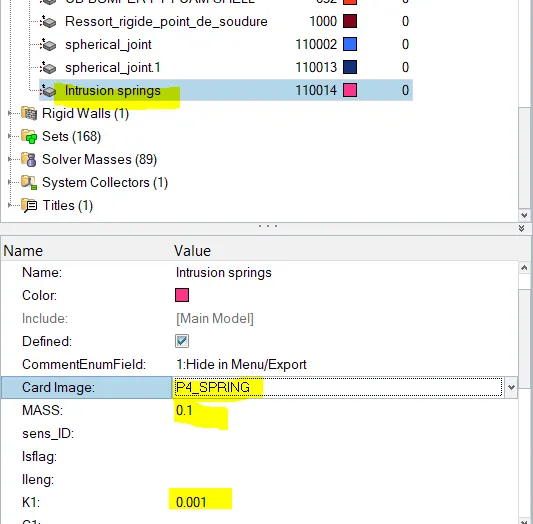
- Assign property to springs
- Create TH for section forces, intrusion springs, interface contacts
- Create cards
- Model checker
CHECK FOR UNIT SYSTEM:
In the data, we have two files
1. Neon_front_0000.rad ( starter file )stores information about:
Nodes
Load Conditions
Velocity
Boundary Conditions, etc.
Basically, it is an ASCII (American Standard Code for Information Interchange) file that contains the model information.
The starter file should always end with 0000.rad.
2. Neon_front_0001.rad (engine input file)
The engine File stores information about:
Simulation Runtime
Simulation Speed control parameters, such as No. of Animation Files, No. of Time History File, Size of the history file and Animation frequency, etc.
Basically, it is an ASCII (American Standard Code for Information Interchange) file that describes the run controls.
We can also edit the Engine File directly through the Control Cards.
The starter file should always end with 0001.rad.
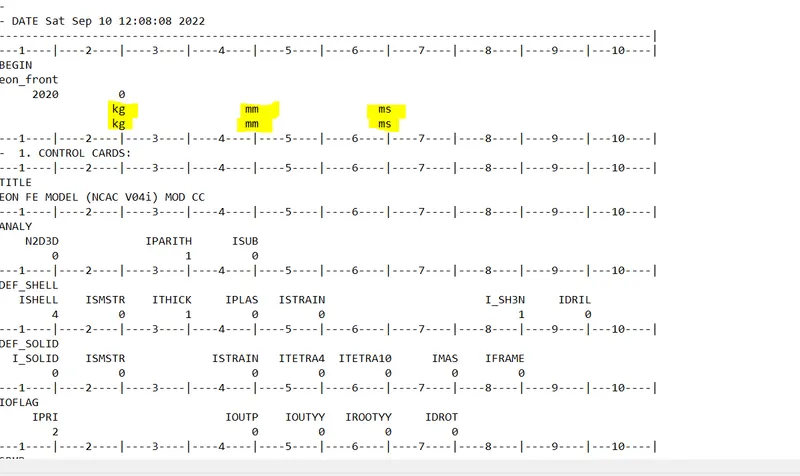
To check unit
Go to Neon_front_0000.rad file >> Open >> check the unit system
IMPORT STARTER FILE IN HYPERCRASH
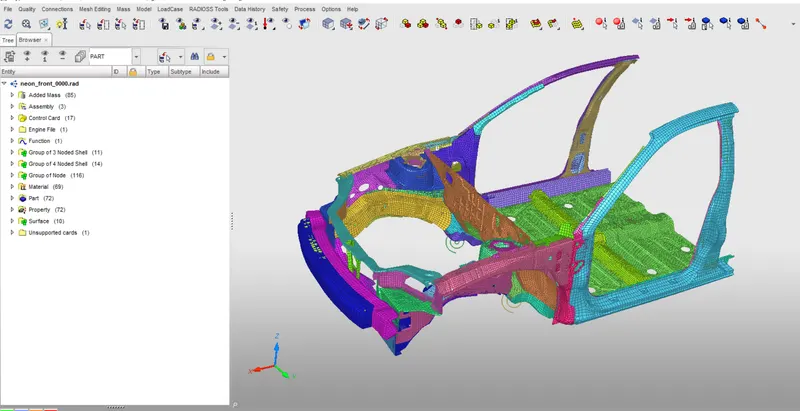
Select Neon starter file and drag it to hypercrash application to open the model
Compare the model weight with the full-scale 300k nodes model and use added masses to reach a target weight of 700kg while getting CG about the required range.
A vehicle’s center of gravity, or CG, is the theoretical point where the sum of all of the masses of each of its individual components effectively acts. In other words, from a physics perspective, a vehicle behaves as its entire weight resides at this one point. Carrying weight up high, such as a panoramic sunroof will raise a vehicle’s CG while placing heavy subsystems low in a vehicle, such as a battery pack, will work to lower it. Lower is better from a handling standpoint, as it reduces weight transfer during cornering and braking, and it also reduces the propensity to roll over.
ADD MASSES:
Mass balancing: In order to maintain the CG of a car we have to add mass for the given components, In the given model there are so many parts are missing because of the node limits in the student version
To check the CG
Go to menu >> Mass >> Balancing >> Show CG point
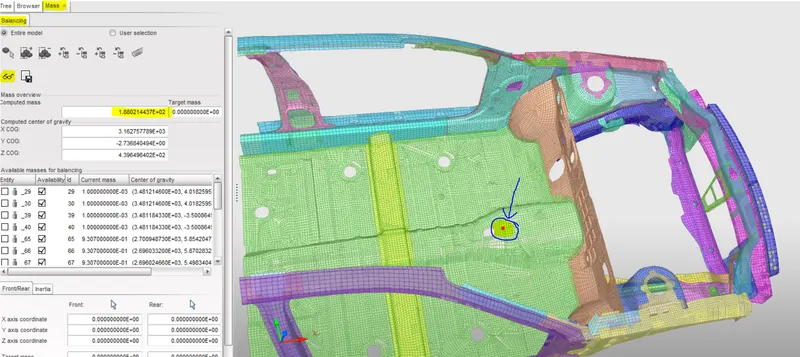
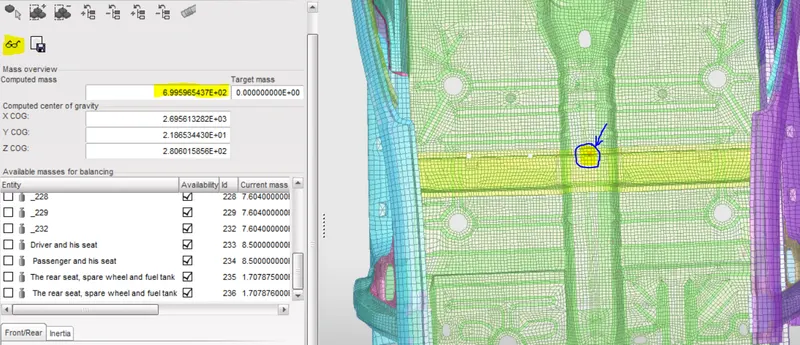
It is showing that the total mass of the body is 188.2 kg which is 700-188.2 = 511.8 kg less than our target mass. Before adding mass check the CG, To check the COG of the body we have to click on the specs icon.
Current weight: 188 kg
Target weight: 700 Kg
We have to add the mass in such a way that the Centre of gravity is exactly in the middle of the Cross Beam to simulate the real-time model.
We are only worried about the position of the COG (X and Y axis) and not the height (Z-axis).
We use Type 1 Mass, where mass is distributed on each node of the selected group.
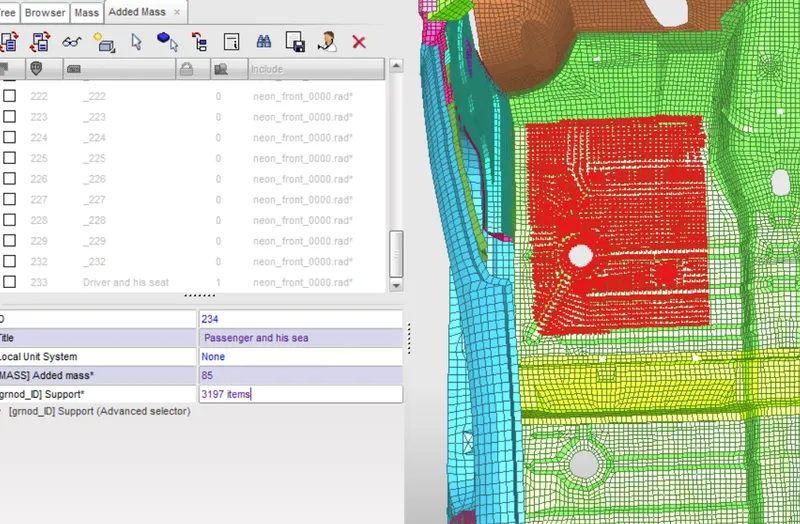
Added Mass > Create New >> Type =1 >> Enter the Value (ex. 85kg) >>right click to pick nodes >> Select the group node by selecting in the graphics >> Select Add/Remove nodes by picking selection >> After selected hit YES >> Save
MASS in KG DESCRIPTION
85 Driver and his seat
85 Passenger and his seat
170.7875 The rear seat, spare wheel, and fuel tank
170.7875 The rear seat, spare wheel, and fuel tank
After balancing the mass we achieve our target mass which is 700kg as shown in the figure below . After adding the mass:-
EXPORT HYPERCRASH FILE:
Export the rad file changes made in hypercrash and import the same file in hypermesh to make other changes
For that
Go to File >> Export >> RADIOSS
Now import the same "runname_0000.rad" file in hypermesh to do other changes
For that open hypermesh
Go to file >> Import solver deck >> Select Neon_0000.rad file >> Import
CREATE SELF CONTACT:
In this case, the Type 7 Contact Interface is defined. Interface TYPE7 is a multi-usage impact interface, modelling contact between a master surface and a group of slave nodes. It is also possible to consider heat transfer and heat friction.
All limitations that were encountered with interfaces TYPE3, TYPE4 and TYPE5 are solved with this interface:
- A node can at the same time be a slave and a master node.
- Each slave node can impact each master segment; except if it is connected to this segment.
- A node can impact more than one segment.
- A node can impact the two sides, the edges, and on the corners of each segment.
- It is a fast search algorithm without limitations.
- The main limitations of this interface are:
The Time step is reduced in case of high impact speed or contacts with a small gap.
It does not work properly if used with a rigid body at high impact speed or a rigid body with a small gap.
It does not solve edge-to-edge contact (to solve this, /INTER/TYPE11 should be used along with TYPE7).
TYPE 7: NODE TO SURFACE
This interface simulates the most general type of contacts and impacts. TYPE7 interface has the following properties:
- Impacts occur between a master surface and a set of slave nodes, similar to the TYPE5 interface.
- A node can impact one or more master segments.
- A node can impact on either side of a master surface.
- Each slave node can impact each master segment except if it is connected to this segment.
- A node can belong to a master surface and a set of slave nodes.
- A node can impact the edge and corners of a master segment. None of the previous interfaces allows this.
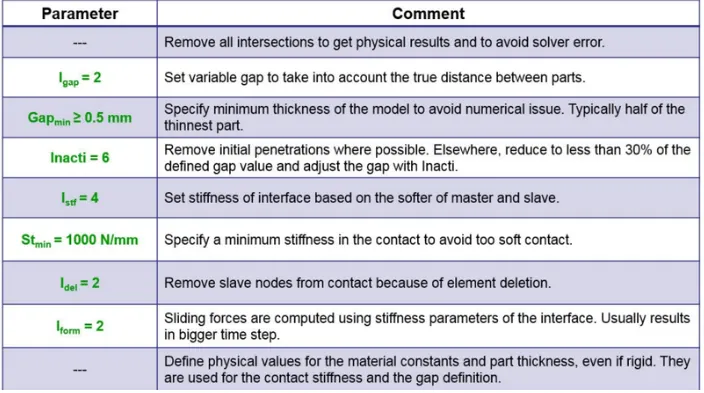
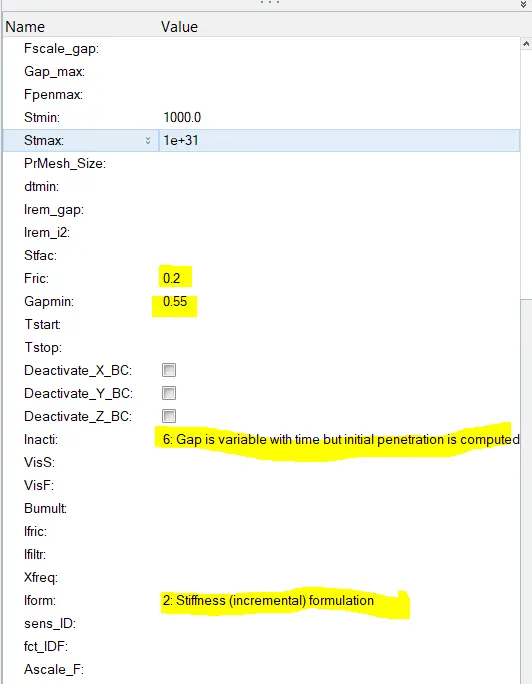
The recommended properties are as follows:
To create a new self contact
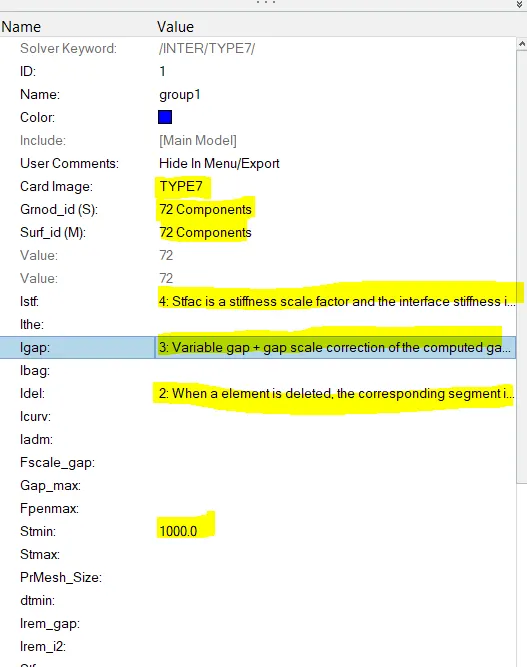
Goto model browser >> Right-click >> Create >> Contact >> Rename as Self contact >> Select slave node and master components >> Enter Type 7 recommended properties
We can select slave and master as a component and as well as node selection
For that, we just have to right-click where selecting nodes are components there is one option called create/Edit select and proceed with nodes or components. Then after this step, we simply need to give in the Slave nodes and the master segment. Since we are defining a Self-Impact in the model, the Slave and Master segments for this contact will be the entire given model. So, we then select the slave and master in the graphics area.
CHECK FOR PENETRATION AND INTERSECTION:
Penetration is defined as the overlap of the material thickness of shell elements, while Intersection is defined as elements that actually pass completely through one another. All models and especially impact models should be checked for penetrations and intersections and De penetrated to ensure the integrity of the model. Penetrations adversely affect results and should be removed.
To check penetration and intersection
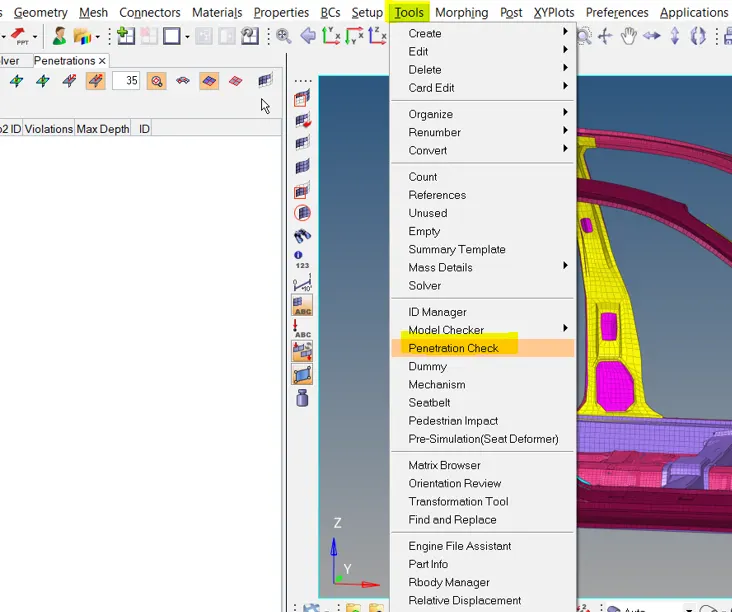
Got to Tools>> Penetration Check >> select the Group > Click on check
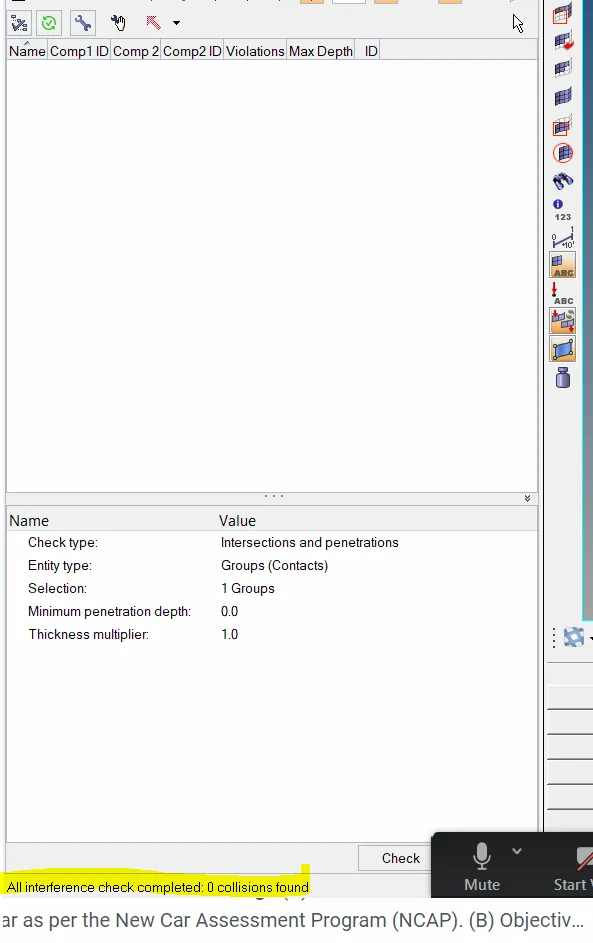
We can clearly see from the above figure there are no penetrations and intersections present in the model.
CREATE INTERFACE CONTACT BETWEEN BUMPER AND HEADLIGHT BRACKETS
Now create a new contact's
Goto model browser >> Right-click >> Create >> Contact >> Rename as contact between bumper and headlights >> Select slave node as bumper and master components as headlights >> Enter Type 7 recommended properties.
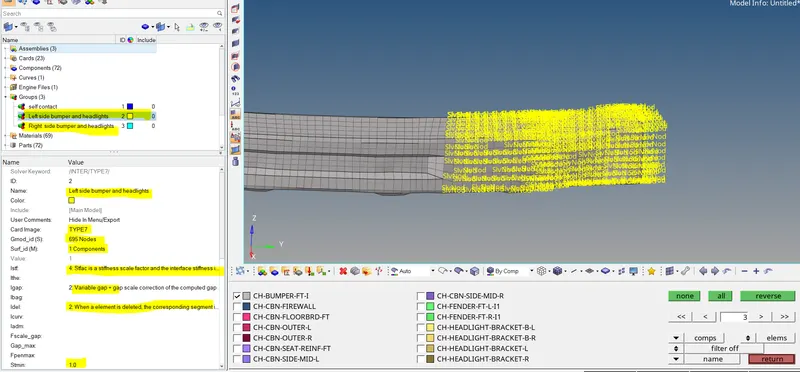
Master component selected
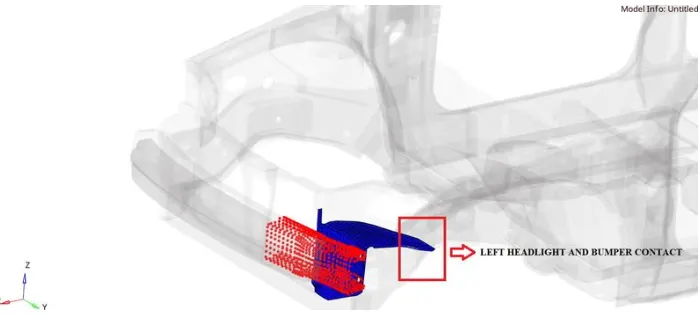
Review of left headlight and bumper contact
Here BLUE indicates MASTER component and RED indicates SLAVE nodes
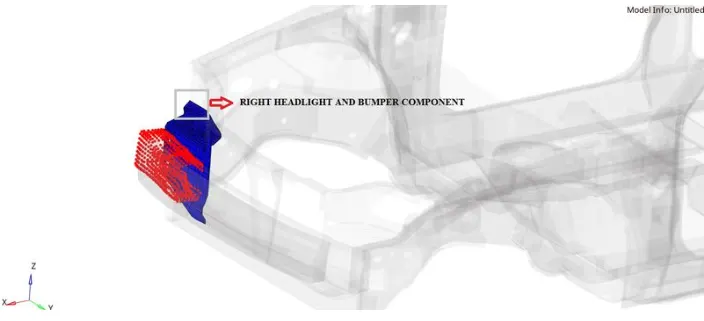
Review of right headlight and bumper contact
CREATE RIGID WALL
A rigid wall is a nodal constraint applied to a set of slave nodes in order to avoid node penetration to the wall. If contact is detected, then the slave node acceleration and velocity are modified. Mainly to constrain the movement of a moving body after impact, we will be using a plane wall. An infinite plane wall is a plane that extends to infinity. It is defined with two points.
Rigid wall entities provide a method for treating contact between a rigid surface and nodal points of a deformable body. In the Radioss user profiles, rigid walls can be created in the Model and Solver browsers.
To create an RWALL
We need a reference node to create an RWALL so for that we are creating a temp node in the mid of the bumper. Now translate this node to some distance with the reference of this translate node we have to create an R-wall with respect to that CO-ORDINATES. Now select the translated node and note down the X, Y, and Z coordinates.t is a Shell element with no thickness (gap) and infinite thickness. A search tolerance is given (optional) so that the nodes within the range will be taken as slaves. We are going to create an Infinite plane type Rigid wall.
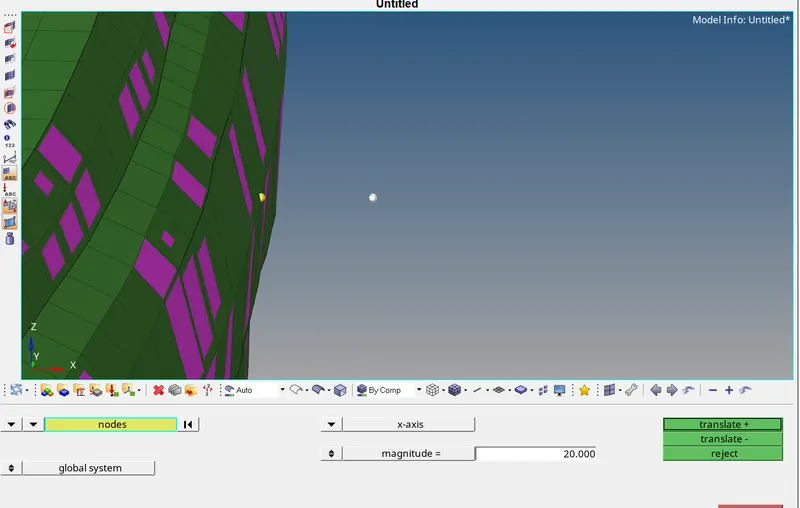
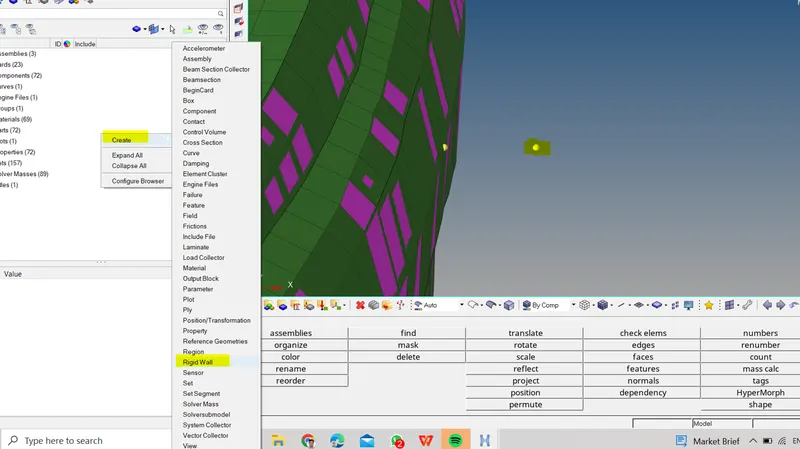
Go to Slover browser >> Create >> Rwall >> Plane
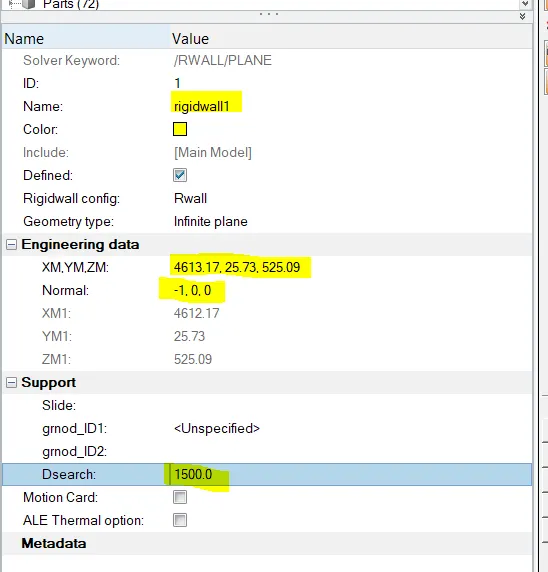
Enter the coordinates of the Temp node [XM, YM, ZM] >> Enter the Direction of the Normal [-1, 0, 0] >> Slect GRNOD_ID 1: set of displayed nodes >> Dsearch : 1000/1500 >> ok
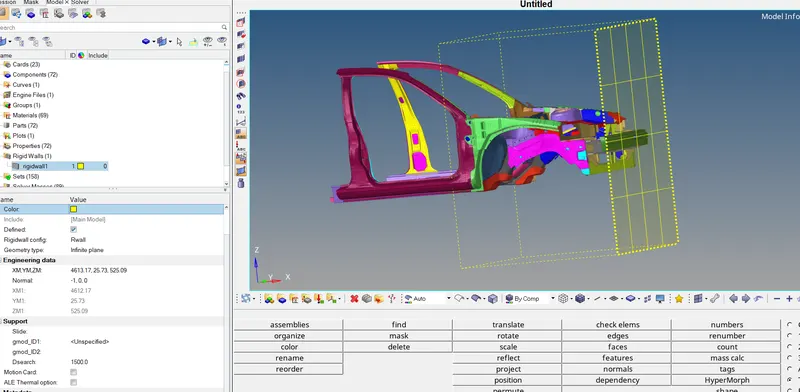
The rigid wall is facing opposite to the car so the normal is on the negative X-axis.
- We have to provide frictional parameters for the rigid wall when the slave nodes come in contact.
- Friction type [Slide] = 2: Sliding with friction
- Frictional Coefficient [FRIC] = 0.1
- The D-search distance we can use is around the range of 1000 mm. All the Nodes within this distance will be considered as salve nodes for the contact between the car and the Rigid Wall.
- We can add a separate set of nodes to this Rigid wall that the system should consider for Slave nodes in the option of [grnod_ID1] as shown below figure. We can use this option and add all the nodes in the model to the Slave nodes.
CREATE VELOCITY:
Initial velocity 35 mph.
Converting 35mph into ms
1mph = 0.447 ms
So, 35mph = 15.6464 ms
The initial velocity (Vi) is the velocity of the object before acceleration causes a change. After accelerating for some amount of time, the new velocity is the final velocity (Vf).
Initial velocity = [Final velocity - (acceleration×time)]
vi = vf - at.
vi = initial velocity (m/s).
To create a velocity
Go to solver browser >> Create >> Boundry conditions (BC) >> Inivel
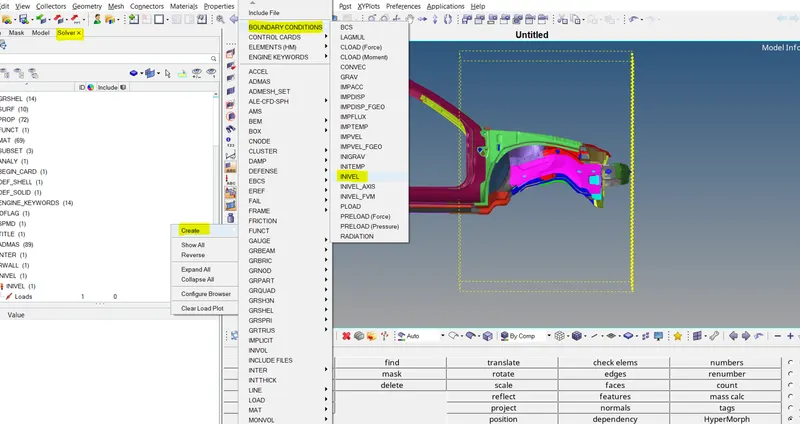
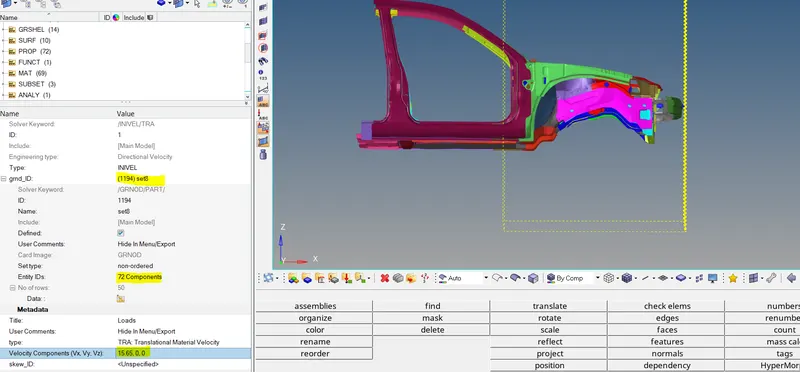
Define the Type of Velocity (Translational /Rotational).
Since we need to apply the velocity in the translational X Direction, define the velocity as 15.646m/s
CREATE SECTIONAL FORCES:
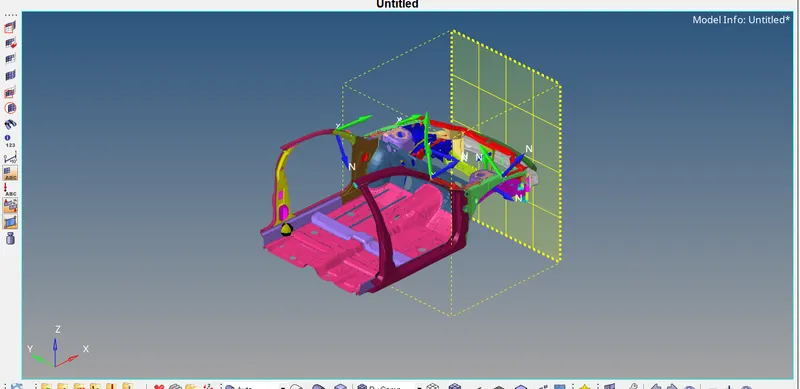
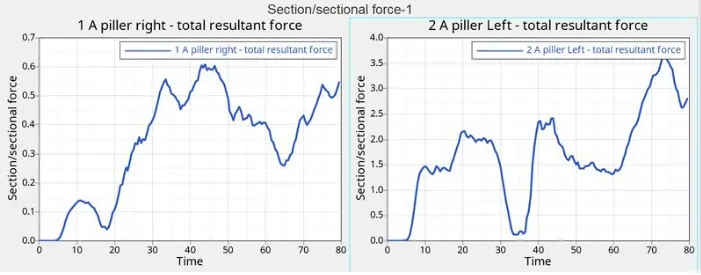
Creation of Sections at A-Pillar, Shot Gun, rails, and the Bumper in order to Study the sectional forces
We have to know how the forces are transmitted from the Bumper to the Dashboard and the rate of deformation. It is done in order to ensure the safety of the passenger.
Certain components have to crash (deform) more than the other so that the forces are distributed correctly leaving very little force left to transmit inside the cabin.
We are creating sections for the following parts:
Sl. no 1 2 3
LEFT SIDE SECTION RAIL SHOTGUN A-PILLAR
RIGHT SIDE SECTION RAIL SHOTGUN A-PILLAR
To create a section and Frame
Go to Slover browser >> Create >> Section >> SECT
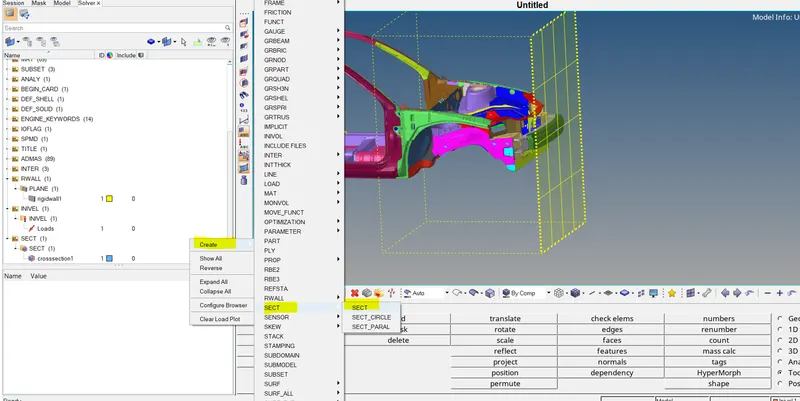
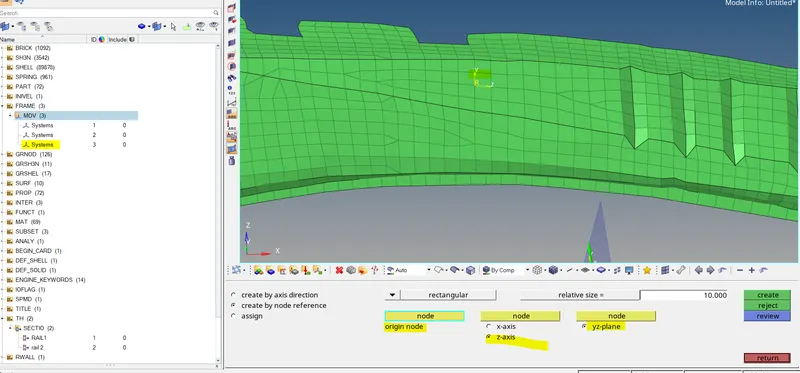
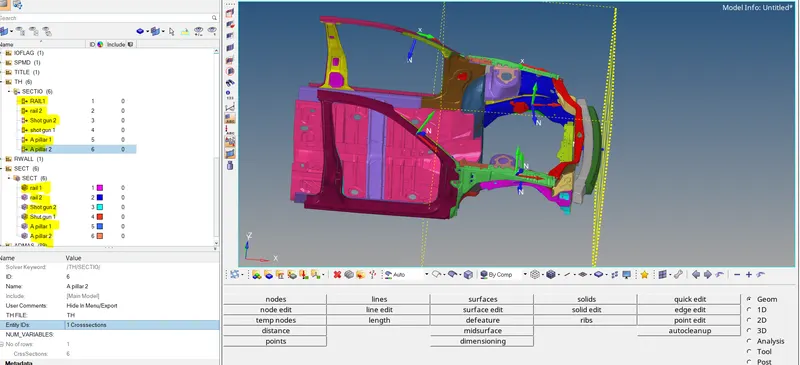
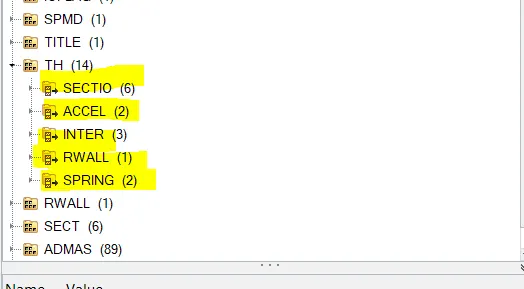
All 6 Section Created
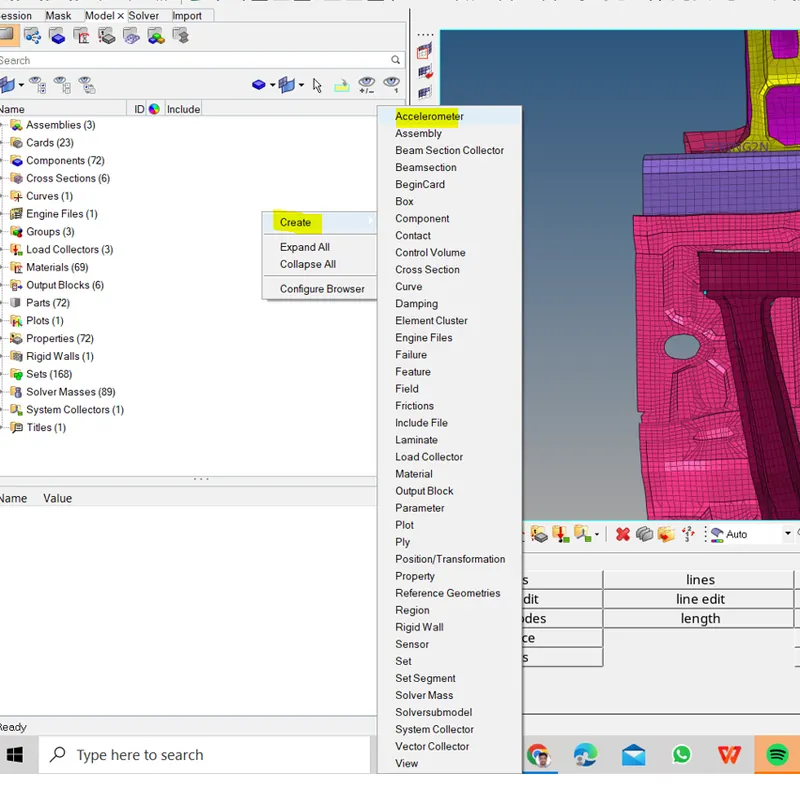
|
Engine Card
|
TSCALE
[Scale factor]
|
Tmin
[Critical Timestep]
|
Description |
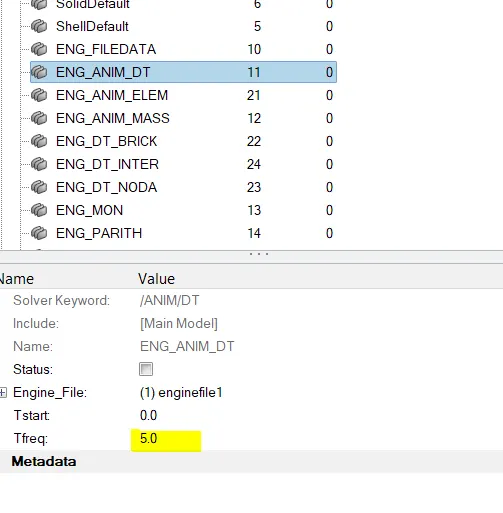
| ENG_DT_NODA | 0.67 | 0.001 | Mass is added to the node when the computed timestep becomes smaller than the critical timestep. |
| ENG_DT_BRICK | 0.9 | 0.0001 | Controls the timestep by small strain formulation on the elements if they cause the timestep to drop. |
| ENG_DT_INTER | 0.67 | 0.0005 | Uses the default constant timestep method. |
MODEL CHECKER:
This is the last and final check before giving it for simulation.
The Model checker will give us any warnings and Errors regarding the model definition, the boundary and Kinematic conditions, etc.
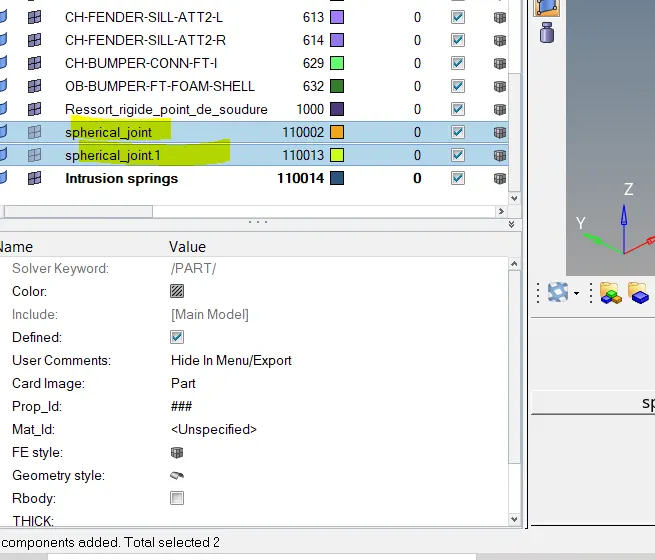
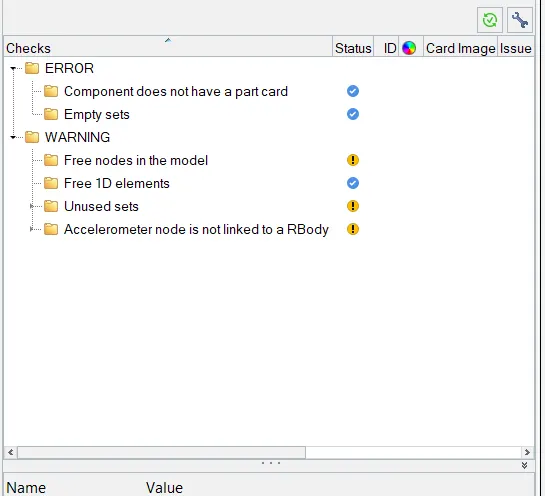
Now as you can see in the model checker tab all errors are rectified and rest of the warnings we can ignore.
RUN THE ANALYSIS IN RADIOSS
Switching to Hypermesh, and moving to Analysis > radioss, we can click 'save as to save the file if it hasn't been saved yet. Care must be taken to include '_0000.rad' in the file name since it's the starter file. After that, we can check the connectors option and input '-nt 4' in the options bar before clicking 'Radioss'. This starts the Radioss simulation.
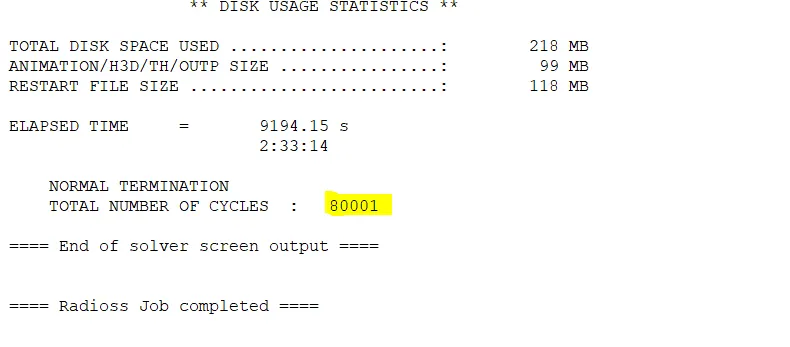
After completion of simulation a pop-up window appears showing Normal Termination without any errors as in figure below.
ANALYSING THE OUTPUT FILE
The next step is to carry out energy error and mass error checks and this is done by analyzing the RADIOSS engine output file. This can be accessed from the same directory as the starter and engine files and is denoted by the '.out' extension. The file in question contains '_0001.out' and can be accessed using any text editor - such as Notepad.
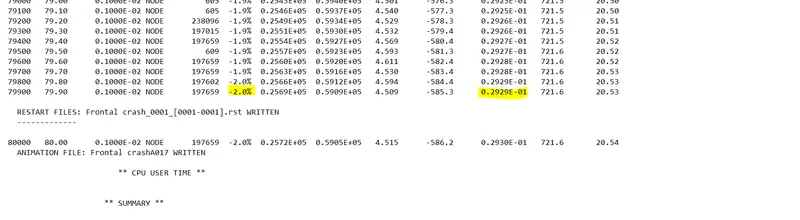
As we can see, the energy error is -2.0%. It is definitely within the acceptable range of -10% to +5% error. In addition to that, the mass error is 0.02929, which means that a negligible quantity of mass was added during the simulation, possibly for the sake of time step control/stabilization. It is a rather low amount so it's still acceptable.
Total Simulation Time: 9194.15s
No. of cycles: 80001
SIMULATION ANIMATION
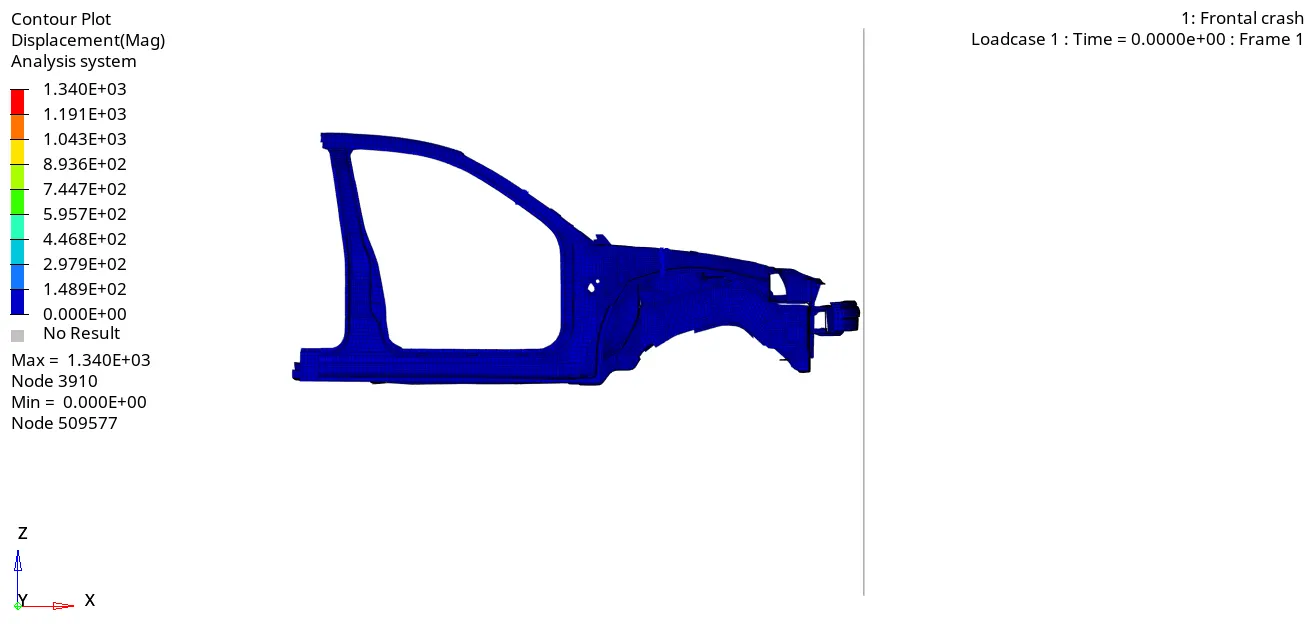
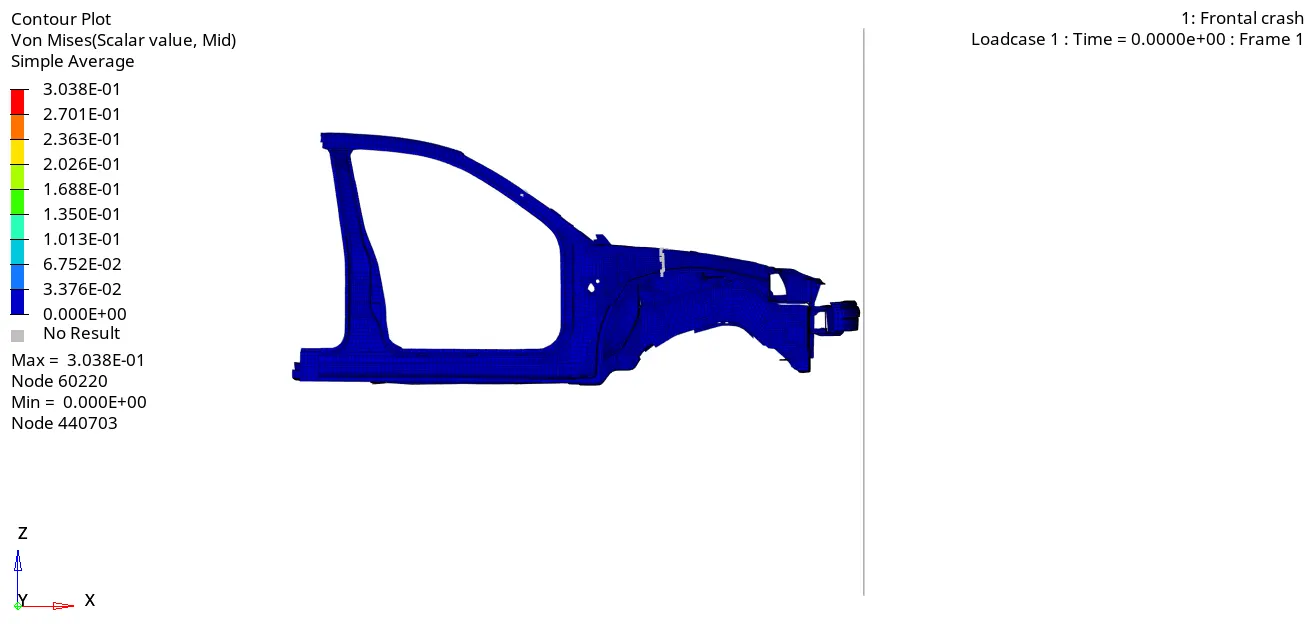
From the simulation, we can see that. Initially, the bumper starts crushing then the bumper forces are transferred to the left and right rail then from the rail forces are transferred to A-Pillar LH and RH. In each stage, the forces are going to reduce because energy is absorbed in each stage. Because of no engine blocks, suspension system and tyre etc the car BIW is going to go down at the end of the simulation
From the Von Mises stress plot, we can say that the stress distribution is quite good in the vehicle after the crash. There are very few areas where we can see stress concentration. Generally the stress is more in bumper region as it is the first point of impact.
GENERATING THE PLOTS
After generating the simulation, we can then go ahead and generate the plots. Using the same client selector, we can switch to Hypergraph2D . In the Hypergraph client, we are asked to import the required file, which is the T01 (Time history file ) variant of the file.
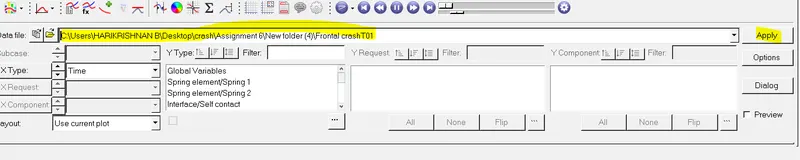
On importing, we can build the plots using different variables. We shall first look at general plots of energies and rigid wall forces generated in and by the entire BIW respectively.
Some basic definitions of energies:
- Energy: Energy, in physics, the capacity for doing work. It may exist in potential, kinetic, thermal, electrical, chemical, nuclear, or other various forms. In FEA we have Total Energy, Internal Energy, Kinetic energy, Contact energy and hourglass energy
- Total Energy (TE): Total Energy is the sum of Internal Energy, Kinetic energy & External Work
- Internal Energy (IE): The internal energy of a thermodynamic system is the energy contained within it. It is the energy necessary to create or prepare the system in any given internal state. It does not include the kinetic energy of motion of the system as a whole, nor the potential energy of the system as a whole due to external force fields, including the energy of displacement of the surroundings of the system. It keeps account of the gains and losses of energy of the system that are due to changes in its internal state
- Kinetic energy (KE): In physics, the kinetic energy (KE) of an object is the energy that it possesses due to its motion. It is defined as the work needed to accelerate a body of a given mass from rest to its stated velocity.
- Contact Energy (CE): Contact energy is the energy acting opposite to the system to prevent the penetration acting on the system due to the applied load case.
- Hourglass energy (HE): This is usually done by adding extra stiffness or viscosity across the diagonal which adds extra strain energy into the system and we call this Hourglass Energy.
GLOBAL VARIABLE GRAPHS: ENERGIES
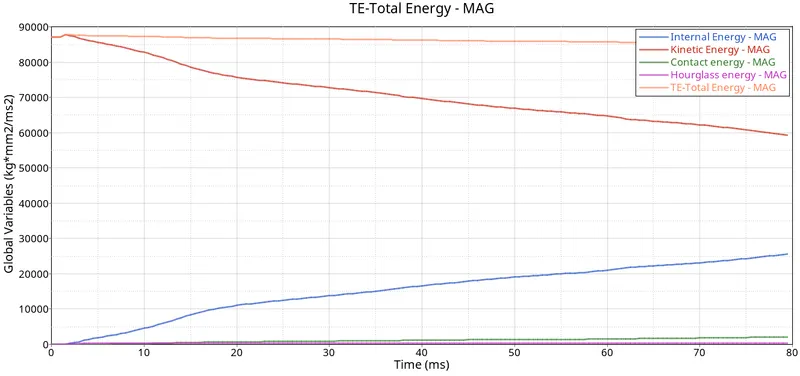
Global variable VS Time
INTERNAL ENERGY AND KINETIC ENERGY:
The changes in kinetic and internal energies occur at the exact moment the BIW makes contact with the rigid wall. Understandably, the BIW loses kinetic energy throughout the simulation due to the obvious decrease in velocity. At the same time, it absorbs the forces, and this results in an increase in internal energies, and as a result, deformations also occur. Thus the total energy in the system is almost constant at 87000 J and due to some energy loss which we can see in energy error, there is some decrease in total energy.
From the above graph, we can see that the Hourglass energy is almost negligible since we have used an Improved integrated element formulation (QEPH).
Take a look at the contact energy graph:
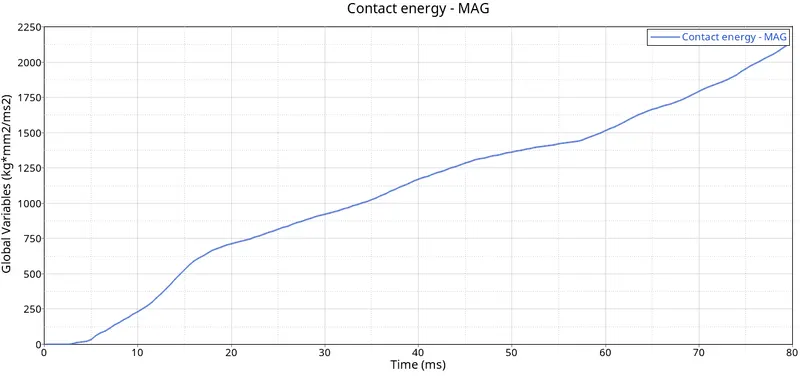
Contact energy is a type of energy that is formed when one element comes in contact with the other or neighboring elements. The opposing force created by this element forms the contact energy. In this case, it increases after 5 ms, at this point the model starts deforming in such a way that penetration of nodes occurs. When certain regions of the model press on themselves, buckled elements are forced into contact.
The increase in contact energy affects the overall energy of this system, which is why there is a decrease in the total energy over the course of the simulation. it is a negligible decrease though. The magnitude of contact energy generated is much lower.
Rigid Wall Forces
Take a look at the rigid wall forces generated:
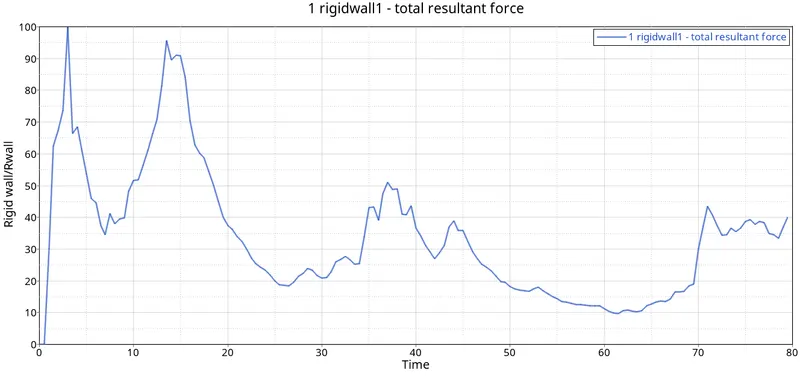
The rigid wall forces peak at around the 16ms mark, which looks like the point in time where the BIW had exhausted its deformation capabilities in the bumper and reinforcement regions. After that, deformation (forces) were transferred to members that house the engine and tyres. Due to the freedom given to deform in those regions, the rigid wall probably experienced a reduction in forces from there.
OUTPUT REQUESTS
SECTIONAL FORCES:
1. On RAILS:
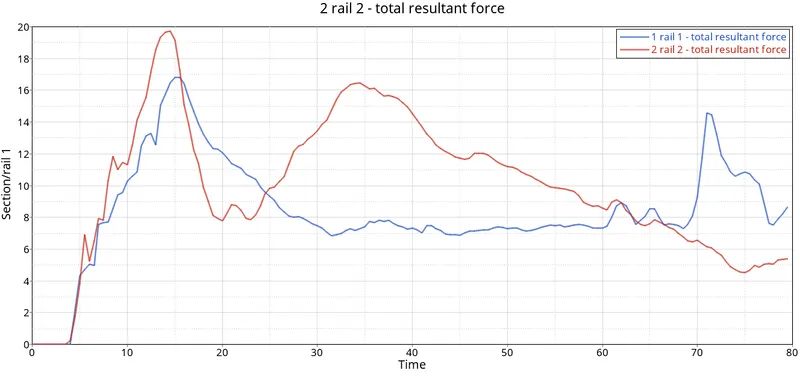
Sectional forces on rails VS time
The maximum cross-sectional force at Left Rail is 17 kN/mm at t= 15ms whereas the maximum cross-sectional force at the Right rail is 19.9kN/mm at t=17ms. The force acting on the rail is the force transmitted by the bumper during the crash. The force transmitted by the bumper to the rail can be unequal due to which the force received at the LH rail may differ from the RH rail. During a crash, the rail will get into direct contact with the rigid wall which will increase the compressive force and then deform. Therefore, the compressive force drops down.
2. On Shotguns:
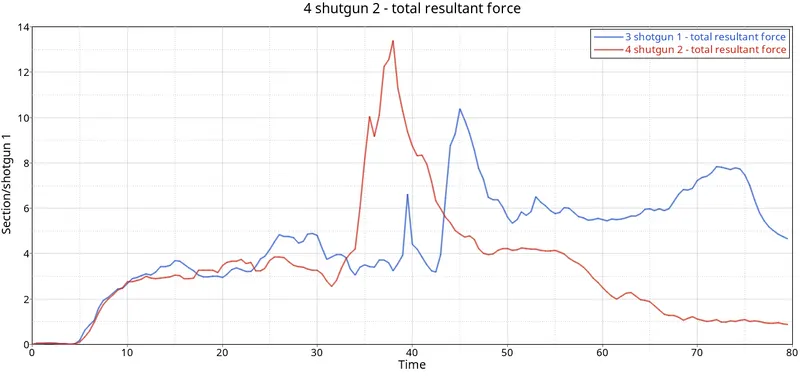
Sectional forces on shotgun VS Time
The maximum cross-sectional force at Left Shotgun is 13.2 kN/mm at t=38ms whereas the maximum cross-sectional force at Right Shotgun is 10.3 kN/mm at t=45ms. The Force that occurred at the shotgun is the force transmitted from the rail section. The force propagation is not the same at both the rails and hence the amount of deformation at both the shotgun sections is different. Once the Compressive force reaches its maximum value it starts to deform rapidly. Therefore, the Compressive force is decreasing as referred from the graph. As the crash happen continuously, the shotgun will come into contact with the Rigid wall as found in Animation, the rigid wall also exerts a force directly onto the shotgun and hence there is an increase in the Sectional force as seen in the graph.
Accelerometer VS Time
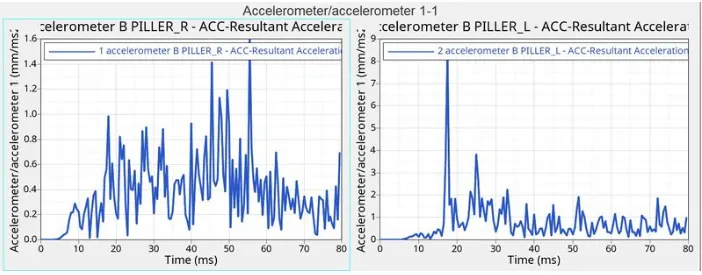
As we all know Acceleration is the rate of change in velocity. To measure the acceleration, we placed the accelerometer near the Rocker of the B-Pillar on both sides. From the above graph, we can see that initially, the acceleration is constant before the vehicle hits the rigid wall. Once the Car hits the rigid wall with the initial velocity, The acceleration of the vehicle during the crash is not constant across the structure. The front of the vehicle slows down immediately as it hits the rigid wall, while the rest of the structure decelerates at a slower rate as seen in the graph. As seen from the graph there is a sudden increase in the acceleration, this might be because of some vibration that occurs during the crash with respect to the point where the accelerometer is placed.
Maximum acceleration at LH = 8.40 mm/ms2 at t=17.5 ms
Maximum acceleration at RH = 1.59 mm/ms2 at t=55.5 ms
AXIAL FORCES ON RAIL OF BUMPER:
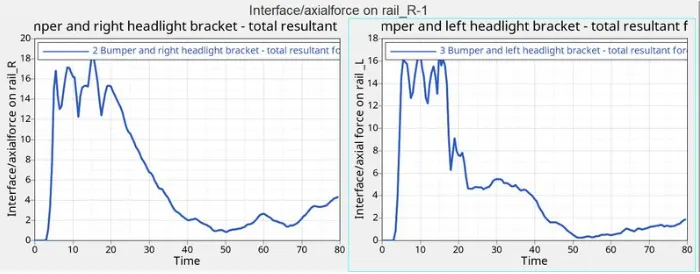
The force from bumper to rail VS Time
From the graph we can see that initially there is no axial force is transmitted from the bumper to the Rail. Once the Vehicle hits the rigid wall, first the Bumper will start deforming and transmitting the strain energy to the rail sections. From the graph, we found that the Maximum axial force received from the bumper to the Left-hand rail is 16.89 kN at 15 ms and the Maximum axial force received from the bumper to the Right-hand rail is 18.31 kN at 15 ms.
OBSERVATIONS
Generally, the outer body members in the BIW are supposed to be symmetrical about the center. That means the plots generated in each of the cases involving either side of the same part should have been very similar in terms of shape and values but that is not the case here. The left side of the vehicle in general seems to be absorbing most of the impact force due to two possible reasons:
1. The location of the reference point on the bumper used to create the rigid wall was probably not at the exact center of the bumper component. This resulted in the first point of impact being off the center and invariably leading to the unequal distribution of forces
2. The locations of the sections created may not be exactly symmetrical about the center of the BIW.
Coming to the accelerometer graphs, it seems like there is a lot of fluctuation in acceleration. This is probably the result of vibrations created during impact. If the BIW hadn't undergone the crash, there wouldn't be spikes in those plots, since in the general sense, acceleration and deceleration occur gradually. These accelerometers are pivotal in detecting these spikes and drops and help in the functioning of safety systems, like airbags.
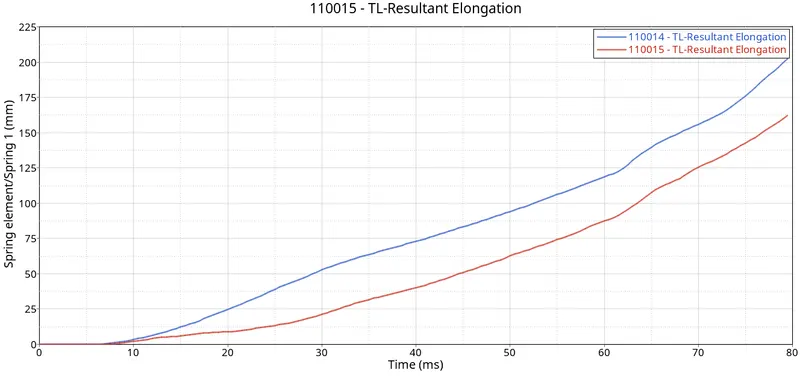
With regards to the intrusion plots, the panel on which the two nodes are located doesn't undergo much deformation locally, which explains the similar graphs.
RESULTS
Frontal crash analysis was carried out on the given front half of a BIW model of the Dodge Neon as per the given requirements. The output requests were also generated after the creation of cross-sections in each of those regions. Acceleration and intrusion values were also measured at certain points of the model.
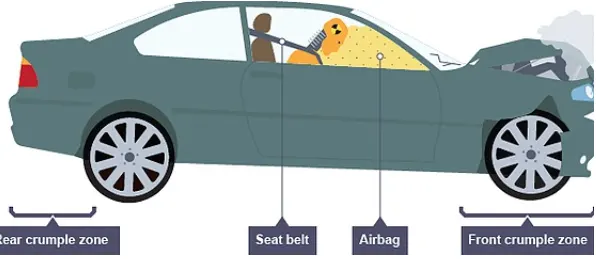
The analysis also proves the importance of the crumple zone - which is the front portion of the BIW in this case. It absorbs most of the forces generated during a frontal crash and therefore, protects the occupant(s).