RADIOSS PROJECT 1: Frontal crash analysis of NEON dodge model using HYPERMESH and RADIOSS
OBJECTIVE: To simulate a frontal car crash onto a rigid wall using Hypermesh and RADIOSS. To compare the forces being applied onto various sections of the car due to the crash. To detect the accelerations and intrusions occurring at various parts of the car.
PROCEDURE:
To complete the simulation of a car crash test, the following steps were followed:
1. Import geometry into Hypermesh / Hypercrash
2. Add masses at appropriate locations in order to make the model more realistic in terms of weight
3. Assign contact interface (Type 7)
4. Check for penetrations and connections
5. Add initial velocity to the model
6. Give appropriate time steps to the model
7. Create a rigid wall in from of the car
8. Create sections at appropriate areas and give output blocks for detecting forces at these sections
9. Create an accelerometer at base of B pillar and generate an output block to detect acceleration
10. Detect intrusions at the dash wall using skew method
Initially the geometry was imported into Hypermesh / Hypercrash. The unit system followed for this particular crash analysis was [kg mm ms].
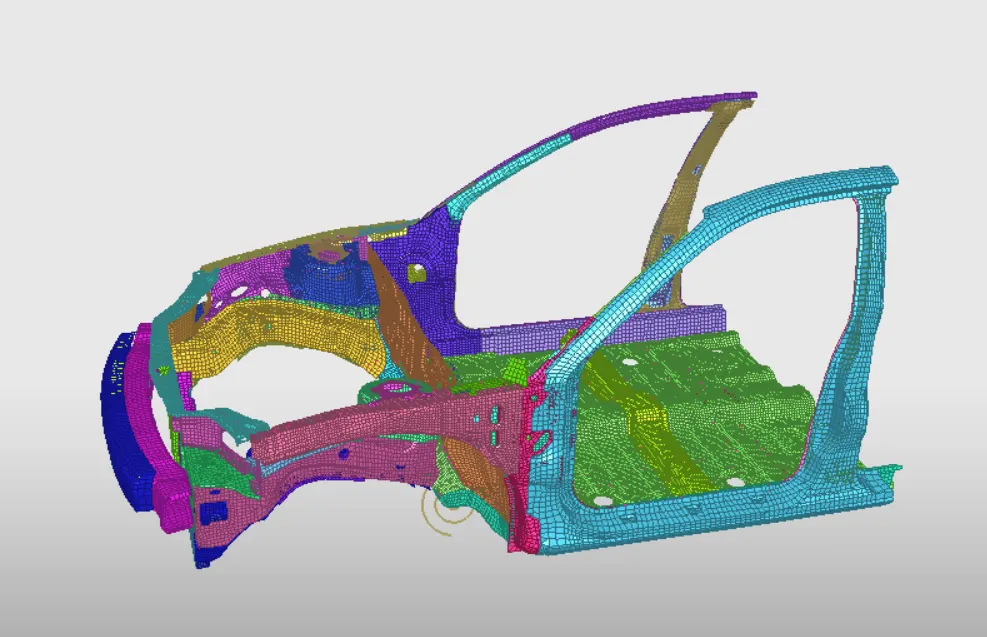
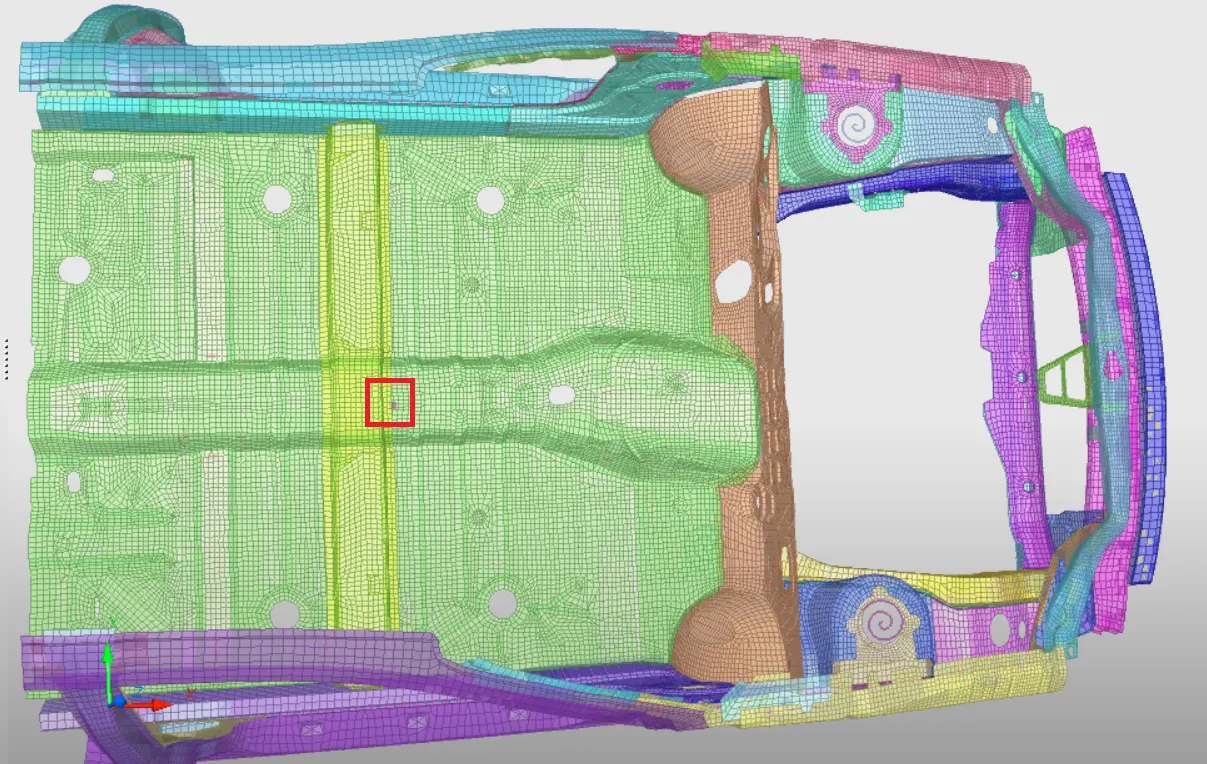
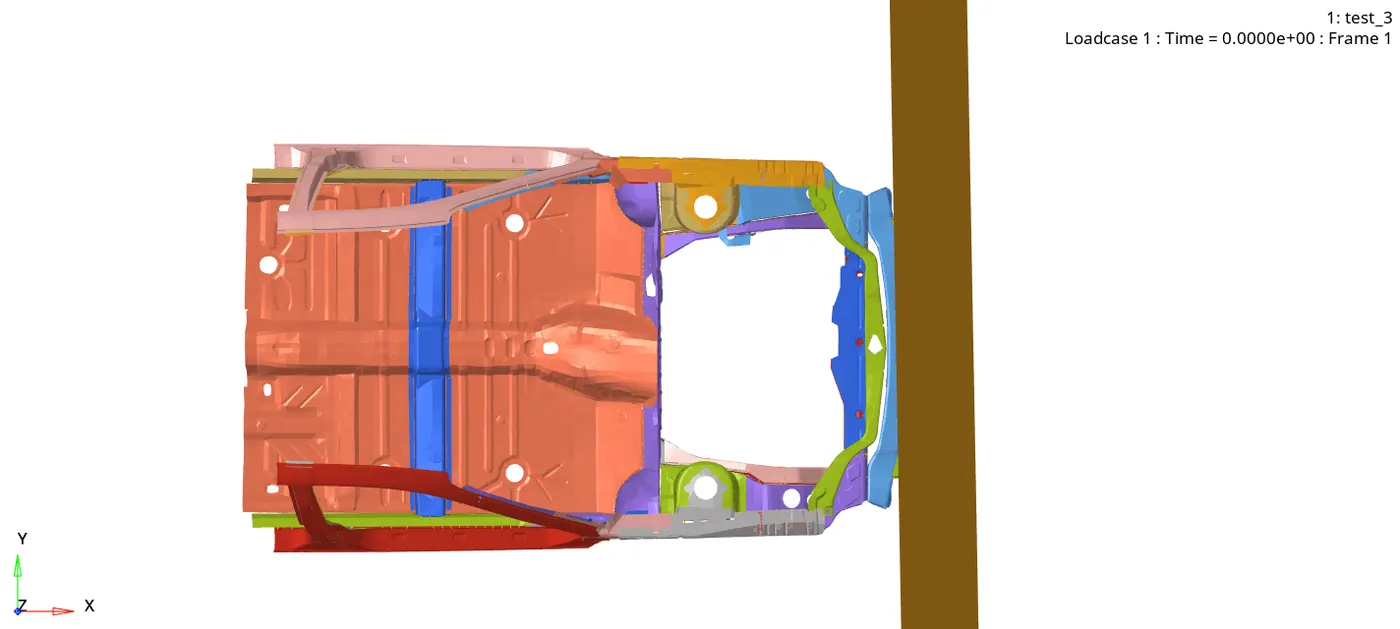
The geometry of the car model consisted only of the most important BIW fixtures in order to stay within the limit of the software license. The geometry is given below:
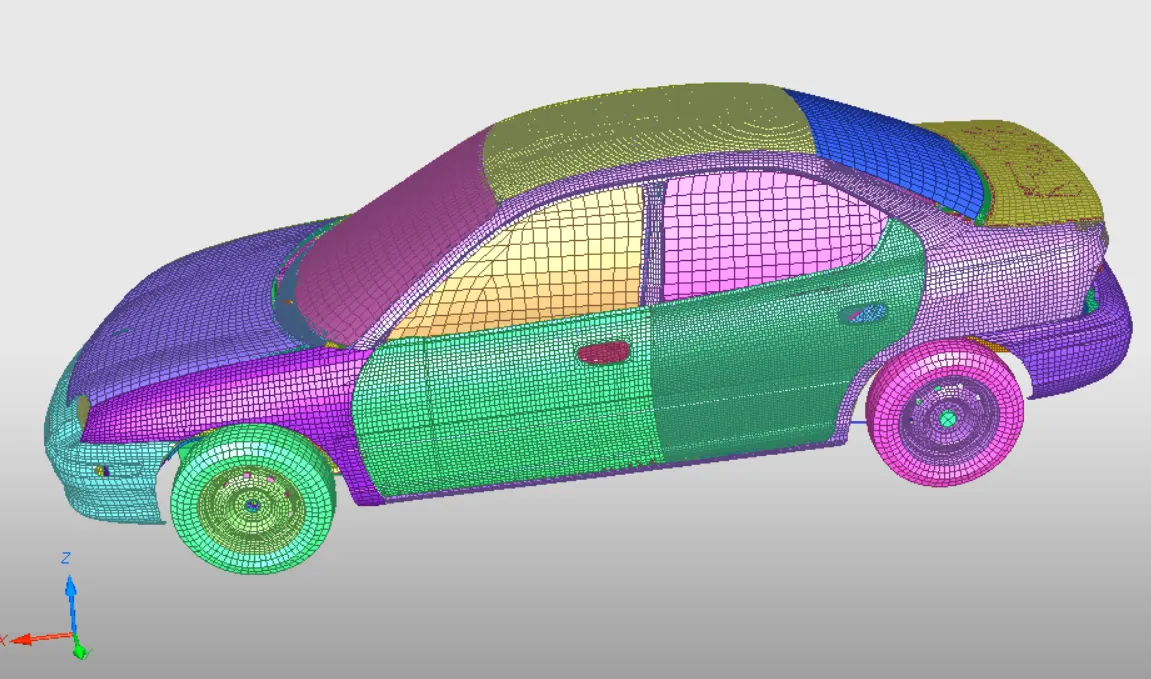
The full model would look like the below figure:
MASS ADDITION:
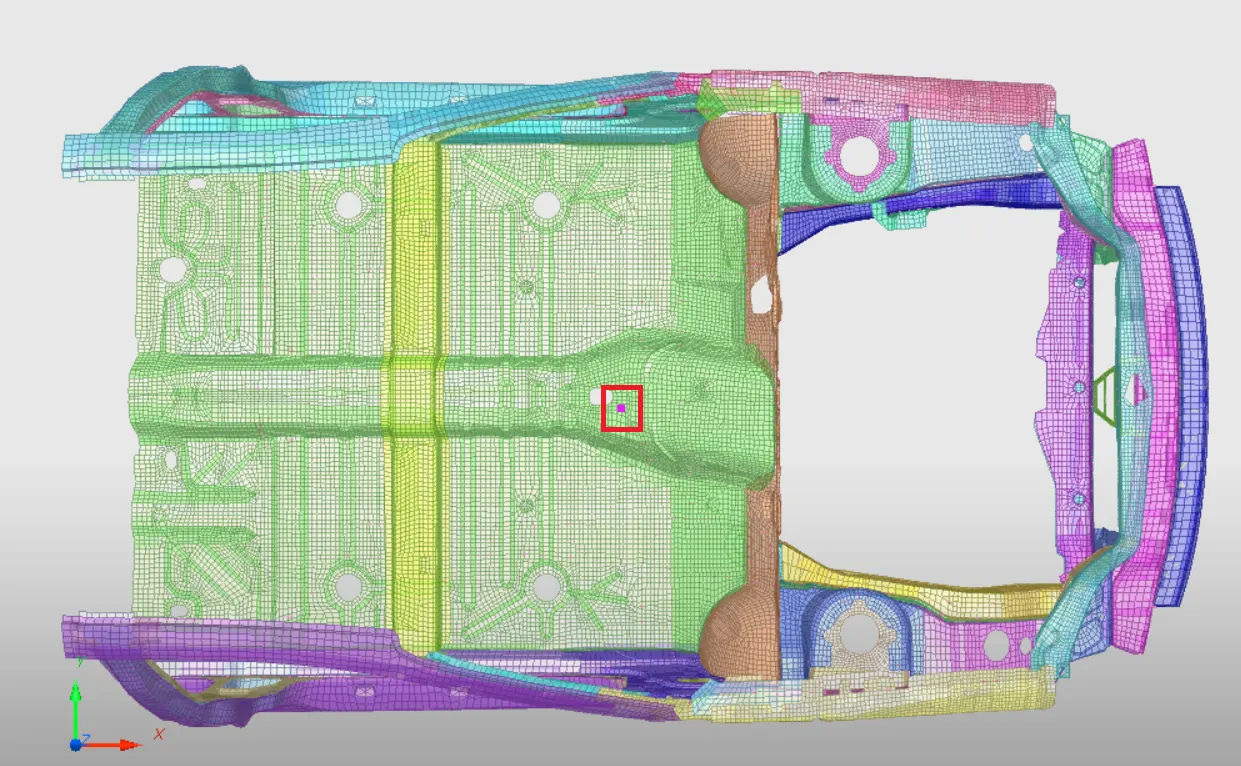
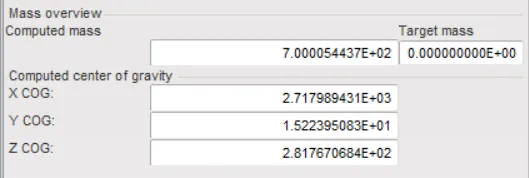
In order to ensure good quality of the results, attaining a mass similar to the full model is very important in order to preserve the kinetic energy that would be induced due to the increased mass in the full model. For this reason, mass addition was necessary for the present simulation. Mass addition in Hypercrash can be done by going to the Browser and double-clicking on Added Mass. In Added Mass tab, create new added mass. Using this, we can select the appropriate elements and add mass. In the present case, type 3 added mass was implemented. The front two seats were added with 100 kg each and the back two seats were added with 155.79 kg each. This was done to get the overall car weight to 700 kg which would be more realistic to the full model. The center of gravity was also shifted as a result of the added masses and now it is present in a more realistic location. The relevant pictures with regards to the mass addition are given below.
Initial center of gravity:
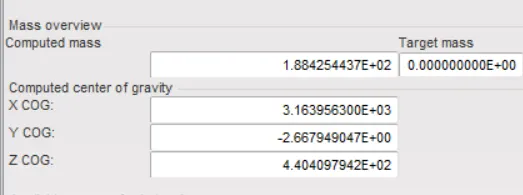
Final center of gravity:
CONTACT INTERFACE:
To simulate contact with the wall, other components and even the same component with itself, creating contact interfaces is a crucial step in crash simulation. Not only the type of contact, but also the various properties assigned to the contact interface are crucial in dictating things such as accuracy, computational time, etc. In the present case, Type 7 interface i.e Nodes to surface contact was implemented which is a very general type of contact and can be used in various applications because of its versatility. The properties assigned to it were also ensured to be recommended properties especially for car crash analysis. The entire model was selected and type 7 contact was implemented. This was done in Hypercrash by going to Load Case => Contact Interface. Type 7 contact was created and the following properties were given to it:
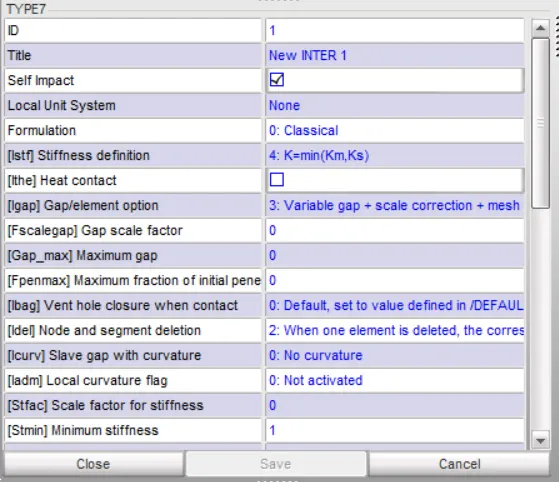
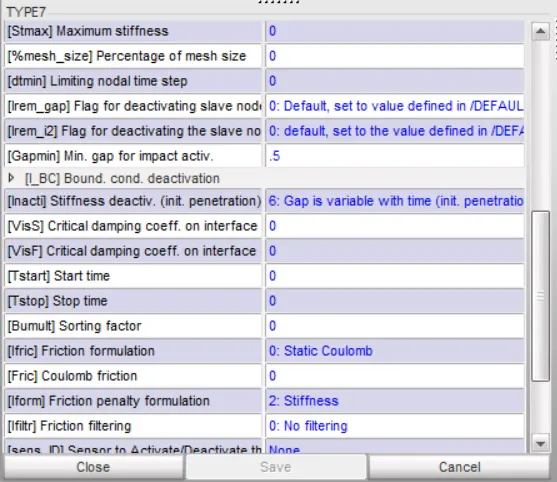
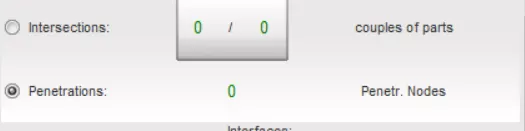
These properties are recommended because they strike a good balance between computational costs and accuracy. Unnecessary and redundant contact interfaces were removed. Penetration check was done which resulted in no penetrations.
INITIAL VELOCITY:
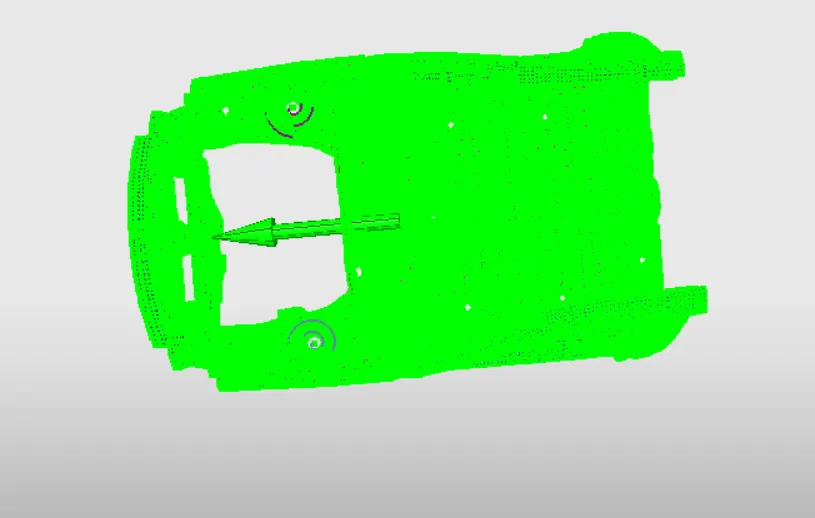
Initial velocity is fairly simple to add. In hypercrash, go to Load Case => Initial velocity. The velocity was provided in the x-direction along the global coordinate system. The velocity provided was 35 miles per hour which in conversion according to the present units goes to 15.6464 mm/ms.
RIGID WALL:
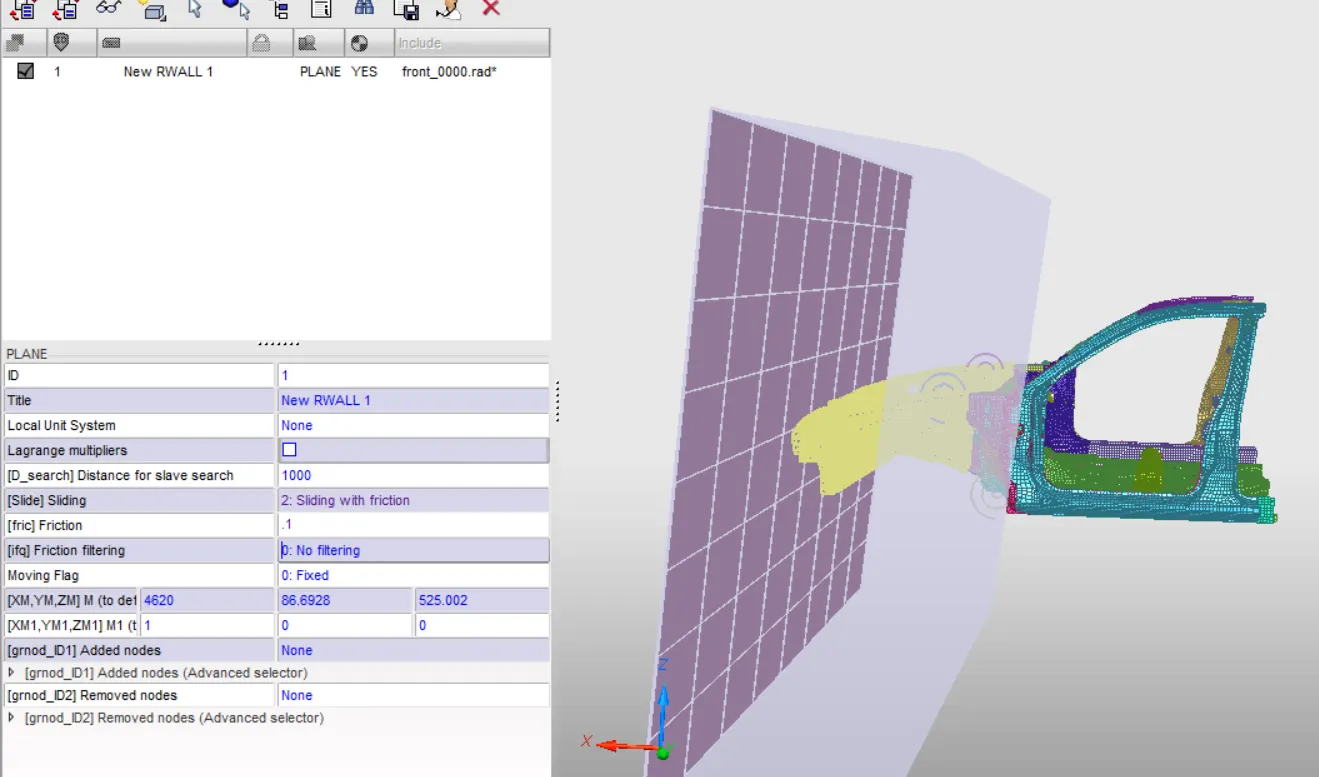
Rigid wall is another important step because rigid wall is the part that will lead to car crash of the present geometry. Rigid wall can be added using Hypercrash by going to Load Case => Rigid Wall. A planar rigid wall was constructed a few mm in front of the car.
MODEL CHECKER:
The model has to be checked to ensure that the simulation runs smoothly and accurately. Errors need to be rectified before simulation. Warnings may introduce minor errors and can be dealt with if deemed important. Some warnings might even be ignored if they are unimportant. Model checker can be run in Hypercrash by going to Quality => Model Checker => Run.
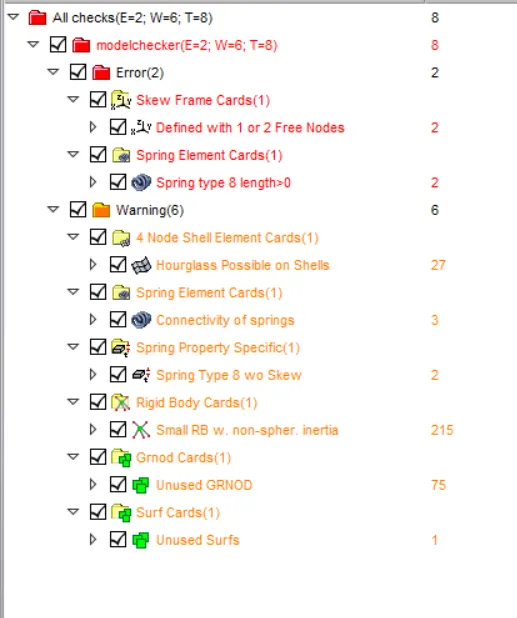
Initially the model checker ran into several errors which were dealt with appropriately. Some warning were also dealt with.
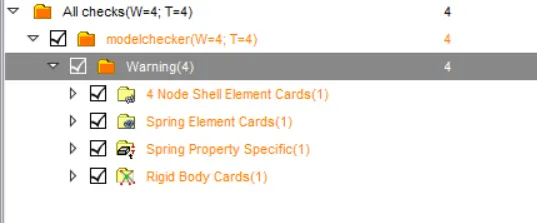
The remaining warnings can be ignored.
TIME STEP:
Time step is also a very important step. Time steps can be given to various element types. In the present case, time step and simulation time was given using Hypermesh by going to Tools => Engine File Assistant. 5 microseconds nodal time step was given with 80 ms simulation run time.
OUTPUT BLOCKS:
Apart from the default output blocks that RADIOSS provides for all simulations, a few specific output blocks had to be created for the purpose of this present assignment in order to check the forces that are acting upon a few important areas as well as intrusions and accelerations.
To check the forces acting on cross-sections, in Hypermesh we can go to Solver browser and go to SECT => Create => SECT => SECT_CIRCLE. By selecting appropriate nodes, moving frames, orientation and radius, the cross-section can be created. To create output blocks for this cross-section, go to Solver browser and go to TH => Create => SECTIO. Select the section and select the required parameters that should be included in the output such as normal and tangential forces. In the present analysis, cross-sections at rail, headlight bracket, A-pillar, Shotgun and hinge pillar were created.
Apart from cross-sections, accelerometers were created on base of B-pillar and output block for accelerations of the accelerometers were also created.
To detect intrusions on the dash wall, a skew frame was created on the seat reinforcement region to act as a frame of reference for the nodes on the dash wall. Then output block was created to detect the displacement occurring on the nodes with respect to the skew frames.
RESULTS:
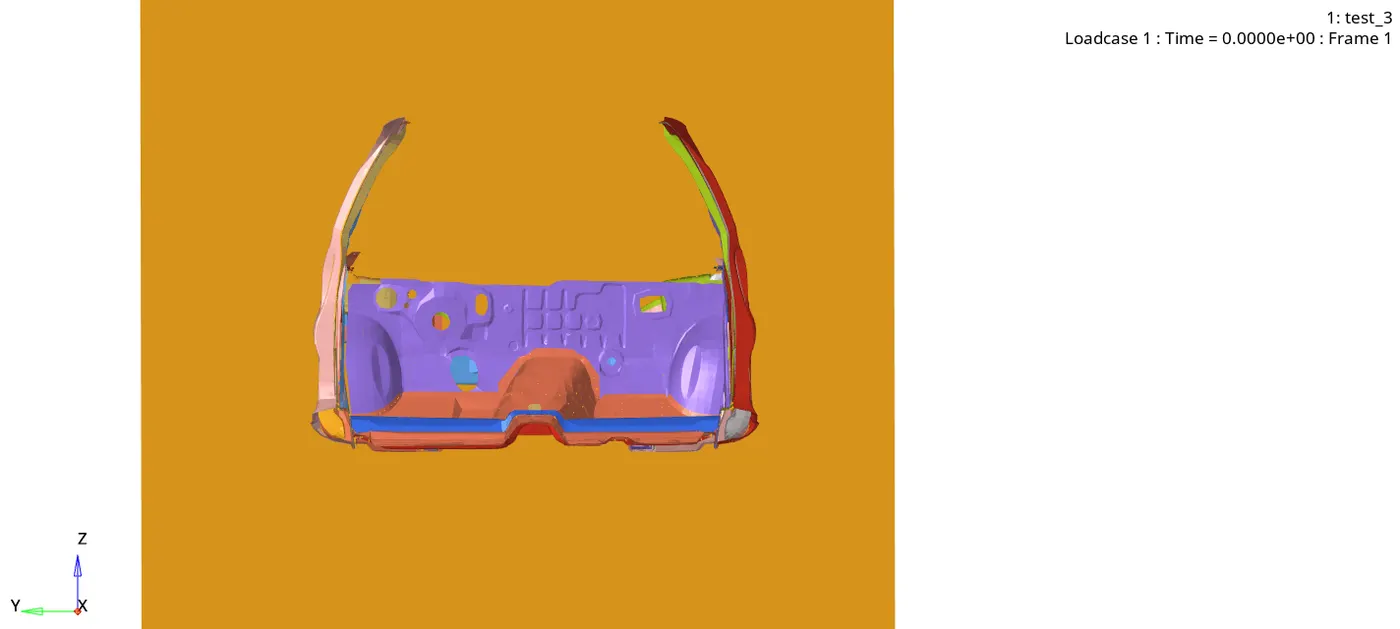
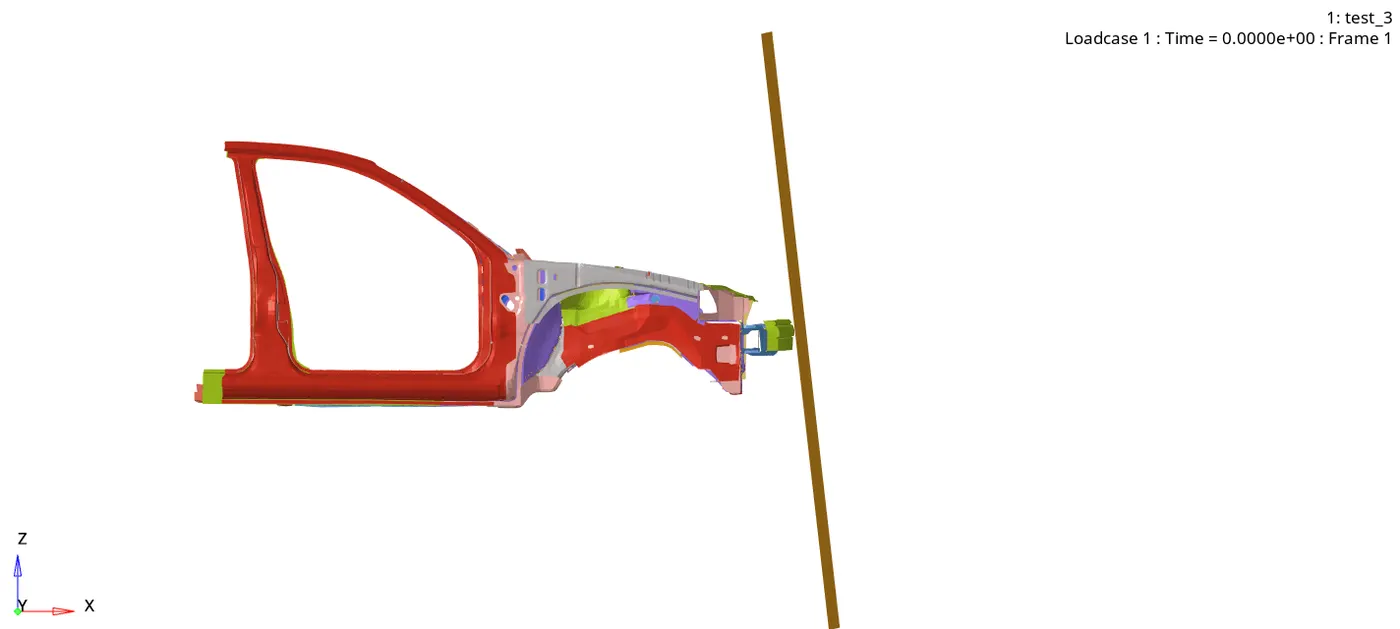
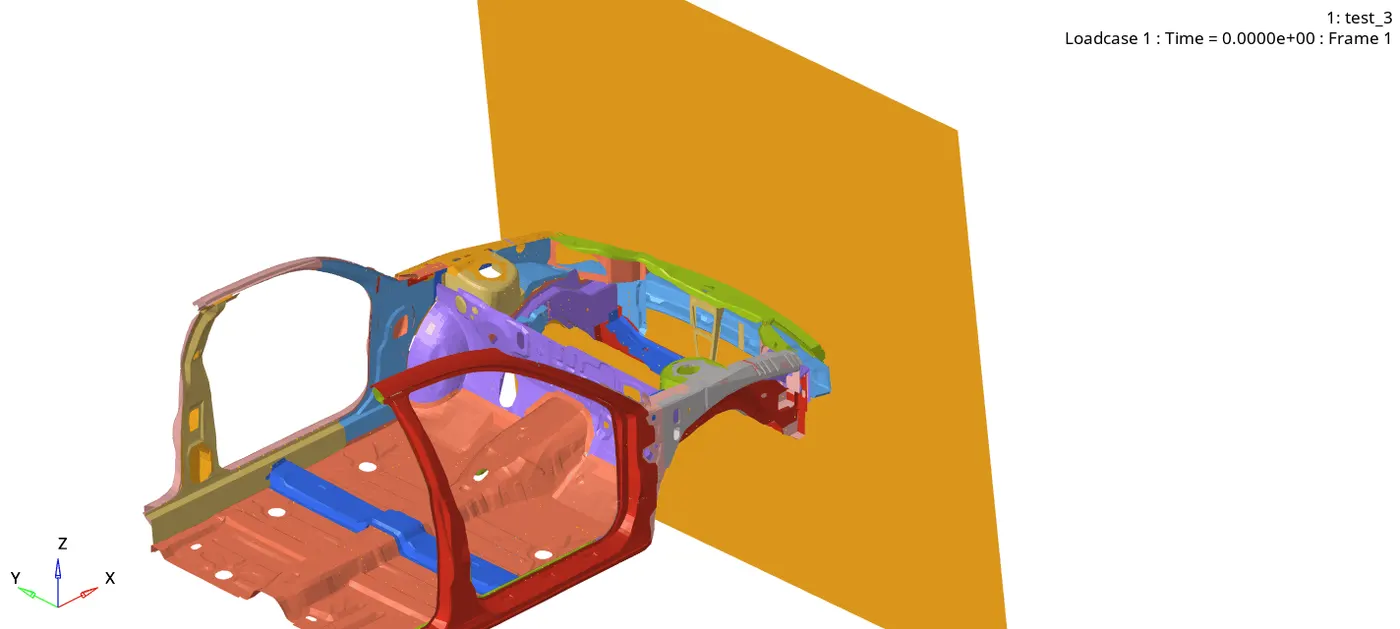
The RADIOSS simulation was run. The run time was 8324.19 s. Maximum energy error of -1.5% and maximum mass error of 0.1236 E-2 were observed which means that the results are well within the limits and hence can be trusted. The crash can be seen below in various orientations:
VON MISES STRESS
Von-Mises stress is very important in understanding the stresses that are acting upon the BIW fixtures when car crash occurs. It is important for stress to flow from one component to the other so that stresses can be absorbed smoothly by the car components so as to ensure maximum safety to the passenger. The maximum von-mises stress of 0.3432 MPa was observed.
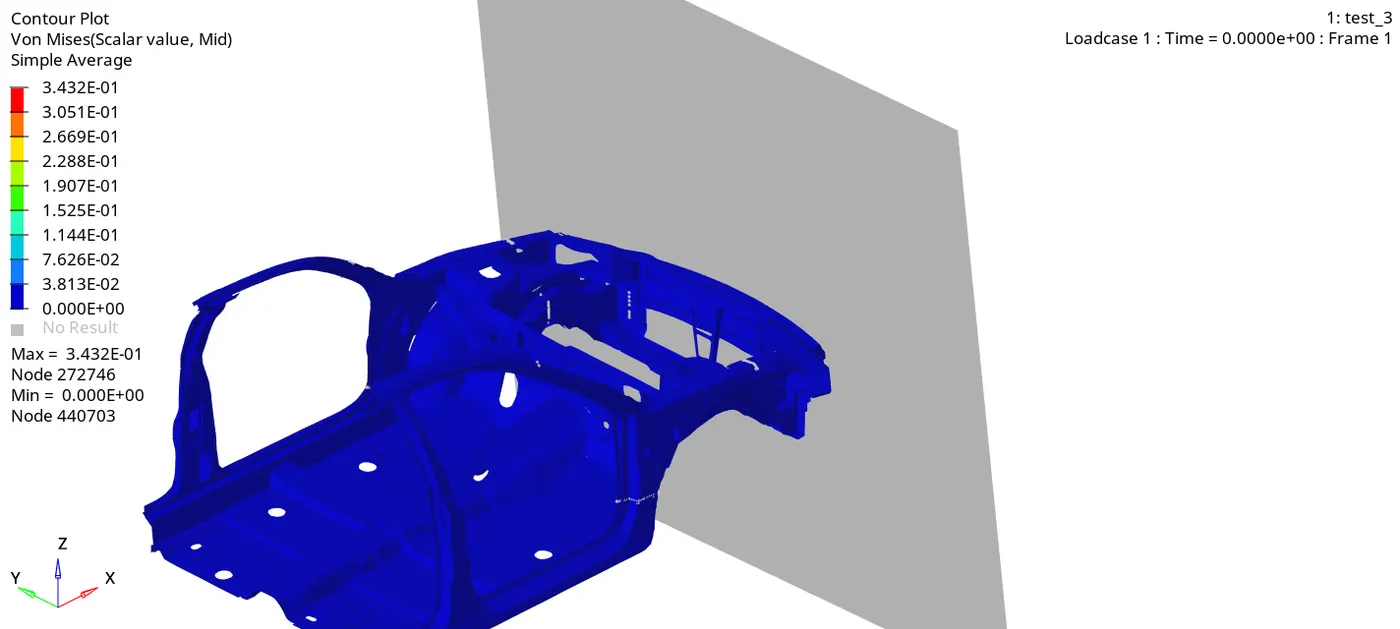
As can be seen above, the impact was absorbed by various components of the car which means that the design appears to be good in preliminary observations. Crucial cross-sections need to be double-checked and compared to the experimental results to ensure thorough accuracy.
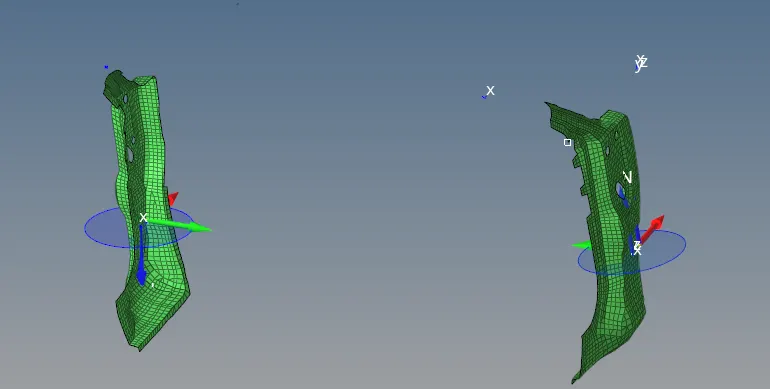
HINGE PILLAR
The cross-sections were created on the hinge pillars and the results were plotted using a graph for normal and tangential forces acting upon the cross-section.
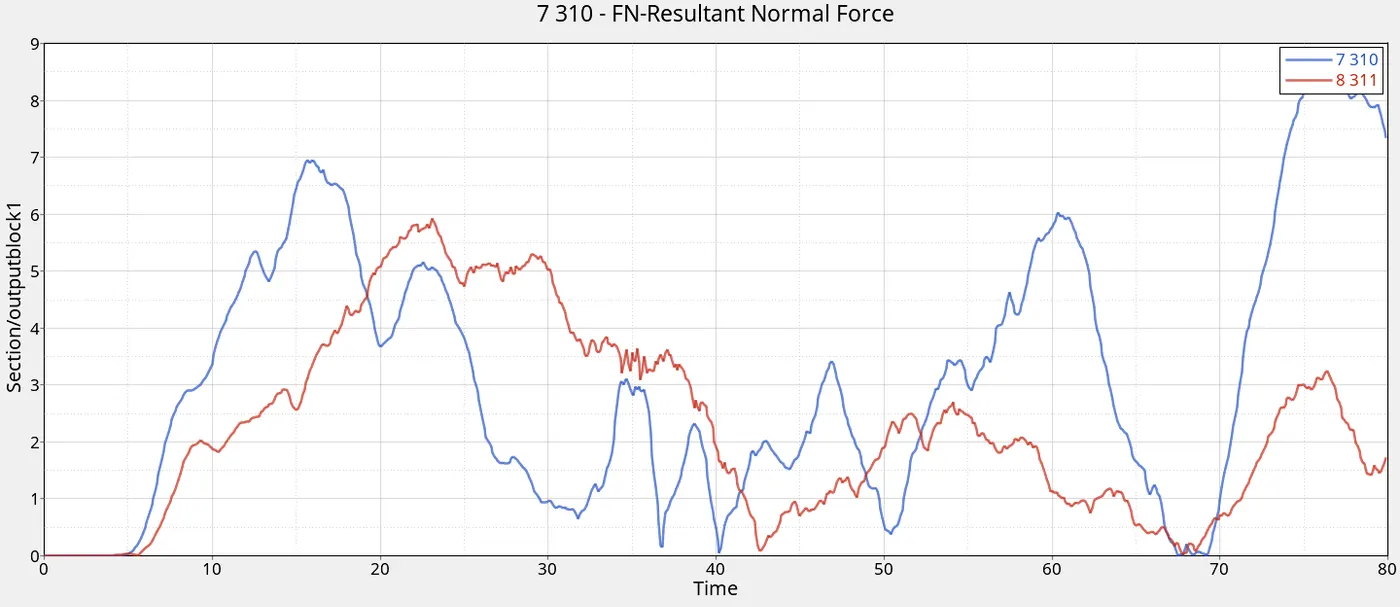
The blue curve indicates left pillar and red indicates the right pillar. The above graph is for normal forces acting. The left pillar has a maximum force of 8.766 KN and right pillar has 5.917 KN acting upon it.
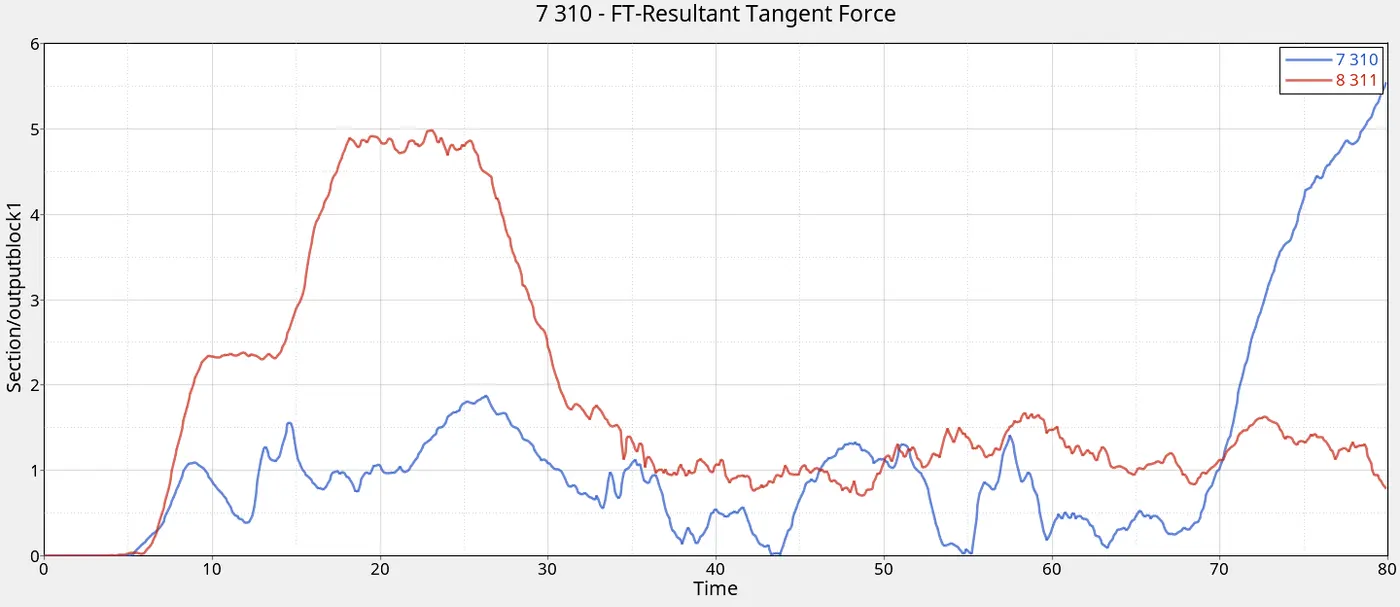
The above graph indicates tangential forces acting on the pillars. The left pillar has maximum force of 5.546 KN and right pillar has maximum force of 4.974 KN.
When such observations are made, this indicates to the design engineer that when considering various factors for designing this particular component, the priority should be given towards tackling the normal forces acting upon the pillars since they are higher in magnitude. Similar observations can be made for the rest of the cross-sections as well where top priority is given to areas with higher magnitude.
A-PILLAR
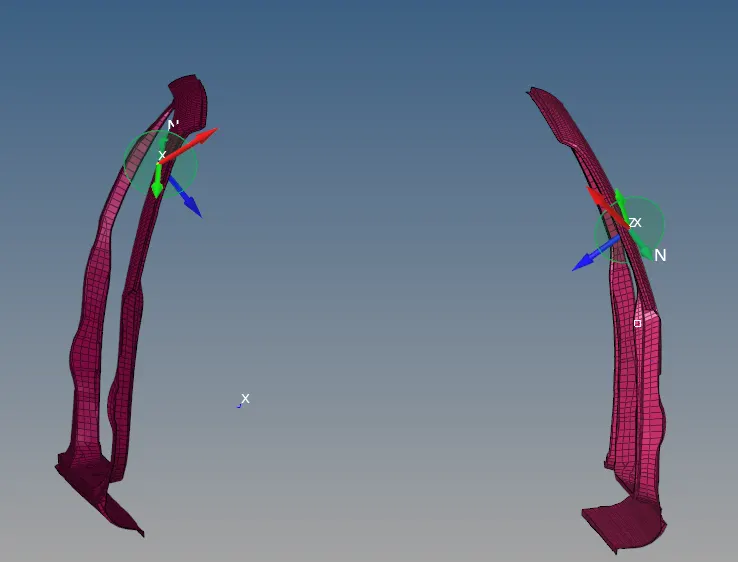
Cross-sections were provided to the A-pillar as indicated in the below figure.
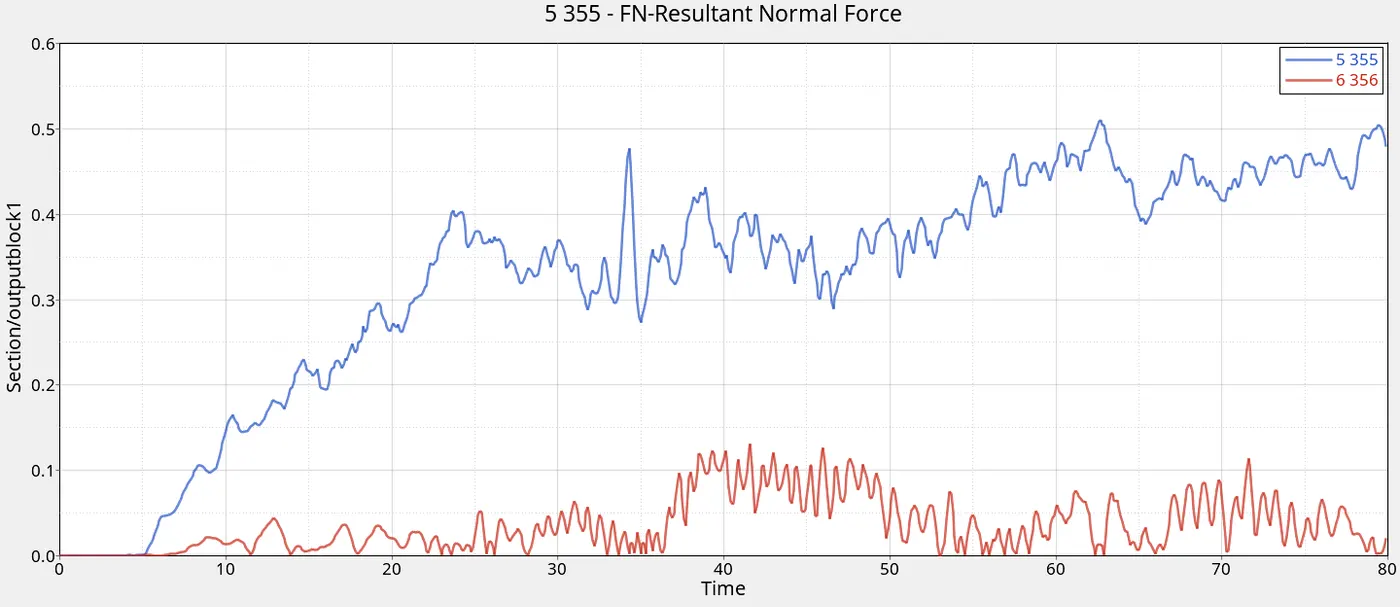
Blue curve is for left pillar and red is for right pillar. Although the graph appears to indicate that thee left pillar has much higher magnitude relative to the right pillar in terms of normal forces, in the bigger picture, the magnitudes are quite small. Left pillar has maximum normal force of 0.510 KN whereas right pillar has maximum of 0.130 KN. Hence, the normal forces are not significant.
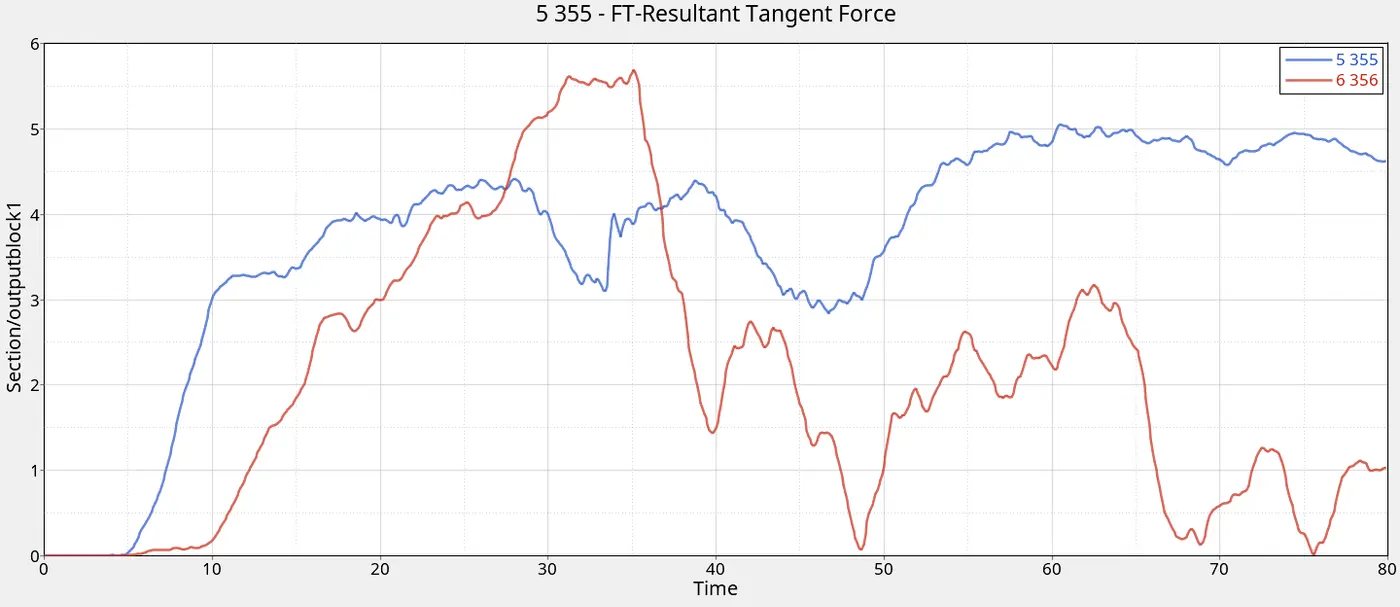
However, the tangential forces are important in this case with left pillar having maximum of 5.049 KN and right pillar with maximum of 5.68 KN.
Hence, design engineer needs to consider the tangential forces as priority while designing A-pillar.
SHOTGUN
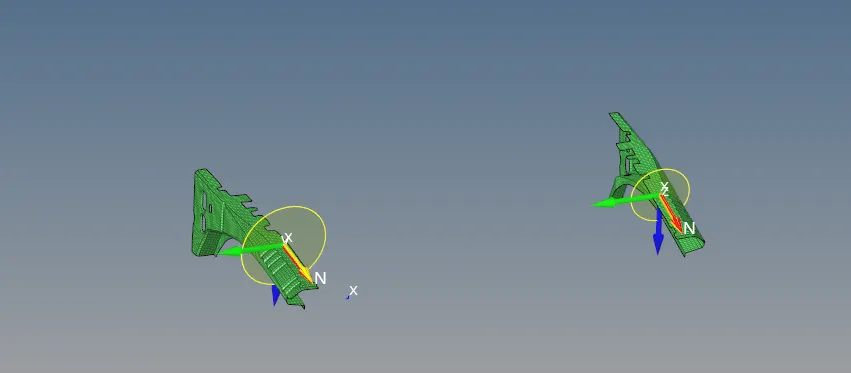
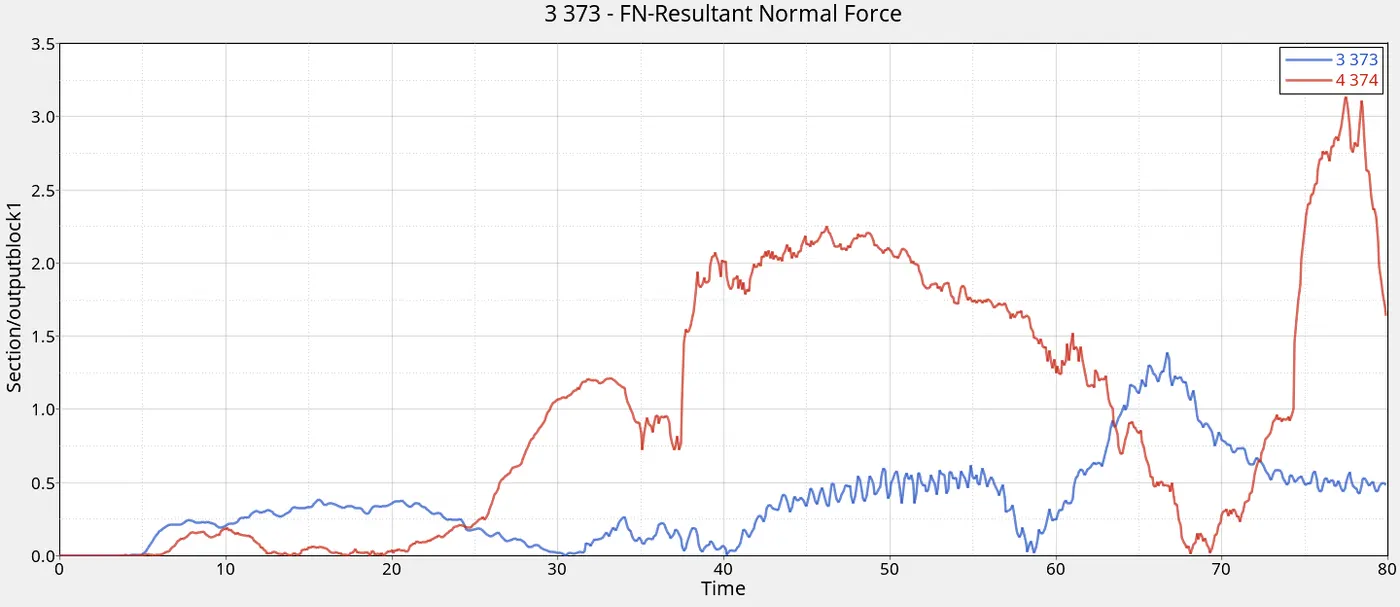
The left shotgun has maximum normal force of 1.38 KN whereas the right shotgun has 3.17 KN.
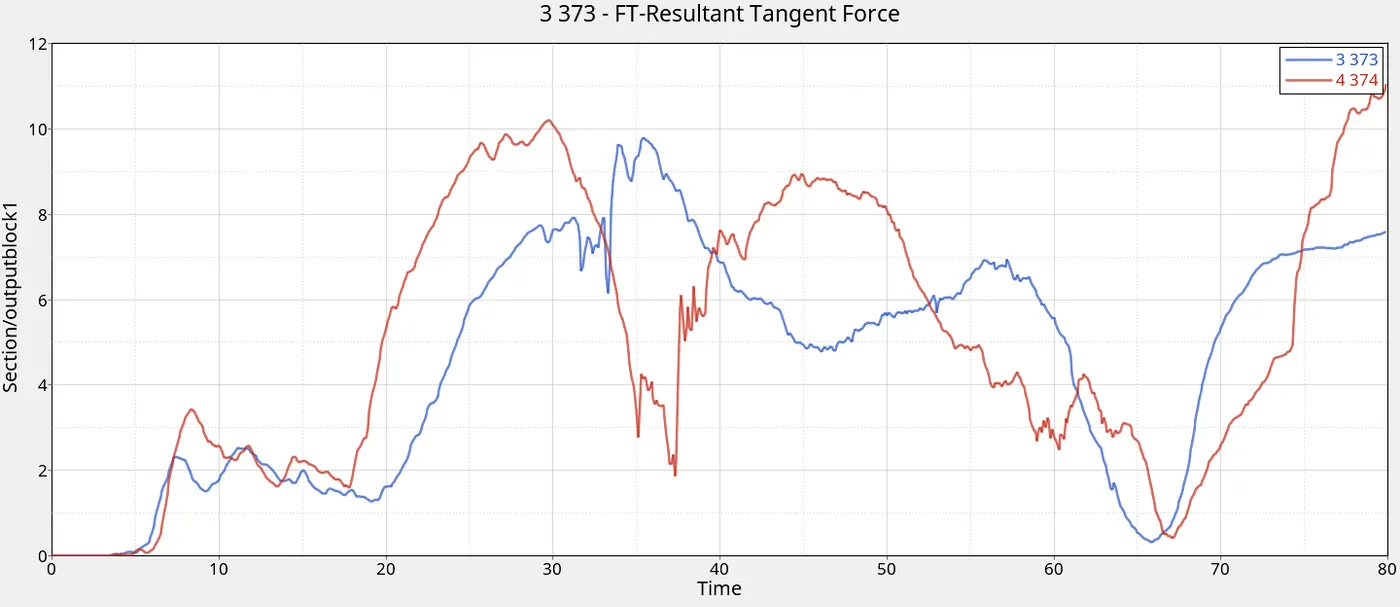
Left shotgun has a maximum tangential force of 9.798 KN and right shotgun 11.038 KN.
Hence, when designing shotgun, more consideration has to be given to tangential forces.
HEADLIGHT BUMPER
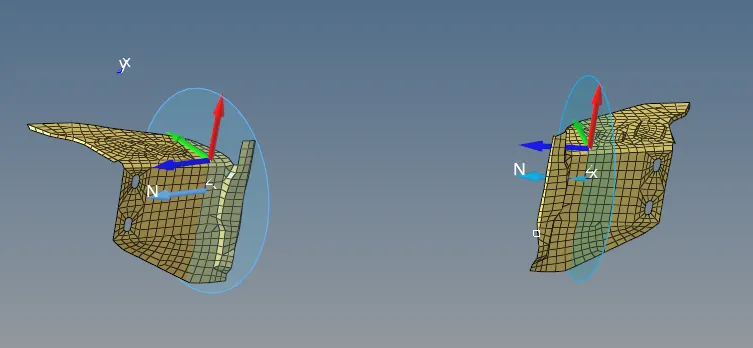
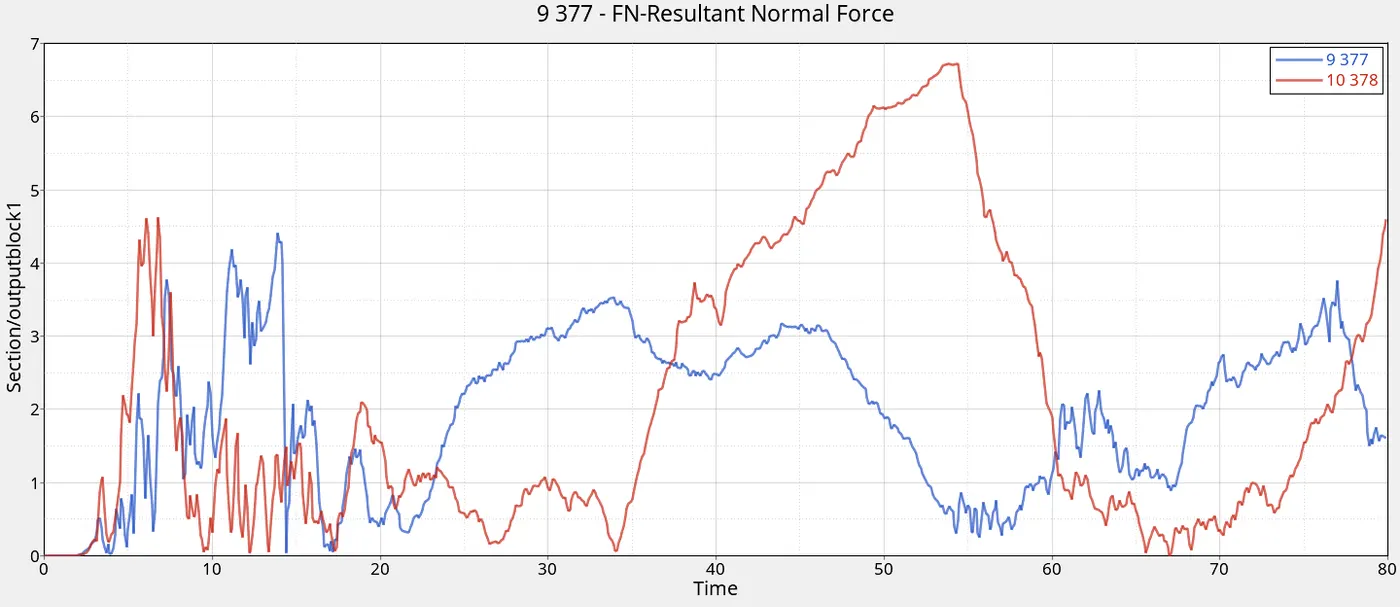
The left headlight bracket has maximum normal force of 4.415 KN and right headlight bracket has 6.726 KN.
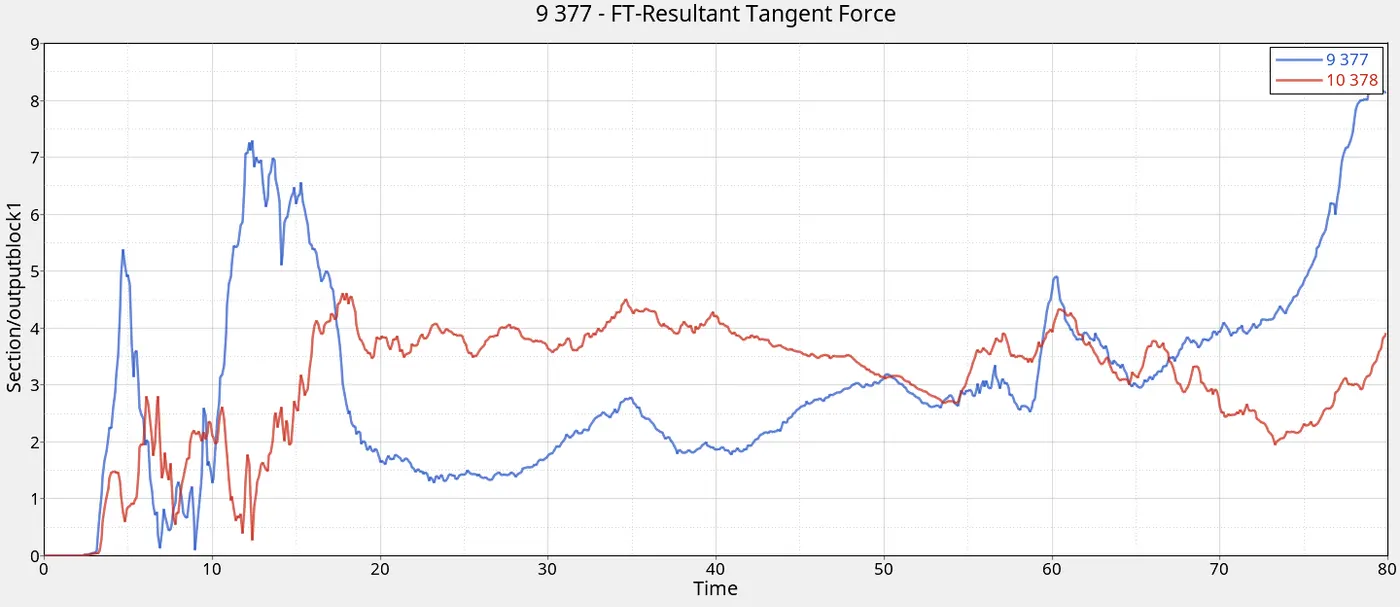
The left headlight bracket has maximum tangential force of 8.369 KN and right headlight bracket has 4.609 KN.
In this case, both normal and tangential forces are significant and need to both be taken into proper consideration during design phase.
BUMPER RAIL
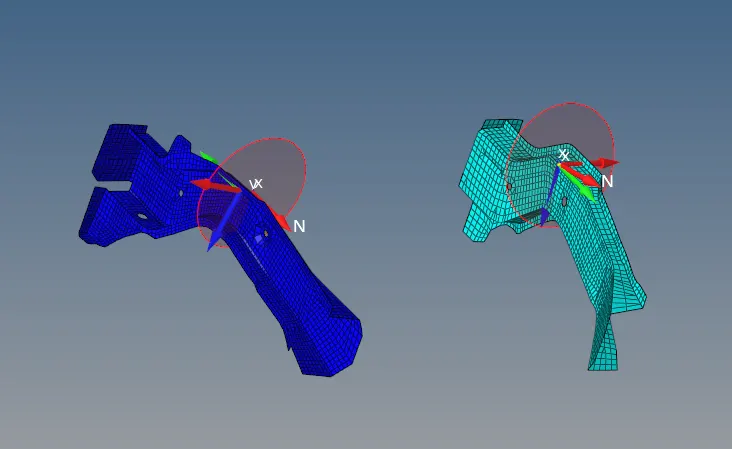
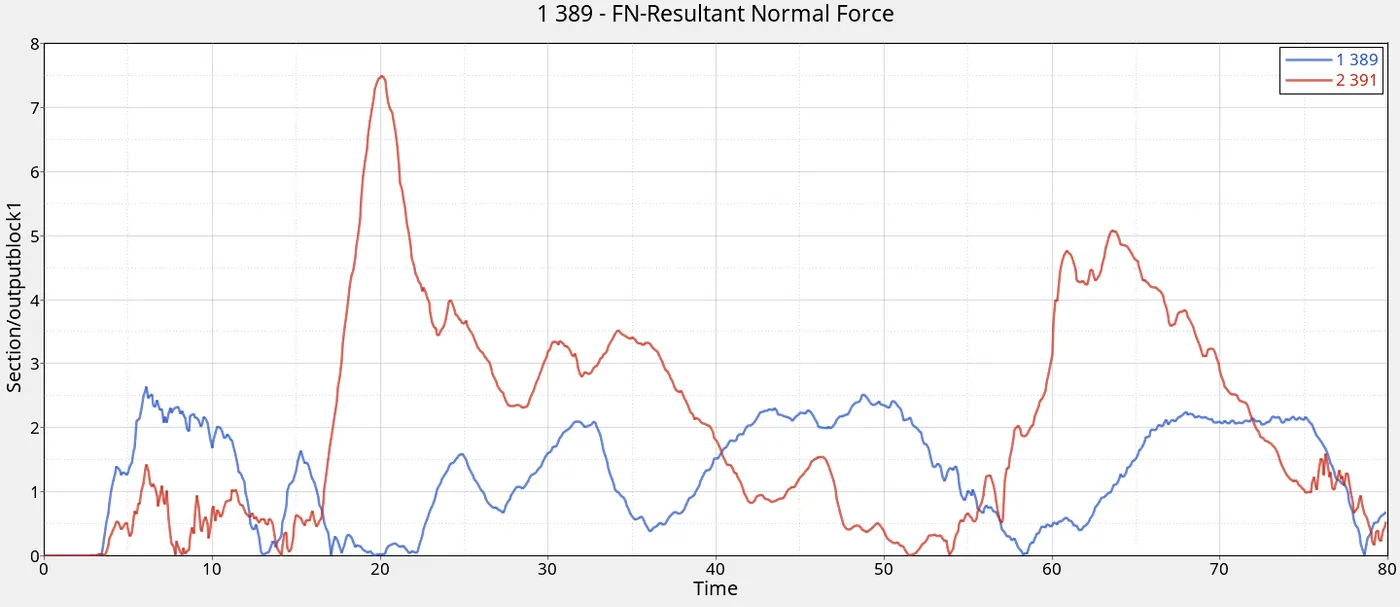
The left bumper rail has maximum normal force of 2.507 KN and right bumper rail has 7.463 KN.
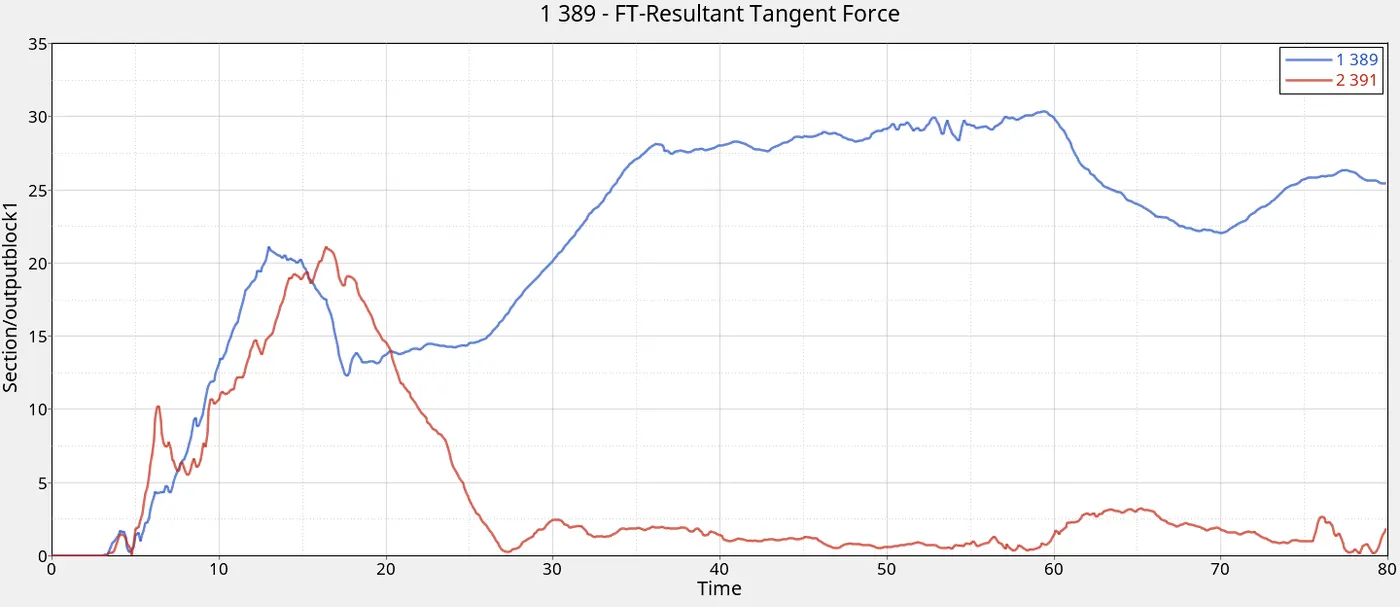
The left bumper rail has maximum tangential force of 30.347 KN and right bumper rail has 21.132 KN.
Hence, the tangential forces are crucial and need to be the top priority while designing bumper rails.
MASS
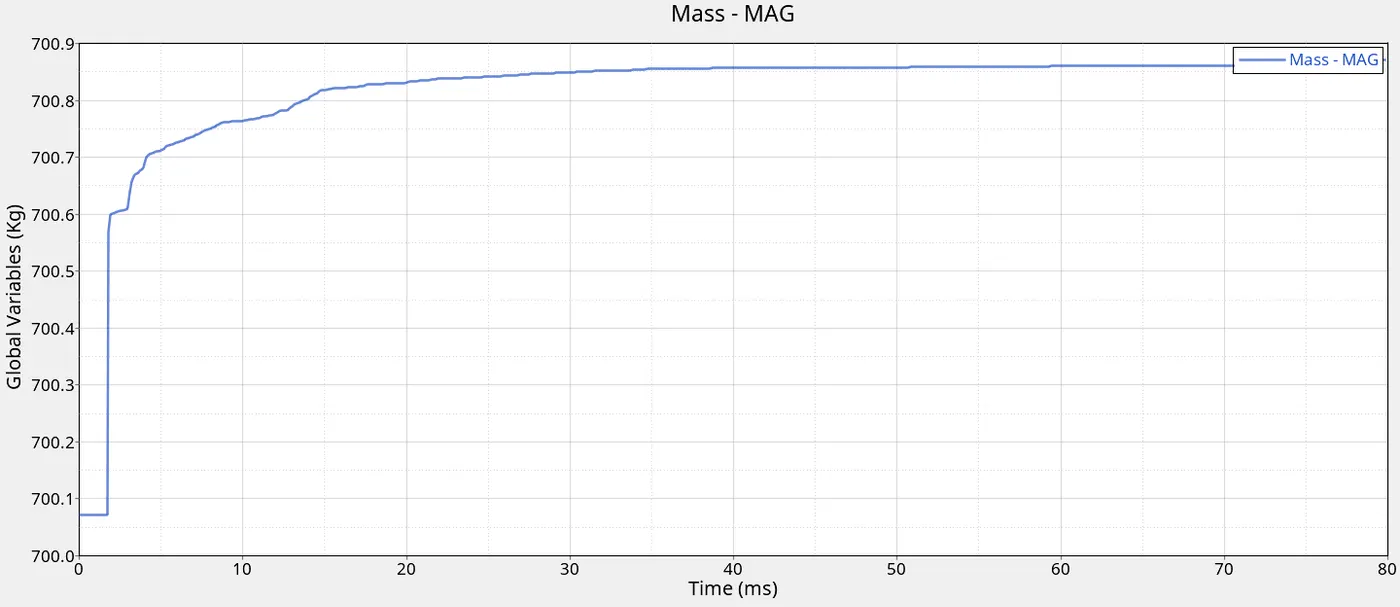
From the graph, it can be seen that the mass addition takes place at the initial point of contact with the rigid wall. This is likely due to deformation of the elements resulting in time step going below the given value. In order to counter-measure this reduction in time step, the mass of the elements has to be raised to bring it back to the minimum time step value. If this mass addition is significant in the region of 1-2% then it needs to be corrected. In the present case, the mass of about 0.85 kg was added which is not severe enough to impact the results and hence is considered safe.
ENERGIES
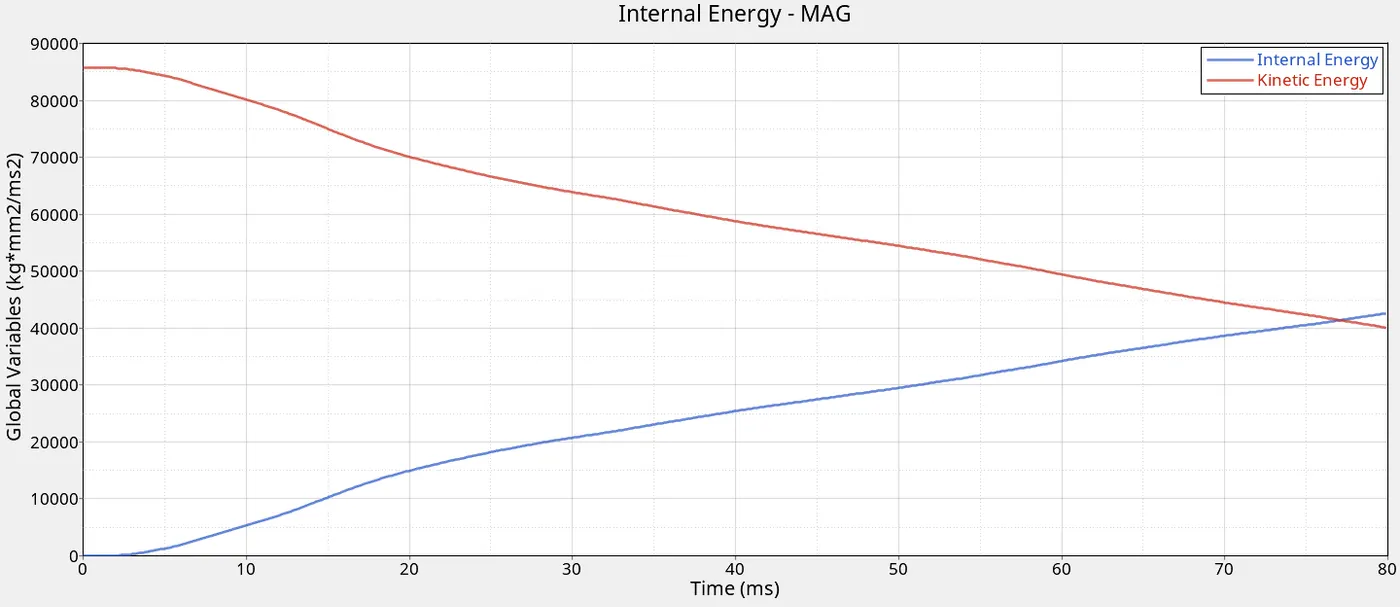
The curves for internal and kinetic energies are quite similar to what one could expect from crash simulations. The kinetic energy pre-cimpact is at the highest and once it comes into contact with the rigid wall, the velocity reduces considerably, which in turn reduces the kinetic energy. Part of this energy can be lost due to thermal dissipation, absorbed by the wall, and absorbed by the material in the form of internal energy. As the graph shows, internal energy rises from minimum pre-crash and keeps on increasing as time increases.
ACCELERATION
Accelerometers were added onto the bottom of the B-pillars on either sides of the car. One of them is indicated in the below figure:
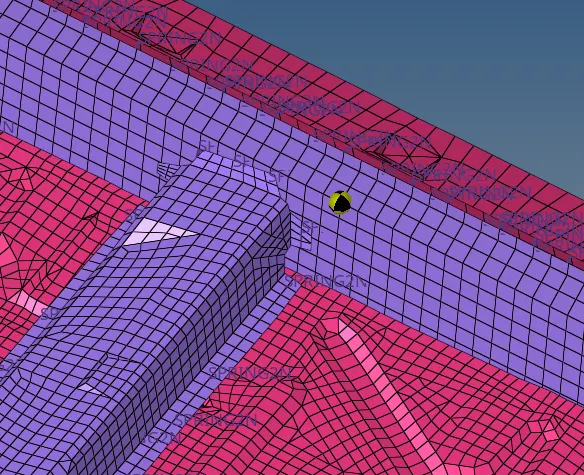
Accelerations about the x-direction were plotted. Obviously, during a crash, the velocity reduces, and hence the acceleration is in a negative direction which is also called retardation.
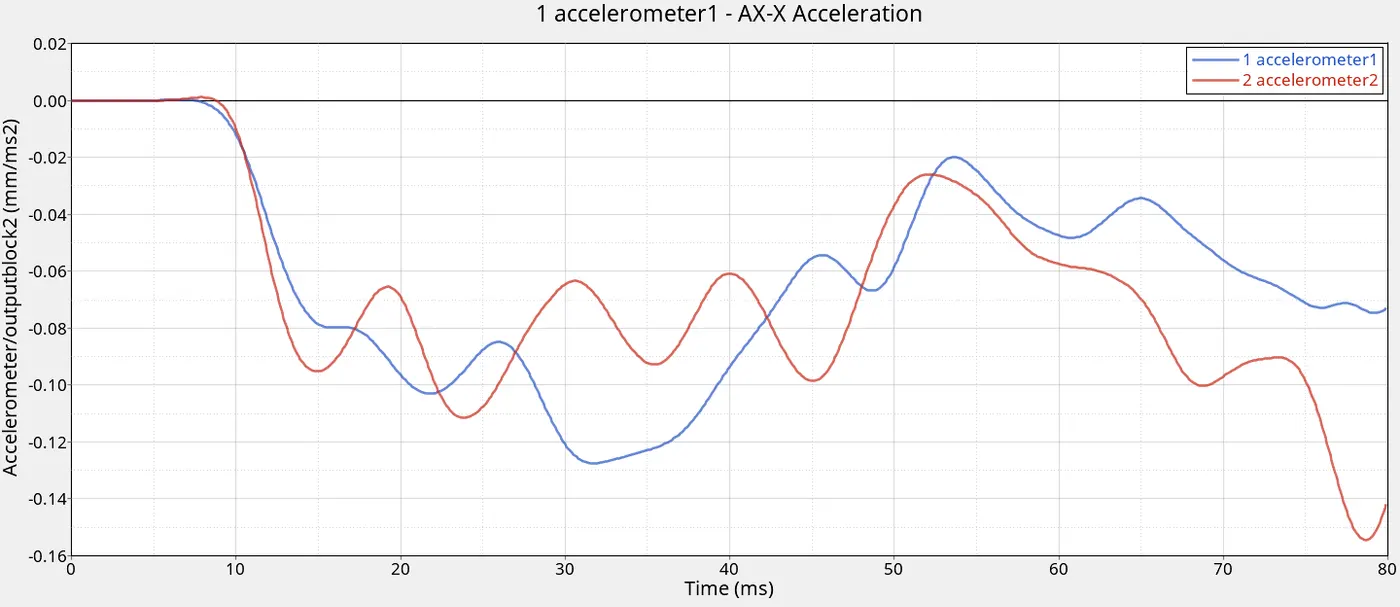
The left pillar base has maximum retardation of 0.127 E-3 m/s^2 whereas right pillar base has maximum retardation of 0.154 E-3 m/s^2. This slight variation indicates slight differences between the forces experienced by the left and right ends of the car.
INTRUSIONS
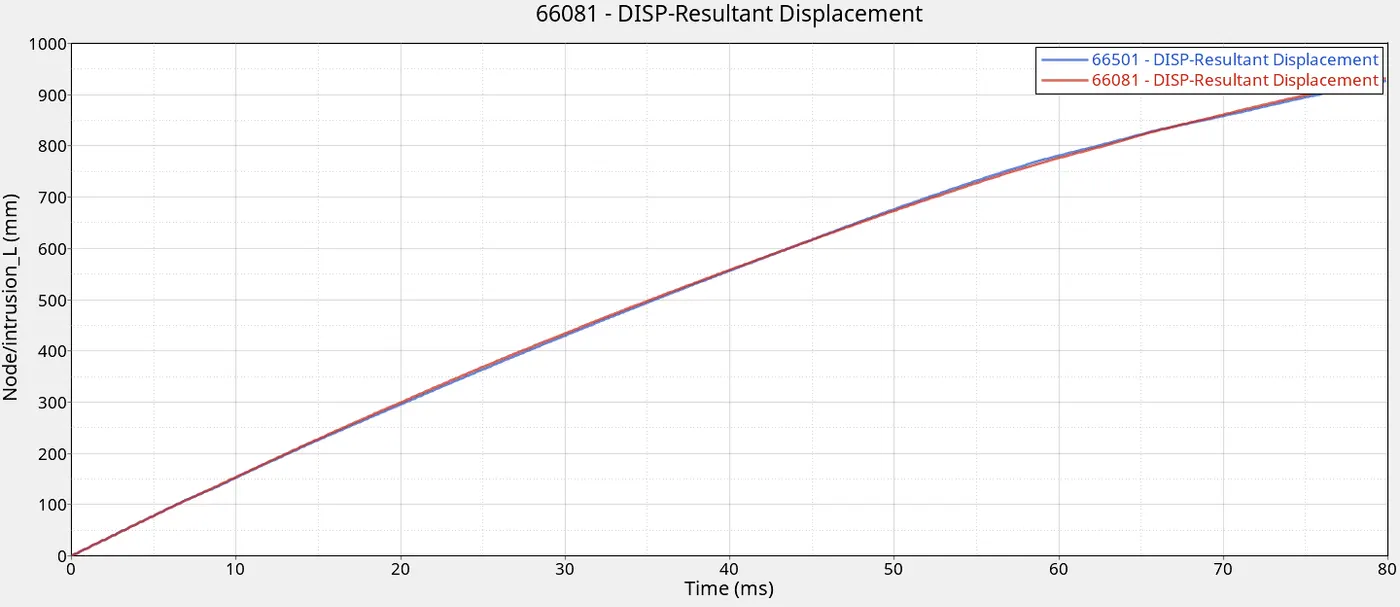
Intrusion curves for resultant displacement indicate a very similar curve pattern for the two nodes where the foot of the driver would be placed. This indicates that the forces and displacements experienced by the drivers two feet would be identical.
Important results which were discussed in detail in the above sections are summarized in the below tables:
|
Parameter |
Values |
|
Maximum Plastic Strain |
0.5298 |
|
Maximum von-mises stress |
0.3432 MPa |
|
Maximum Energy Error |
-1.5% |
|
Maximum Internal Energy |
0.4262 E+05 J |
|
Initial Kinetic Energy |
0.8569 E+05 J |
|
Final Kinetic Energy |
0.4002 E+05 J |
|
Run Time |
8324.19 s |
|
Maximum retardation |
0.154 m/s^2 |
|
Component |
Normal Force (KN) |
Tangential Force (KN) |
|
Hinge Pillar |
8.766 |
5.546 |
|
5.917 |
4.974 |
|
|
A-Pillar |
0.510 |
5.049 |
|
0.130 |
5.68 |
|
|
Shotgun |
1.38 |
9.798 |
|
3.137 |
11.038 |
|
|
Headlight Bracket |
4.415 |
8.386 |
|
6.726 |
4.609 |
|
|
Bumper Rail |
2.507 |
30.347 |
|
7.463 |
21.132 |
Potential points of improvement:
The crash test can be improved further using various methods such as :
1. Using full integration point element formulations such as HA8 for solids and QBAT for shell elements
2. Increasing integration points along the thickness
3. Providing a more robust contact interface that can handle all possible interactions
4. Finer mesh especially in crucial regions
5. Simulate the entire model with important parts such as engine being present
All these steps can be implemented to improve the accuracy of the simulation. However, increasing accuracy will come at the cost of increasing time of computation by a large magnitude. Thus, a good balance has to be ensured between computational cost and accuracy. The costlier and more important parts/models need to have accuracy as a top priority.
These results need to be compared to the experimental results and adjustments need to be made to the FE simulation wherever necessary.
CONCLUSION: The car crash was simulated onto a rigid wall and the various forces, accelerations and displacements were plotted, tabulated and discussed. Points were also made to potentially improve the quality of the simulation in future.