Frontal Crash Analysis of BIW model of a generic car
Aim: To carry out frontal crash simulation & study the analysis results of the BIW model of a generic car
Objective:
- Create necessary contact interfaces with recommended parameters
- Remove penetrations & intersection if any
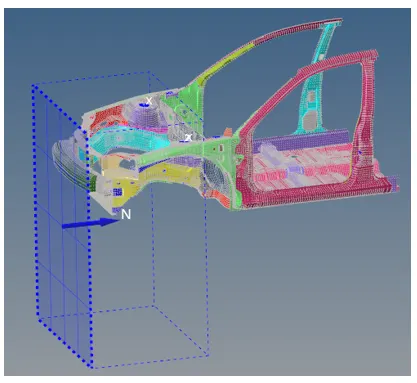
- Rigid wall creation
- Applying Kinematic conditions
- Check model for good quality
- Request cross sectional forces at different critical rail components
- Acceleration curve received on the accelerometer at base of Pillar B(on B pillar rocker)
Abstract
A crash test is a form of destructive testing performed in order to ensure safe design standards in crashworthiness. This project covers the various critical result discussion obtained from the simulation of frontal crash of vehicles. The model used in this project is a surrogated model to keep the number of nodes and elements within the limits of the student version of HyperWorks. Creation of interfaces and kinematic conditions has been done strictly based on recommended parameters for crash applications.
Workflow
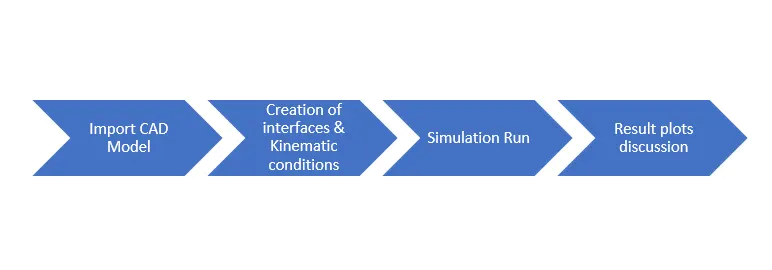
Case Set-up & Execution
Unit check
(Can be seen in 0000.rad file)
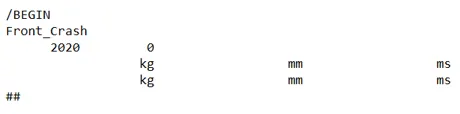
The unit system thus followed from hereon is Kg,mm,ms
Model Provided
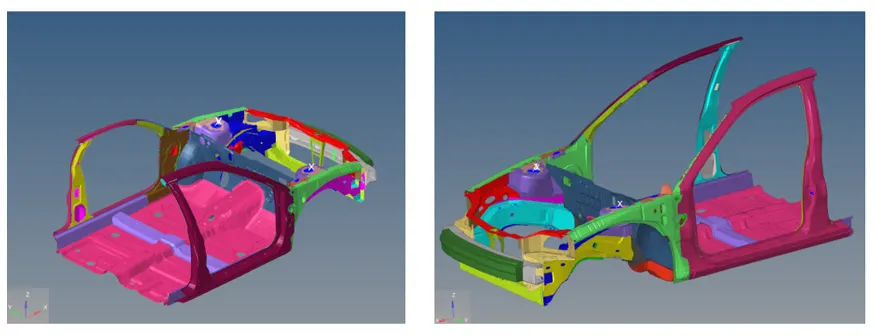
Note: The unit system followed in Hypermesh is [Kg, mm, ms]
Contact Interface Card
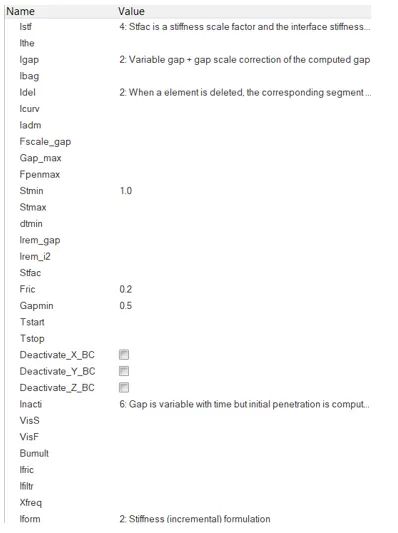
The already present contact interface cards are deleted, a new contact interface card has been defined. We have selected Type 7 Contact in which the whole BIW model acts as both- slave and master.
The Recommended Type 7 parameters for crash applications are as follows:
- Istf= 4: Set stiffness of interface based on the softer of the master & slave.
- Igap= 2: Set variable gap to consider the true distance between parts.
- Idel= 2: Remove slave nodes from contact because of element deletion
- Stmin= 1kN/mm: Specify minimum stiffness in the contact to avoid too soft contact.
- Fric= 0.2
- Gapmin= 0.5: Specify minimum thickness of the model to avoid numerical issue. Typically half of the thinnest part.
- Inacti= 6: Remove initial penetrations where possible. Elsewhere, reduce to less than 30% of the defined gap value and adjust the gap with Inacti.
- Iform= 2: Sliding forces are computed using stiffness parameters of interface. Usually results in bigger time-step.
Intersection & penetrations check
(This check is performed in HyperCrash)
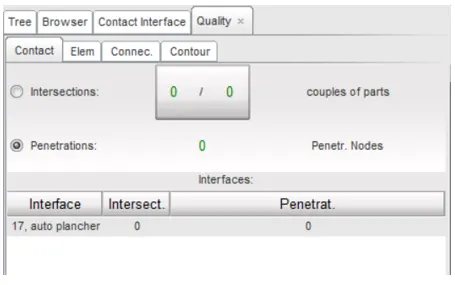
It can be seen from the Quality Browser Tab above that the penetrations & intersections in the provided BIW model is ZERO.
Rigid Wall creation
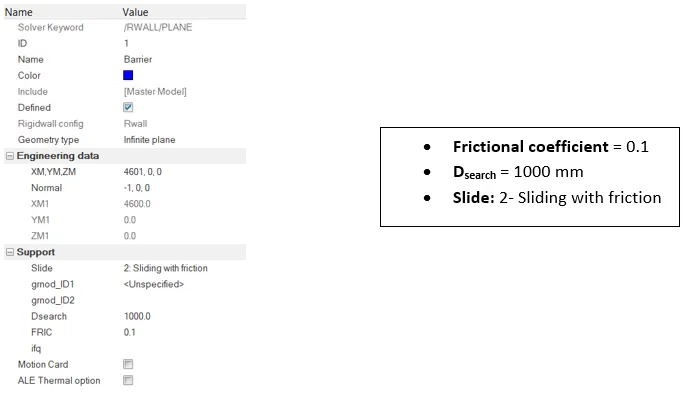
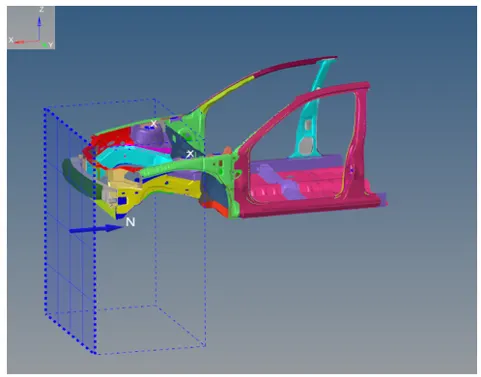
The rigid wall is created in the model browser in Hypermesh having a friction coefficient of 0.1 and Dsearch= 1000mm.
Dsearch is the minimum distance the rigid wall takes to establish the contact i.e. read when the slave component has entered it's domain.
The engineering data definition has been taken from the 300K full version of the BIW neon dodge model.
ENG_RUN Card
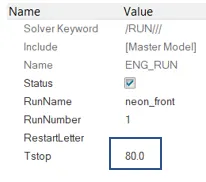
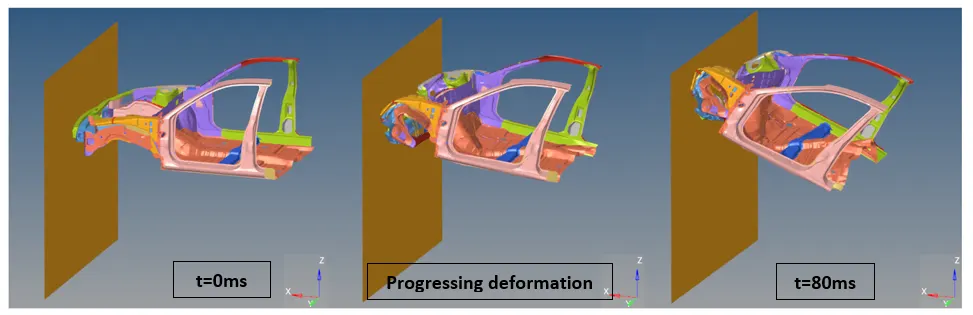
The simulation time we require is 80ms, which can be entered in the ENG_RUN card, under Cards in hypermesh
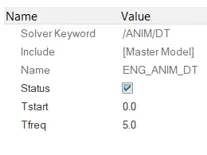
ENG_ANIM_DT Card
Tfreq= 5.0, which implies we’ve taken up 16 animation steps(=80/5.0). Tfreq has been taken to be a higher number so that the RADIOSS block for the simulation completes it’s job in less time as compared to the long time it will take if animation steps were requested at each and every second where Tfreq=1.
Initial Velocity Set-up
(Solver Browser>> Create>> Boundary Conditions>> INIVEL)
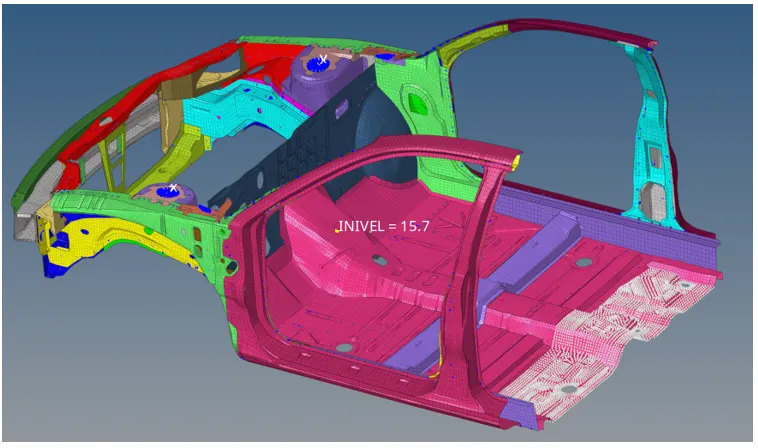
The initial velocity to be specified= 35 mph= 15.6464 mm/ms. The velocity towards the wall of the car is positive. Thus under velocity components, Vx= 15.6464 mm/ms.
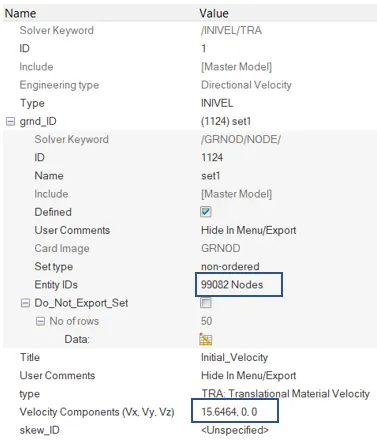
A new grnd_ID has been created and under nodal entities all the nodes of the BIW model has been selected, the selection is marked by the color white as follows:
Model Mass, Cog aspects
(Tools>>Mass details>> Mass, Cog, Inertia)
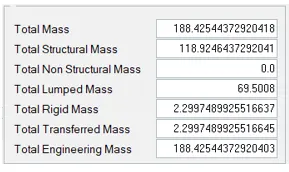
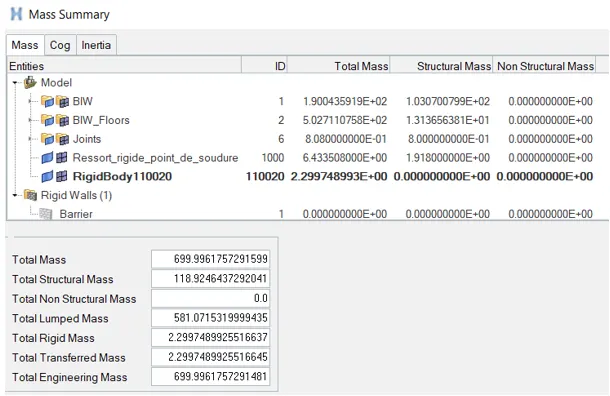
Total mass of model= 188.425 Kg(Initially)[Weight of surrogated model]
Mass to be added= 511.575Kg
Target Weight to be achieved= 700Kg
The Cog is to be modified by adding mass to the back portion of the car model to place it in the correct space on the line between the driver and co-driver seat. The mass is applied specifically to the bottom depression so that the new Cog obtained is accurate.
The mass is added using the model browser, create>>Solver mass. The selected node are as follows.
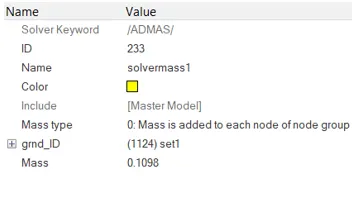
Note: Type 0 mass addition is used in which mass is added equally to each node.
No. of nodal entities selected are: 4656. Each node has been given a mass of 0.1098Kg(=511.575/4656), as can be seen from the mass addition card below too:
It can be seen from the mass summary below that the mass of the model has reached the approximate value of 700Kg(699.996Kg)
The new Cog coordinates are as follows:
X=2391.73mm
Y=18.94mm
Z=283.58mm
The new Cog is found out to be on the line between the driver and co-driver seat which should be the ideal position for it.
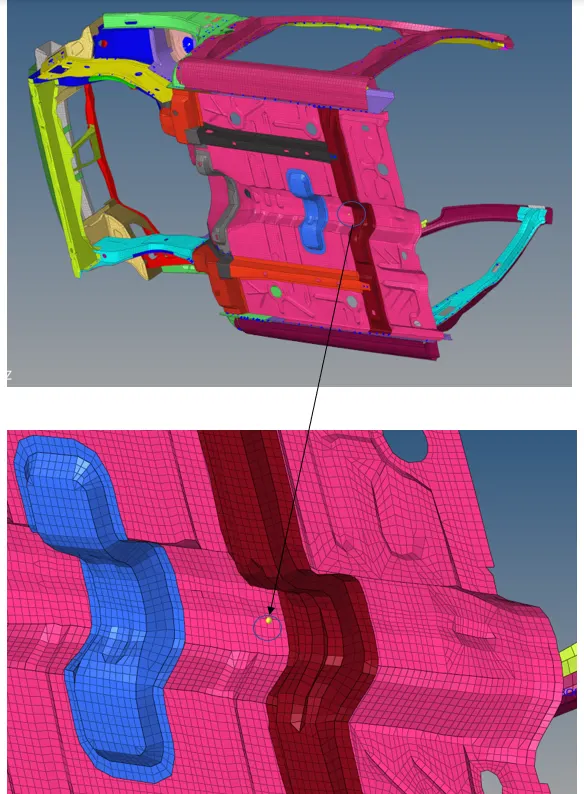
Creation of Cross-sections
(Solver>>SECT>>SECT)
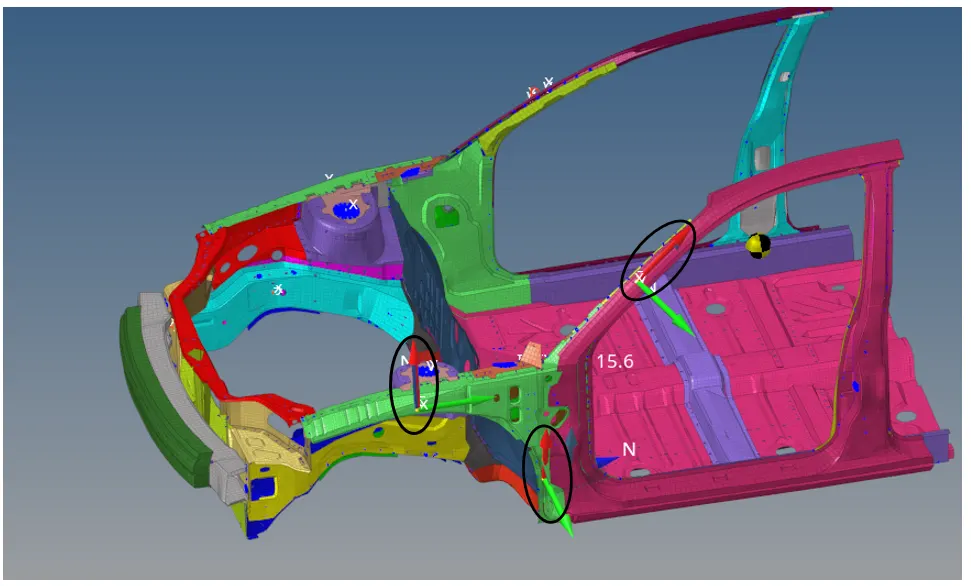
5 cross-sections on each side pf the vehicle has been taken to study the forces along them. In total we have 10 cross-sections out of which one has been marked below and the final model with all the cross-sections is followed.
Shot-gun cross section
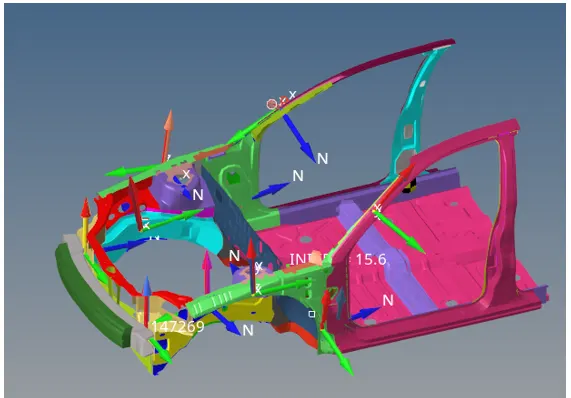
Similarly, all the 10 cross sections were created as shown by the following graphic, namely:
- Section on rails
- Section on rails for force received on rails from the bumper
- Shot-gun cross-sections on both sides of the model
- ‘A’ pillar cross-section on both sides of the model
Model Check
(Tools>>Model Checker>> RADIOSS Block)
This was done in Hypermesh itself, to check for the model errors.
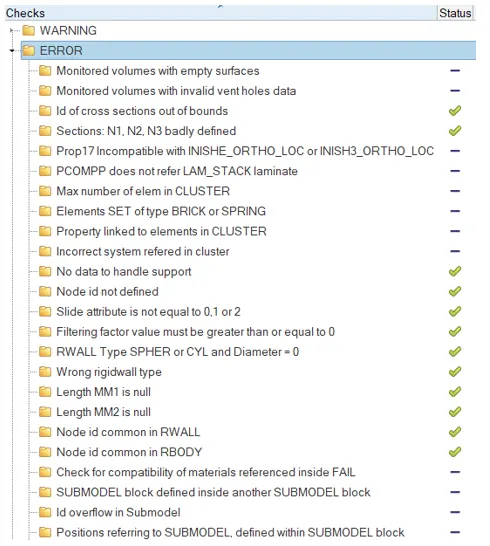
No errors were found during the Model checker run. This is a green signal to proceed for the simulation.
Simulation
Energy and mass error checks

Energy error= -1.3% which is within acceptable limits of -15% to 15%.
The closer to zero, the better. Negative energy error implies that the energy has been dissipated, which could be due to elements collapsing on each other and thus emitting what is known as contact energy.
Mass error%= 0.02999x100= 2.999% which is between 1% to 3%, the acceptable limits. This error is due to the mass addition at nodes to prevent time-step from failing. This error can be kept under check by providing a provision for less mass to be added at the nodes for time-step correction.
Elapsed Time= 2494.60 s
Simulation Time= 79.90ms
Total number of cycles= 80001
Simulation Graphics
Result contours
Displacement contour
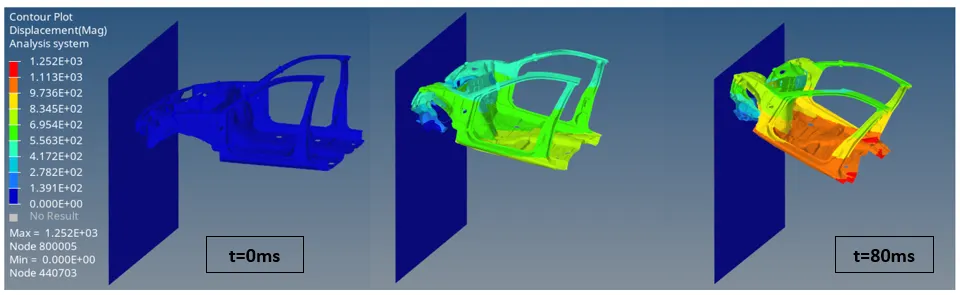
Max displacement= 1.25 E+3 mm
Min displacement= 0.00
Von-Mises contour
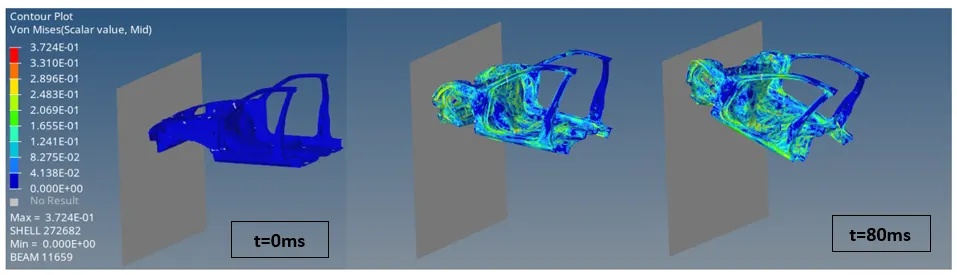
Max von-mises stress= 0.3724 N/mm2
Mass contour
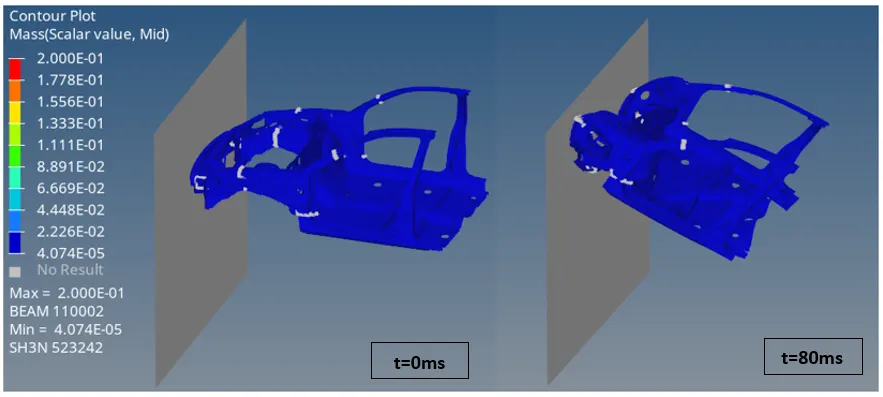
Max mass= 0.2 Kg(added)
Energy plots
Internal, Kinetic energy
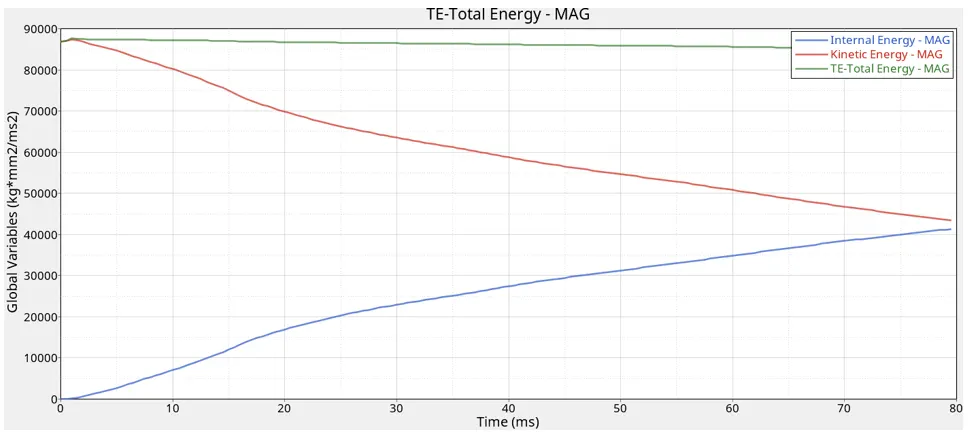
The internal energy increases as the element material absorbs the shock wave intensity and reaches a maximum value of approximately 40,000 Kg*mm2/ms2. The kinetic energy initially is the highest and as the crash progresses and the car comes to rest kinetic energy decreases over time.
The total energy is around 85,000 Kg*mm2/ms2.
Hourglass, contact energy
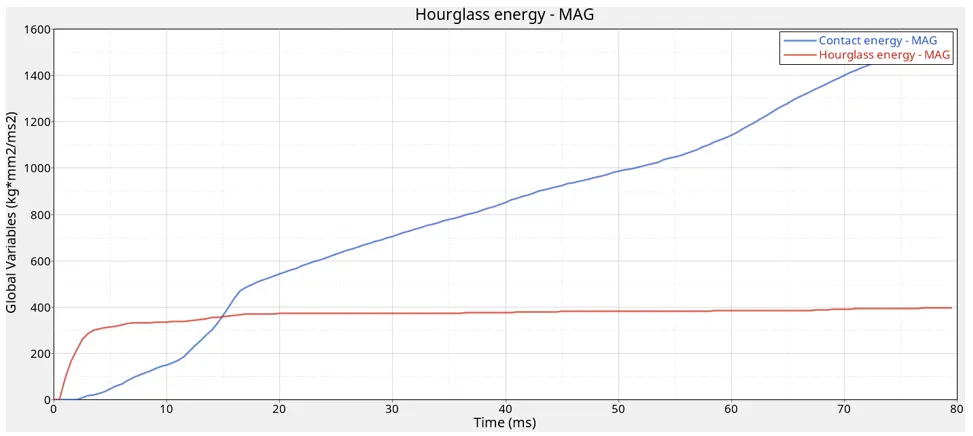
It is recommended that {(Contact energy + Hourglass energy)/(Total energy)}x 100 < 15%...........expression(1)
The max. contact energy= 1600 Kg*mm2/ms2
And max. Hourglass energy= 400 Kg*mm2/ms2
Total energy from previous plot= 85,000 Kg*mm2/ms2
Therefore expression (1) evaluates to= 2.35% <15%, which means that energy balance is under check.
Mass
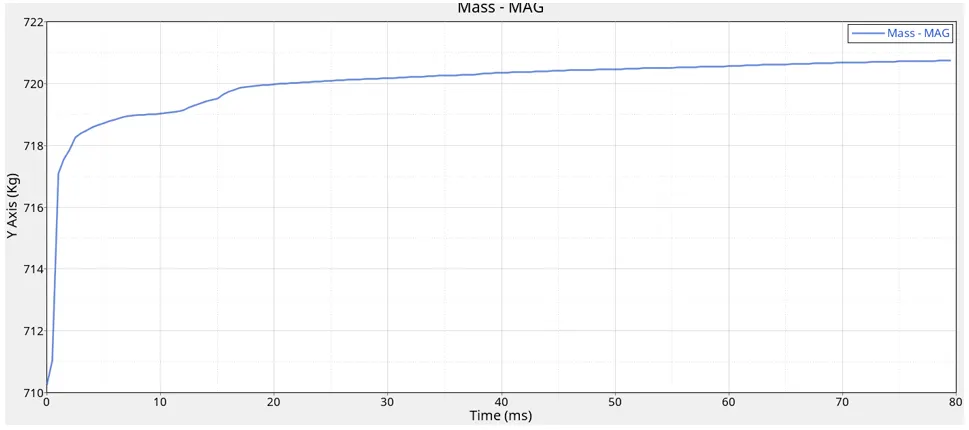
Model mass increases over time from 700Kg at t=0 to around 720Kg at t=80ms. This is because the solver has put some mass on the nodes to avoid time-step failure.
Cross-sectional forces
Left and Right Rail component Cross-sectional forces
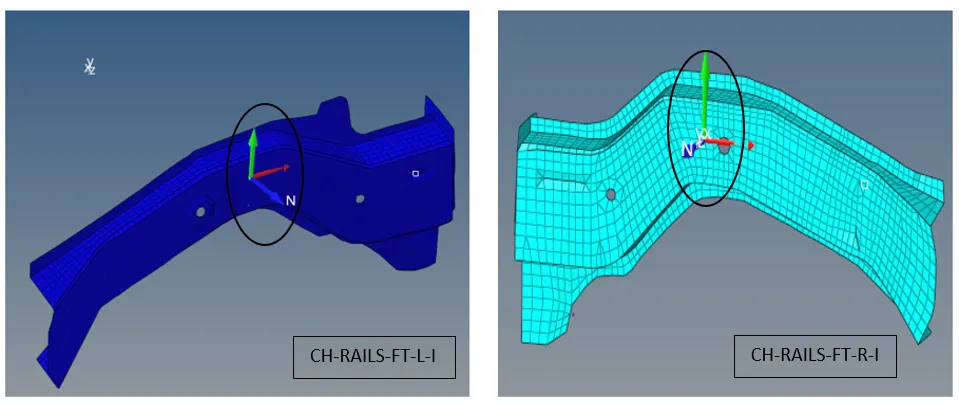
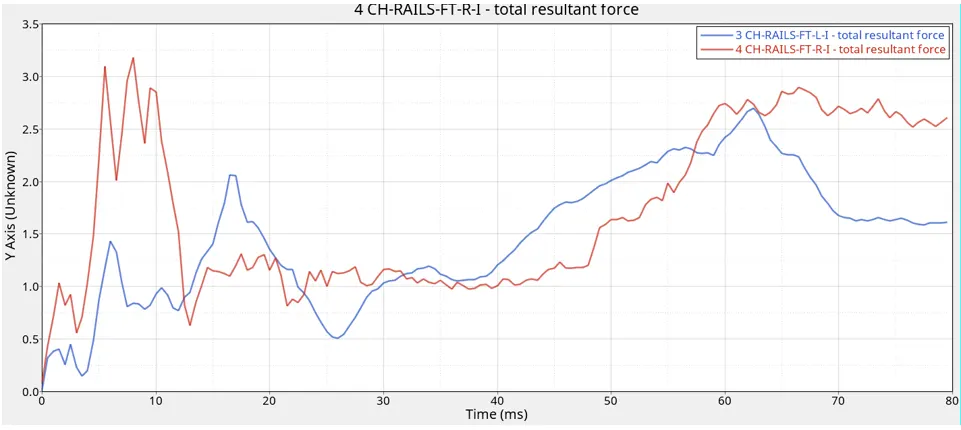
Max Force Left Rail= 2.75 kN (approximately) around the 63rd ms.
Max Force Right Rail= 3.25 kN(approximately) around the 8th ms.
Headlight Bracket Cross-sectional forces
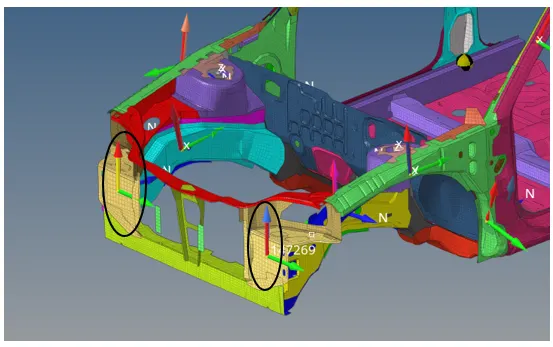
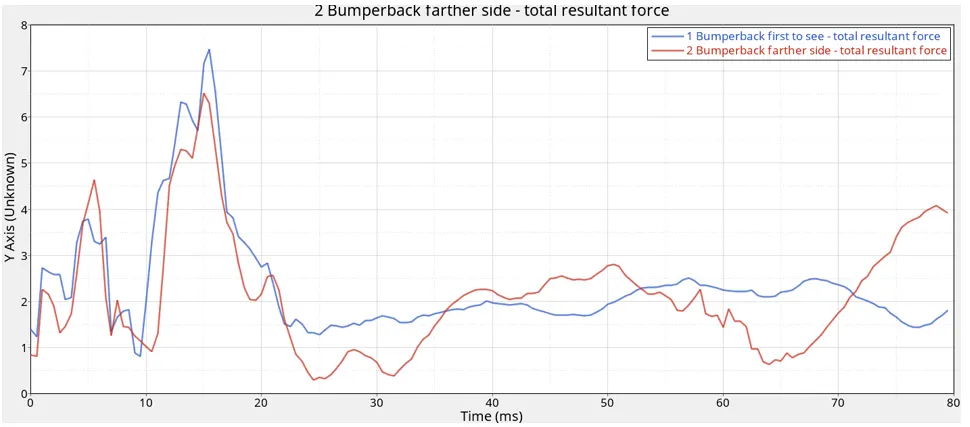
Max force on headlight bracket cross-section(left)= 7.5 kN around the 16th ms.
Max force on headlight bracket cross-section(right)= 6.5 kN around the 16th ms.
The headlight bracket is situated in the very front of the vehicle after the bumper portion, so it receives the maximum deformation, then the force through it transmits(having a lower value as most of the force is aimed to be absorbed by the bumper material) to other components. The material of the bumper is aimed to be kept at a lower stiffness so that most of the initial kinetic energy of the crash gets converted to material’s internal energy and less force is transmitted ultimately to the occupant.
Fender Cross-sectional forces
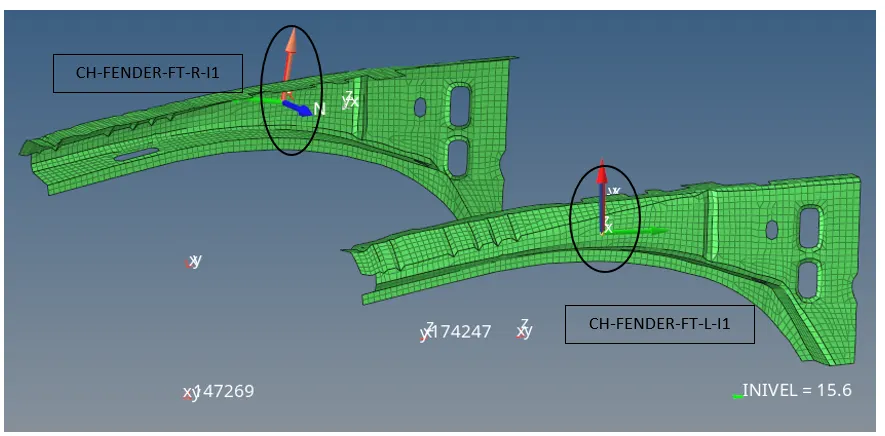
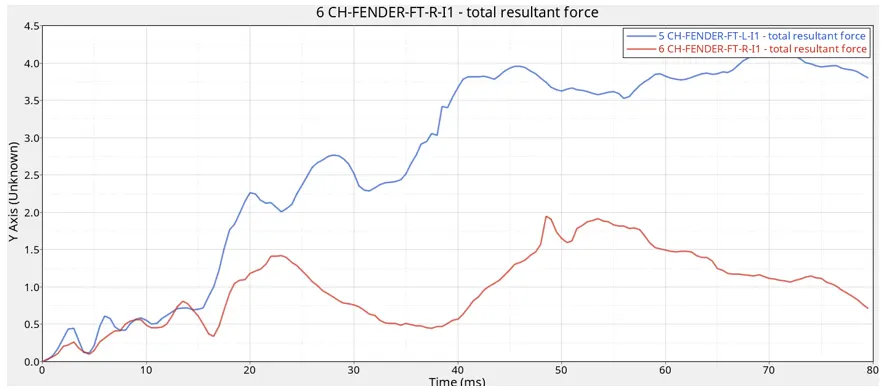
Max force on the fender(left side)= 4.25kN around 70th ms.
Max force on the fender(right side)= 1.75kN (approximately) around 48th ms.
- The left side fender experiences more forces as is evident from the above plot. A slight decrease in force magnitude can be seen after the 70th ms in the left fender.
- The right side fender experiences less forces than the left side fender, reaches a maximum value of 75 kN at 48th ms and goes on decreasing non-uniformly.
Cross-sectional Forces on Pillar B-O-L & B-O-R
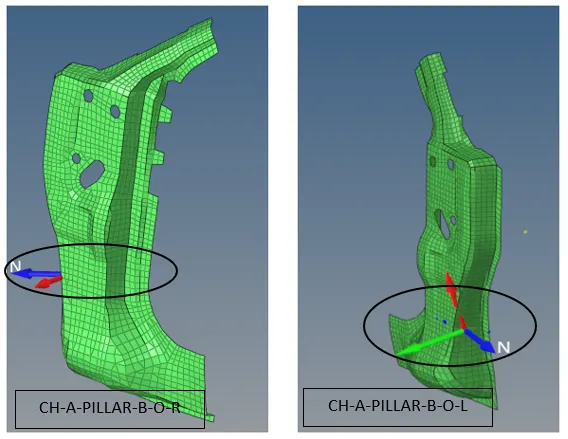
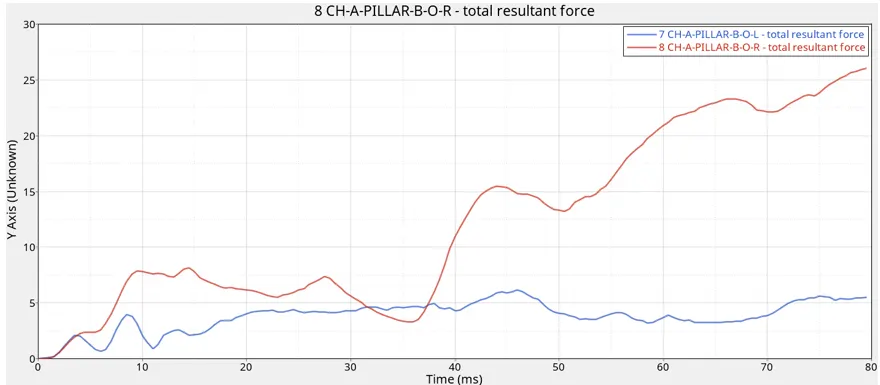
Max force on A-PILLAR-B-O-L= 5.1kN around 80th ms
Max force on A-PILLAR-B-O-R= 27kN around 80th ms.
The difference in values could be due to various reasons which could be due to the different cross-section definitions or if some component on either side of the vehicle didn’t deform identically, which is obviously the least possibility as deformation directions in a crash scenario can be pretty unpredictable.
‘A’ pillar Cross-sectional forces
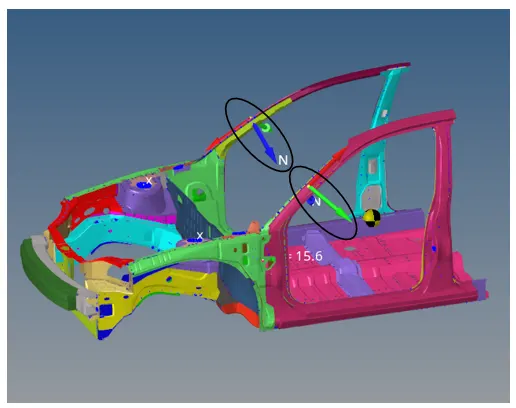
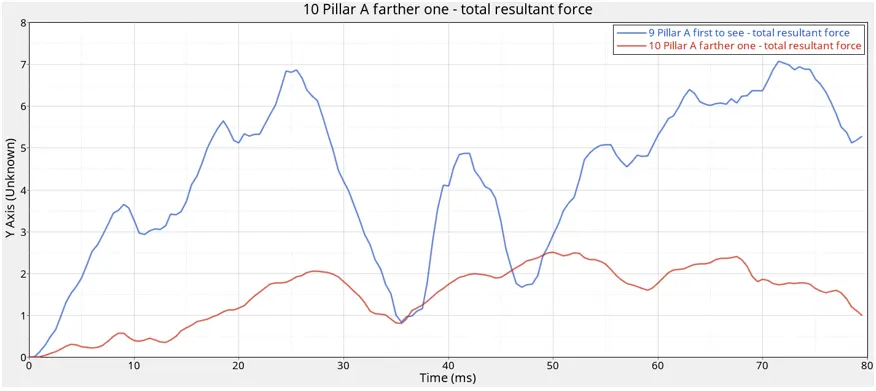
Max force on Pillar A(left side)= 7kN around 72nd ms.
Max force on Pillar A(right side)= 2.5kN around 50th ms.
It is observed from above that the forces across both pillars are not similar. This difference can be understood by the fact that during cross-section definitions different nodes & elements were selected.
Intrusions
Effective displacement was studied under intrusions to see how much the area around the accelerator and brake pedal were deformed during the crash.
Intrusions tell us how much the components from the crumple zone come inside the occupant safety. Any components from the engine, A/C components or railings coming into the occupant area will lead to fatal injuries. That is why study of intrusion is important.
Initial Intrusions(Before crash)
These intrusions are measure by placing a moving skew in approximately perpendicular direction to the nodes where intrusion is to be studied i.e. node ID 66695 & 66244. Now we can measure the distance between the origins of the moving skews placed and the nodes to be studied for intrusions.
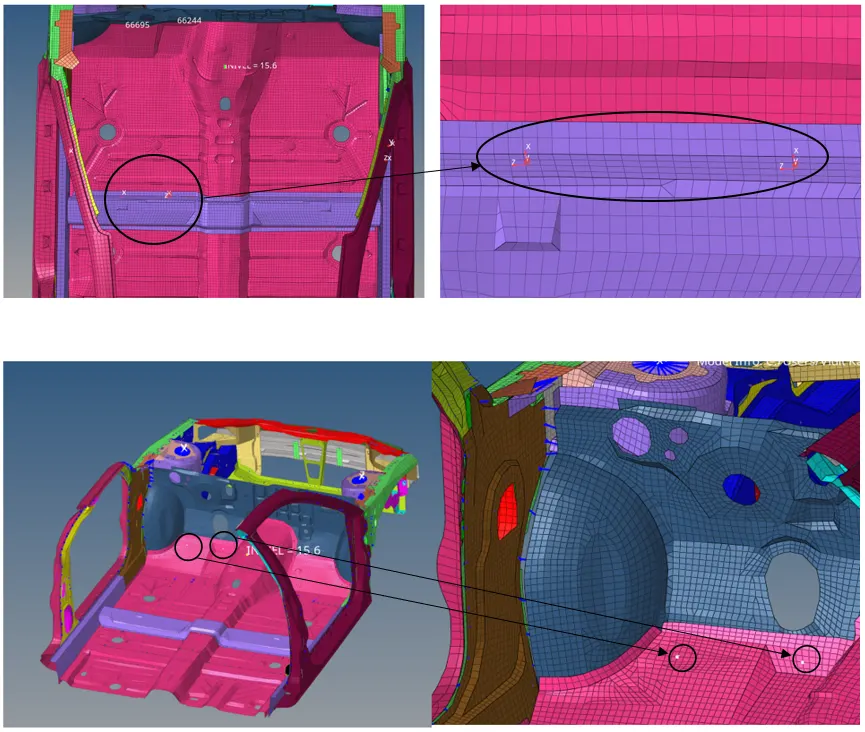
Left Node ID: 66695
Right Node ID: 66244
The measured distance(initial) between Node 66695 and skew1= 736.424mm
& distance distance(Initial) between Node 66244 and skew2= 758.712mm
Node 66244 & 66695
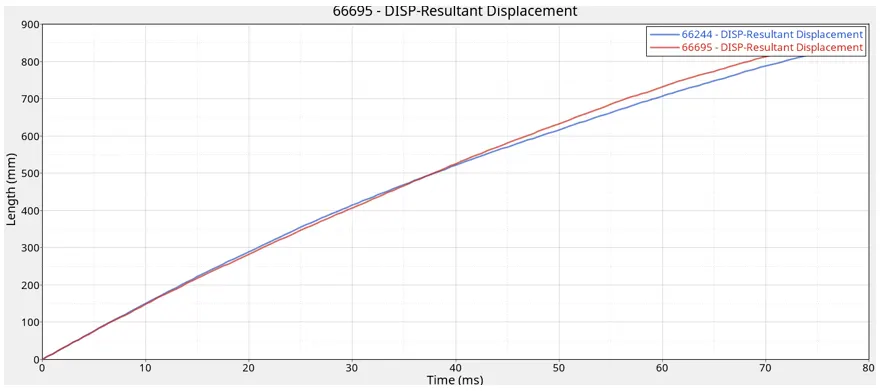
Max displacement= 900mm
Intrusion result:
The node 66695 intruded by 900-736.424= 163.576mm
The node 66244 intruded by 900-758.712= 141.288mm
Observations:
- Both the nodal positions are found to have superficially the same resultant displacement.
- The displacement of both the nodes become equal where the curve intersects i.e. at around 37.5th
- The displacement increases in a very gradual manner through the simulation time i.e. 80ms.
- Max displacement observed = 900mm.
Accelerometer(B Rocker)
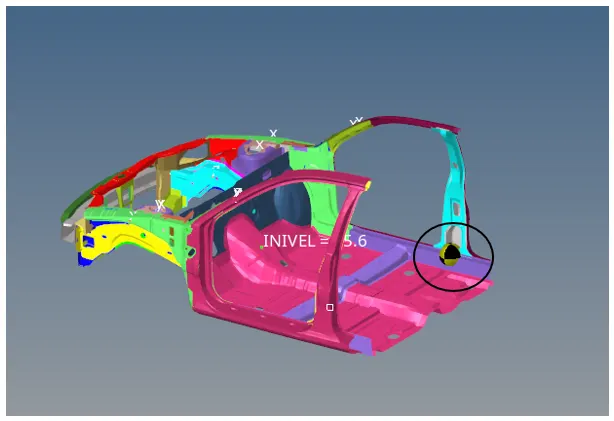
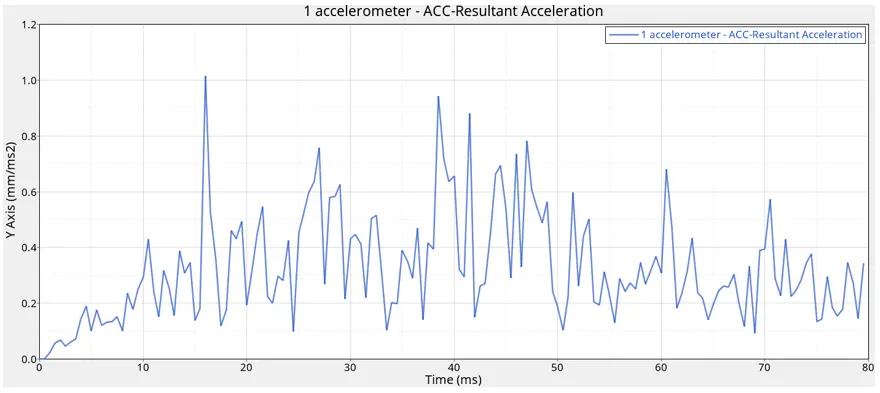
It is seen that there are a lot of jerks on the side where the accelerometer was placed on the B rocker(B pillar base)
The maximum acceleration= 1.1 mm/ms2 (approximately), during the first half of the crash i.e. around 16th ms. It can be seen though there are a lot of jerks the value of acceleration on the base of pillar B (B rocker) decreases as the crash reaches its completion at 80th ms.
Conclusion
Frontal crash analysis simulation was performed successfully using the required parameters. Various results, energy plots and cross-sectional forces were studied to analyze how particular component behaves during a crash scenario.