Assignment 5
MODEL 1:
AIM:
To mesh the Bumper component and weld the component at the detachments.
ABSTRACT:
To perform the base cleanup and mesh the component with given element size and weld the component at the detachments.
METHODOLOGY:
- 2D>automesh to mesh and remeshing.
- 1D>Connectors to create welds.
- Tools>Edges to connect the misaligned nodes.
PROCEDURE:
1.Mesh the bumper component with the given element size of 6mm by 2D>Automesh.
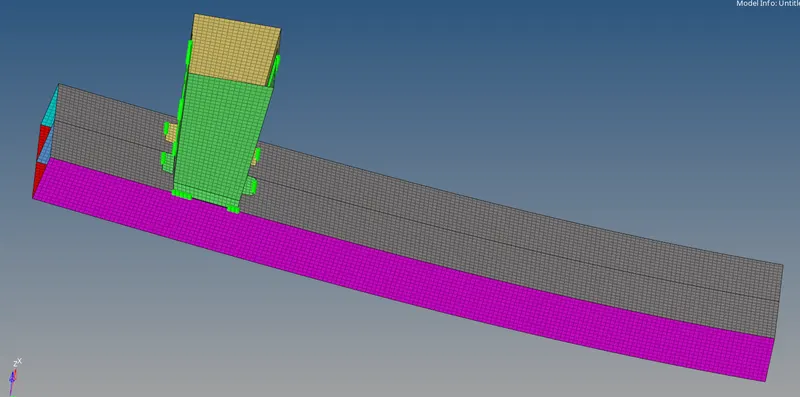
2.Replace the nodes which are misaligned in the bumper by Tools>Edges.Select the components that nodes to be replaced and give the tolerance value(which should be less than target size) and give the equivalence.
3.Connect the detached components with the spot weld by using 1D>Connectors.Select the spot and then select the nodelist in Location in the component and Type as spot and connect what as components that to be welded.

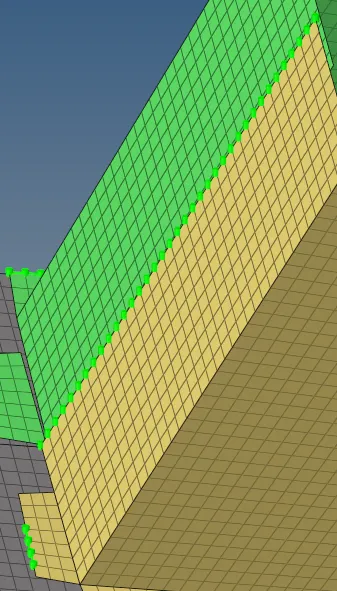
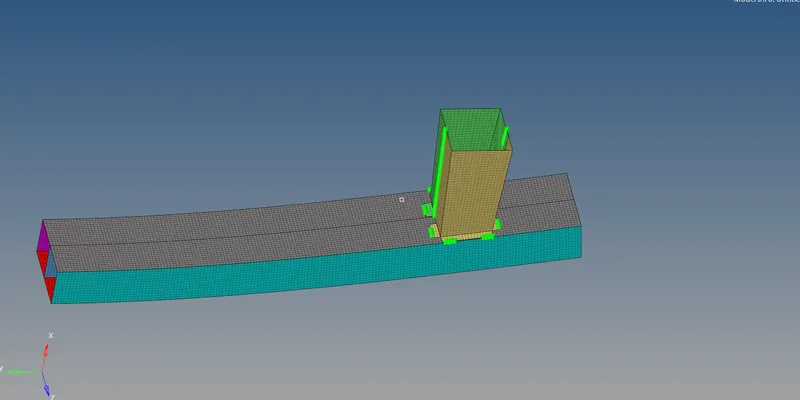
RESULT:Created the mesh for the bumper assembly and attached the components using spot weld.
MODEL 2:
AIM:
To run the simulation and compare the simulation and results of Crash Tube with five cases.
ABSTRACT:
To run the simulation in hypermesh in Radioss block by assigning the required values and then to run the crash animation in Hyperview block and Plotting graphs in HyperGraph 2D block between the Energies.
METHODOLOGY:
- Hypermesh>Analysis>Radioss to convert the file format to Radioss.
- Hyperview to run the animation of crash into a rigidwall.
- HyperGraph 2D to plot the graphs.
PROCEDURE:
CASE 1:
- Import the Crash tube Starter file(0000.rad) from Solver deck.
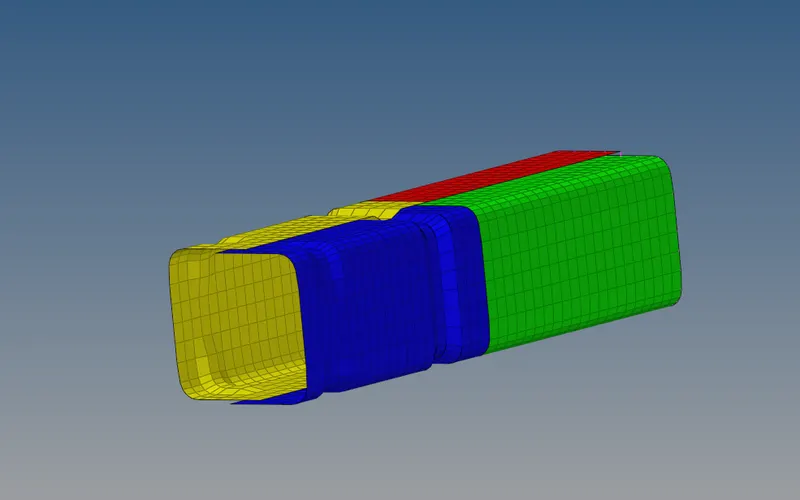
- As a choice can assign the value of Tstop as 55ms in Cards>Engine Run and in Engine-Animation-DT,Tstart and Tfreq as 25 and 0.1.
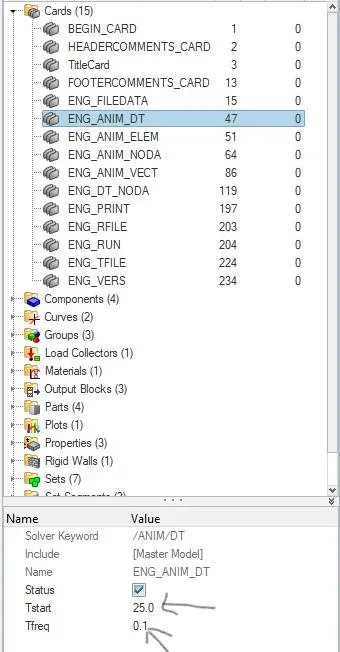
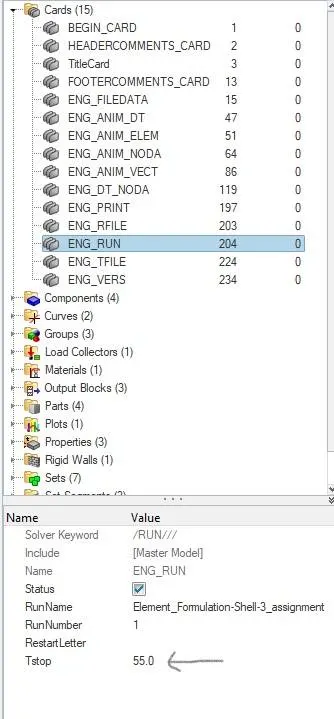
- In Analysis>Radioss,give the input file as (0000.rad) file and ‘tick’ include connectors which keeps in connected the surfaces and option as ‘-nt 4’ and click ‘Radioss’.

- It runs the base simulation and gives the error file as (0001.out) file which consists of mass error,energy error,external work and at the end of file it should indicate ‘NORMAL TERMINATION’ which indicates successful simulation without any errors.
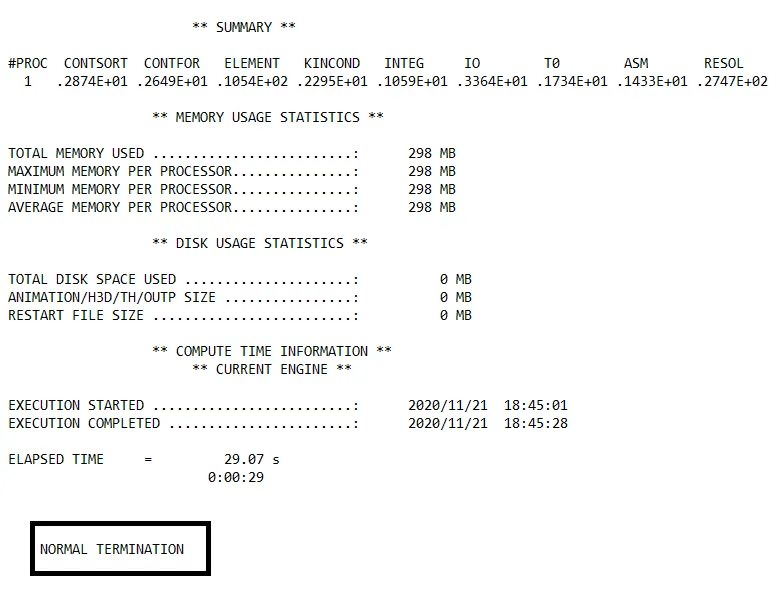
- Now change the Client selector (ToolBar) from ‘Hypermesh’ to ‘HyperView’ to create the animation of crash.Upload the file (h3d) in ‘Load model and results’ of case 1 and ‘Apply’.Save the animation video.
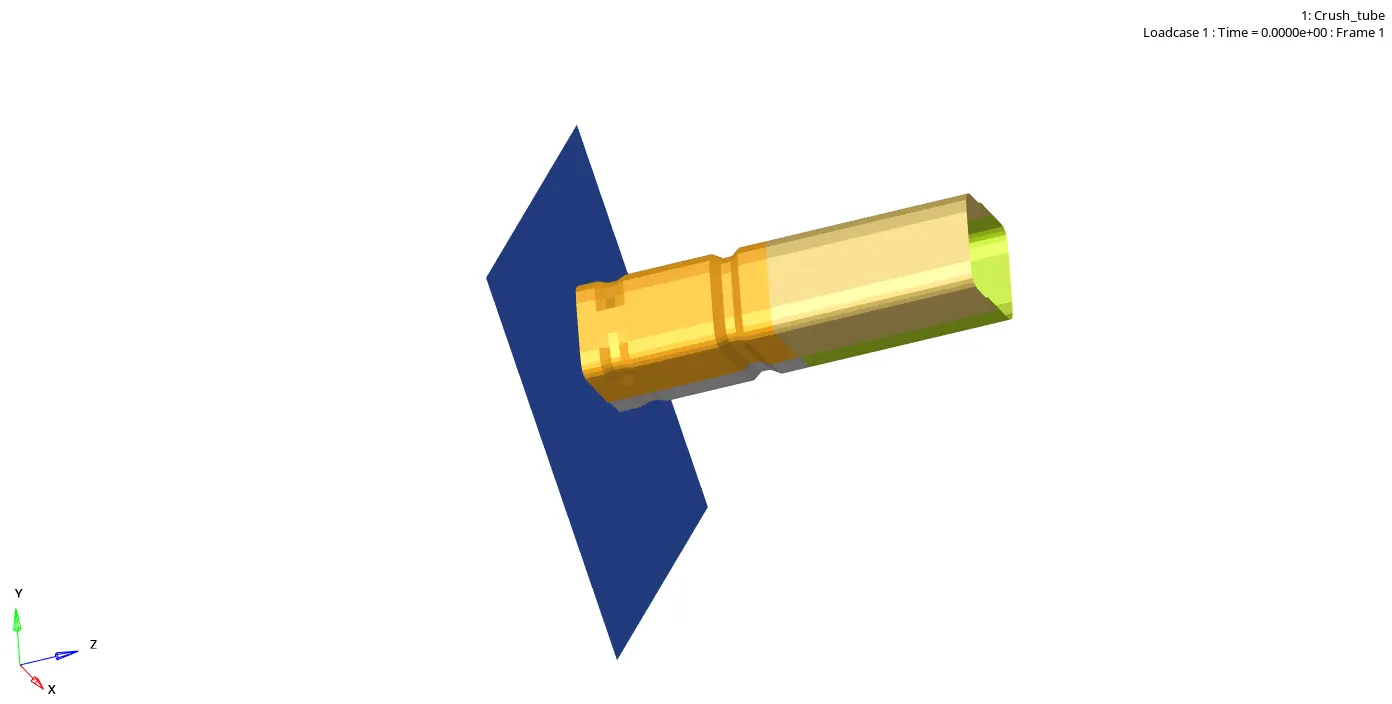
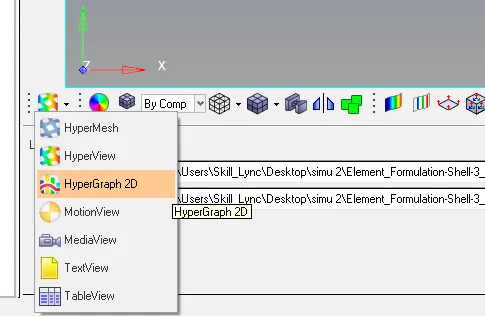
- Now change the Client selector from ‘Hyperview’ to ‘HyperGraph 2D’ where you need to plot the graphs which are given.
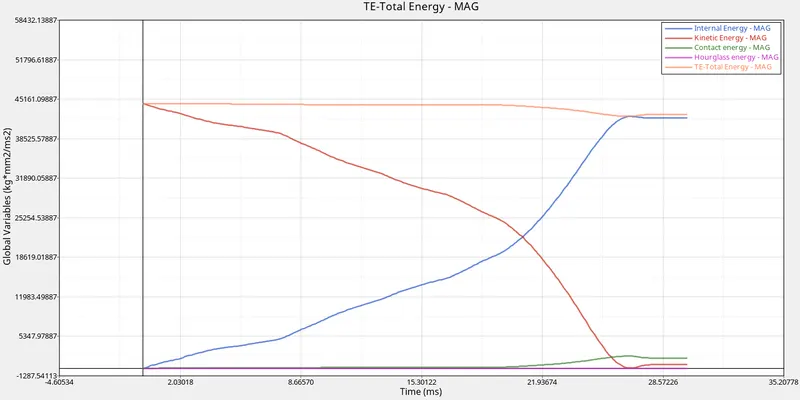
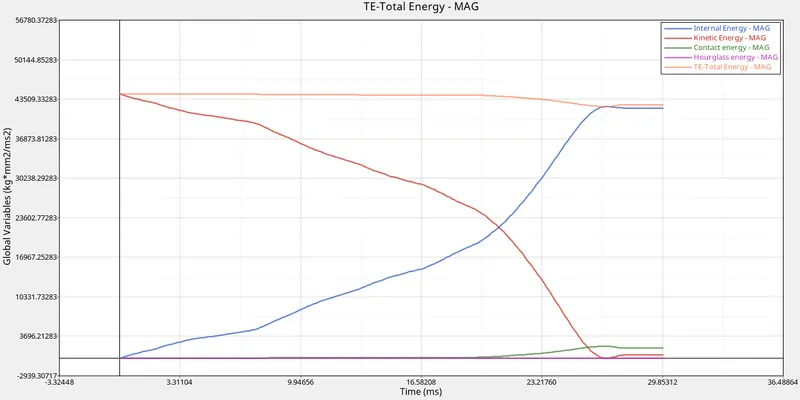
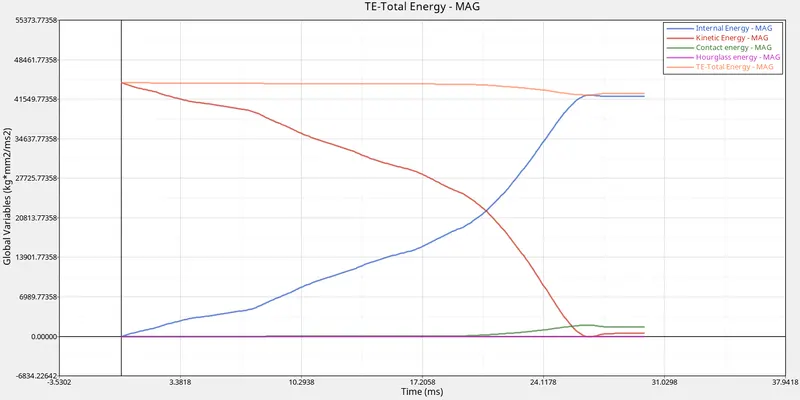
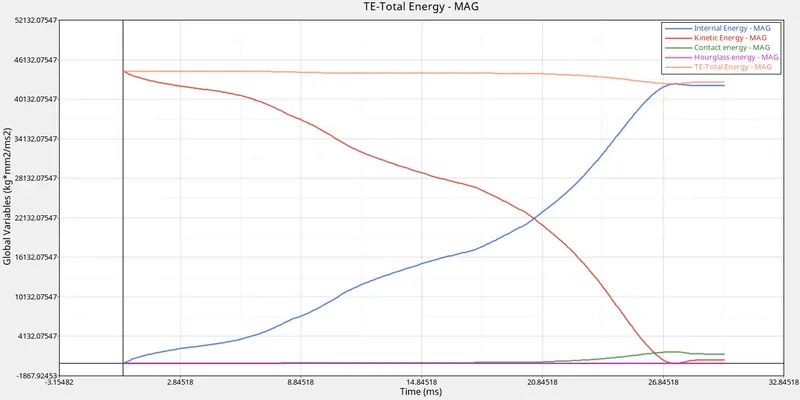
- Plot the graphs for internal energy,kinetic energy,hourglass energy, contact energy, total energy of the simulations.
CASE 2:
- Import the Case 1 Starter file(0000.rad) from Solver deck.
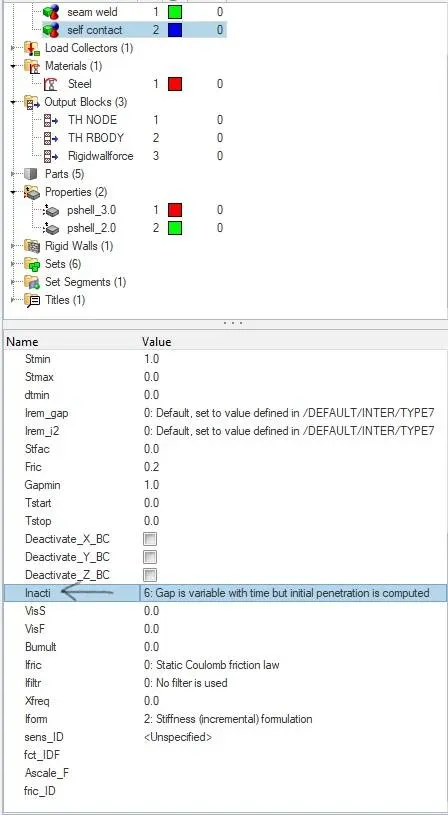
- Assign the value of Inacti 6 in the Groups>Self contact as it should be in Interface Type 7.
- As a choice can assign the value of Tstop as 55ms in Cards>Engine Run and in Engine-Animation-DT,Tstart and Tfreq as 25 and 0.1.
- In Analysis>Radioss,give the input file as (0000.rad) file and ‘tick’ include connectors which keeps in connected the surfaces and option as ‘-nt 4’ and click ‘Radioss’.
- It runs the base simulation and gives the error file as (0001.out) file which consists of mass error,energy error,external work and at the end of file it should indicate ‘NORMAL TERMINATION’ which indicates successful simulation without any errors.
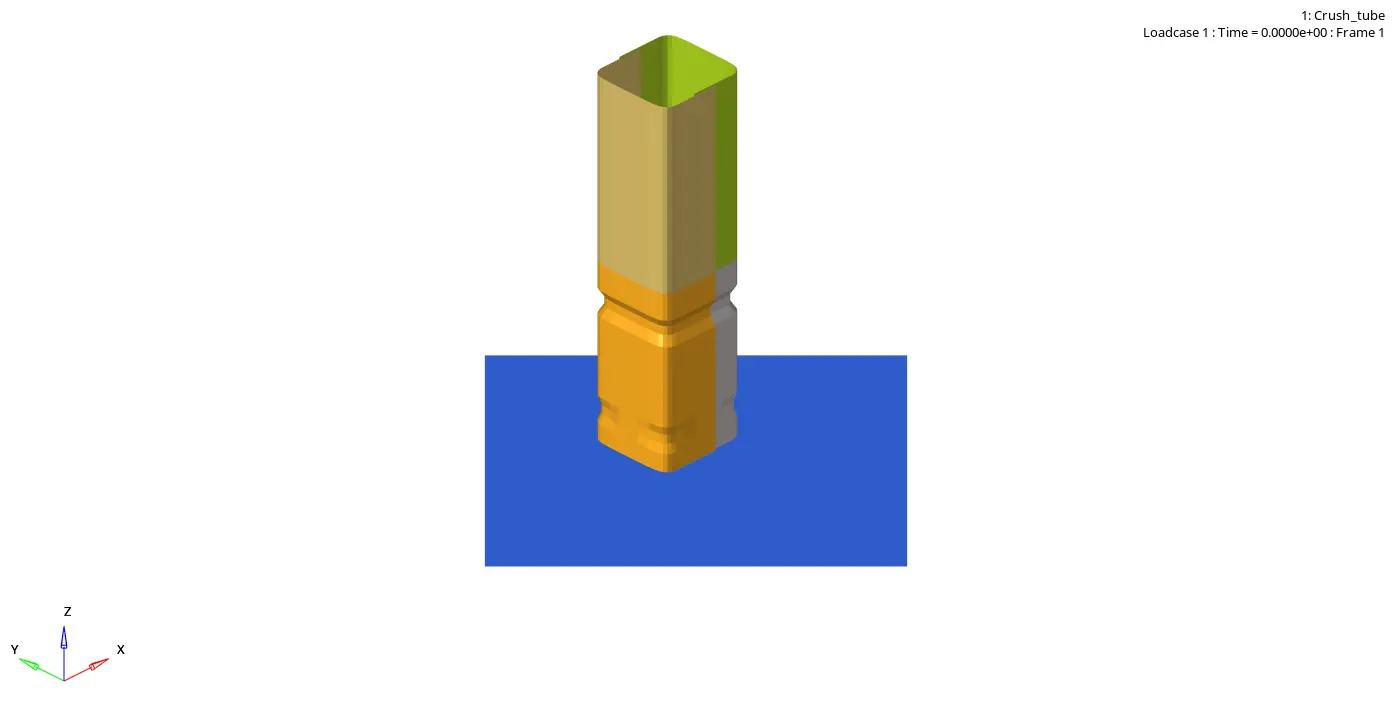
- Now change the Client selector (ToolBar) from ‘Hypermesh’ to ‘HyperView’ to create the animation of crash.Upload the file (h3d) in ‘Load model and results’ of case 1 and ‘Apply’.Save the animation video.
- Now change the Client selector from ‘Hyperview’ to ‘HyperGraph 2D’ where you need to plot the graphs which are given.
- Plot the graphs for internal energy,kinetic energy, hourglass energy, contact energy, total energy of the simulations.
CASE 3:
- Import the Case 2 Starter file(0000.rad) from Solver deck.
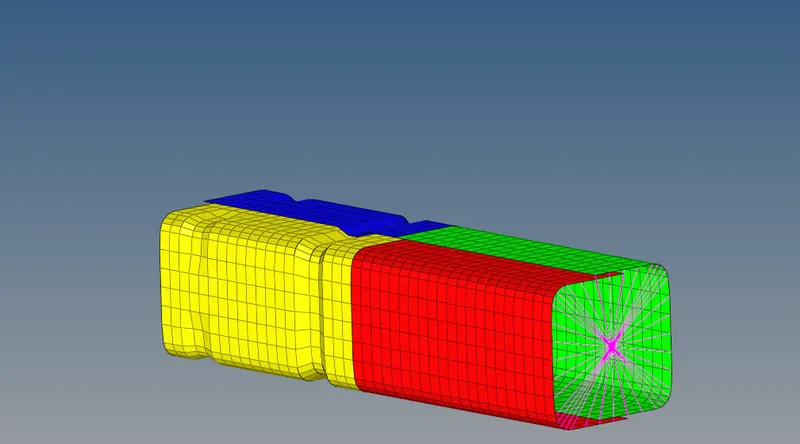
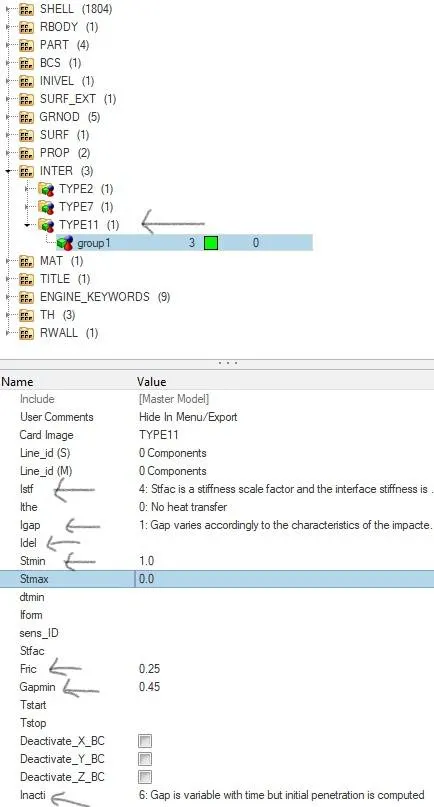
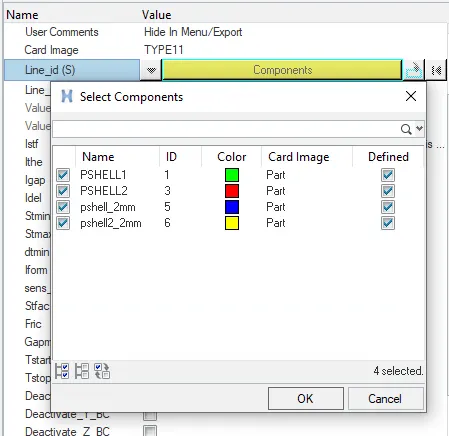
- Create an Interface Type 11 either from Model>Groups>create or Solver>INTER>Create and assign the recommended value in the required parameters and assign the all components in Line_id(M) and Line_id(S).
- As a choice can assign the value of Tstop as 55ms in Cards>Engine Run and in Engine-Animation-DT,Tstart and Tfreq as 25 and 0.1.
- In Analysis>Radioss,give the input file as (0000.rad) file and ‘tick’ include connectors which keeps in connected the surfaces and option as ‘-nt 4’ and click ‘Radioss’.
- It runs the base simulation and gives the error file as (0001.out) file which consists of mass error,energy error,external work and at the end of file it should indicate ‘NORMAL TERMINATION’ which indicates successful simulation without any errors.
- Now change the Client selector (ToolBar) from ‘Hypermesh’ to ‘HyperView’ to create the animation of crash.Upload the file (h3d) in ‘Load model and results’ of case 1 and ‘Apply’.Save the animation video.
- Now change the Client selector from ‘Hyperview’ to ‘HyperGraph 2D’ where you need to plot the graphs which are given.
- Plot the graphs for internal energy,kinetic energy,hourglass energy, contact energy, total energy of the simulations.
CASE 4:
- Import the Case 3 Starter file(0000.rad) from Solver deck.
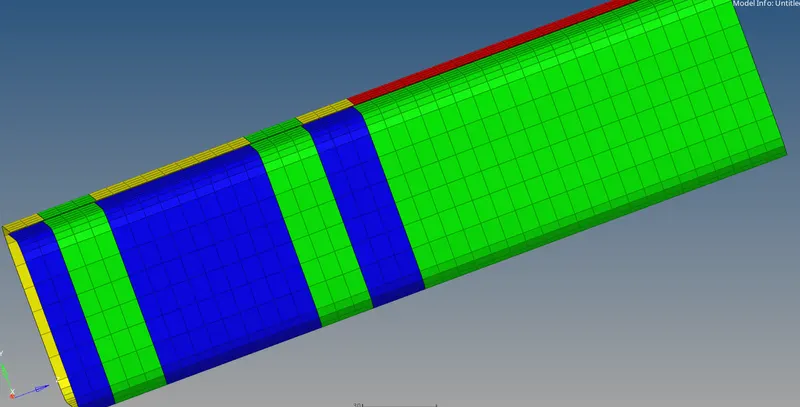
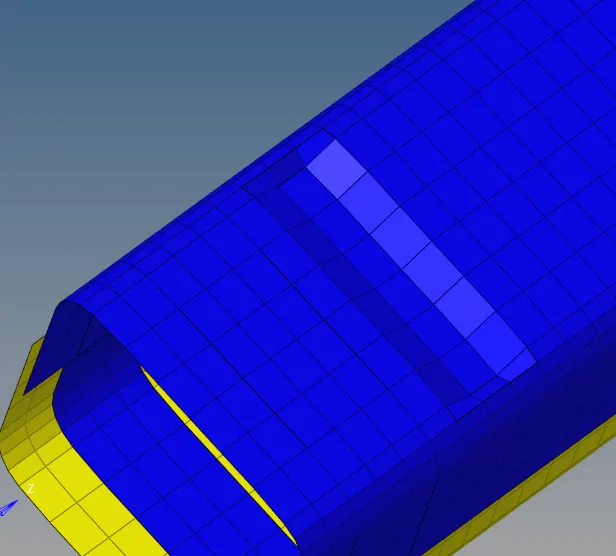
- Remove the notches from the model by deleting elements and create an elements using 2D>Ruled.

- Select the from nodes by nodelist>by path and to nodes by nodelist>by path and create elements and assign properties and material to the created elements.
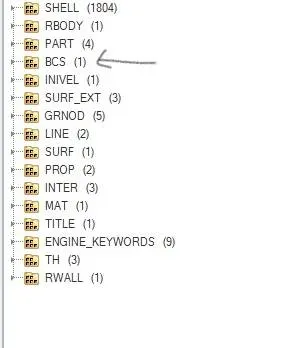
- Remove the Boundary Conditions from the Solver.
- As a choice can assign the value of Tstop as 55ms in Cards>Engine Run and in Engine-Animation-DT,Tstart and Tfreq as 25 and 0.1.
- In Analysis>Radioss,give the input file as (0000.rad) file and ‘tick’ include connectors which keeps in connected the surfaces and option as ‘-nt 4’ and click ‘Radioss’.
- It runs the base simulation and gives the error file as (0001.out) file which consists of mass error,energy error,external work and at the end of file it should indicate ‘NORMAL TERMINATION’ which indicates successful simulation without any errors.
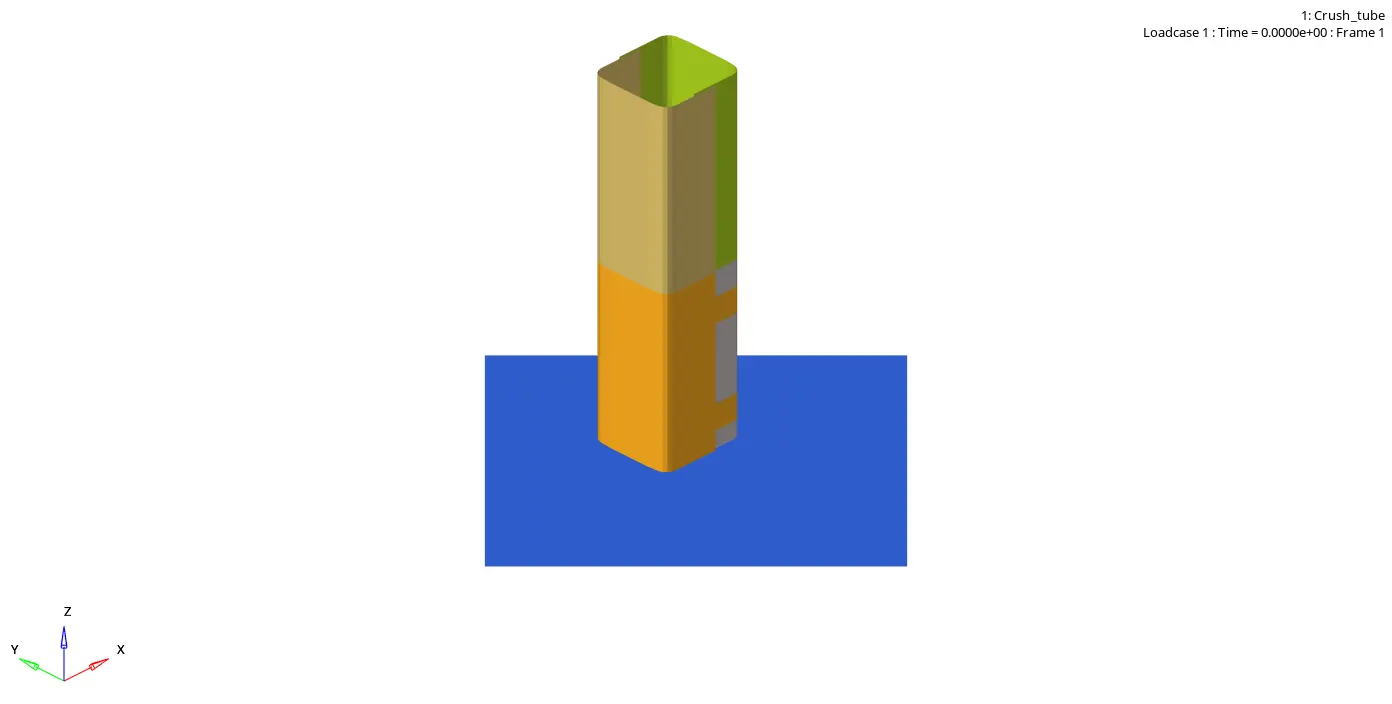
- Now change the Client selector (ToolBar) from ‘Hypermesh’ to ‘HyperView’ to create the animation of crash.Upload the file (h3d) in ‘Load model and results’ of case 1 and ‘Apply’.Save the animation video.
- Now change the Client selector from ‘Hyperview’ to ‘HyperGraph 2D’ where you need to plot the graphs which are given.
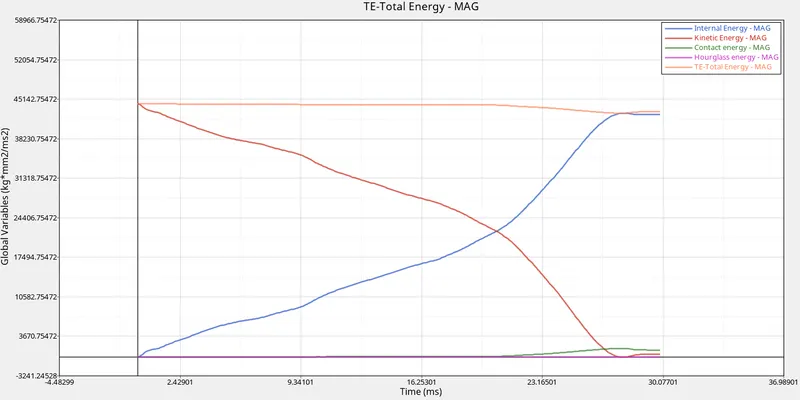
- Plot the graphs for internal energy,kinetic energy,hourglass energy, contact energy, total energy of the simulations.
CASE 5:
- Import the Case 4 Starter file(0000.rad) from Solver deck.
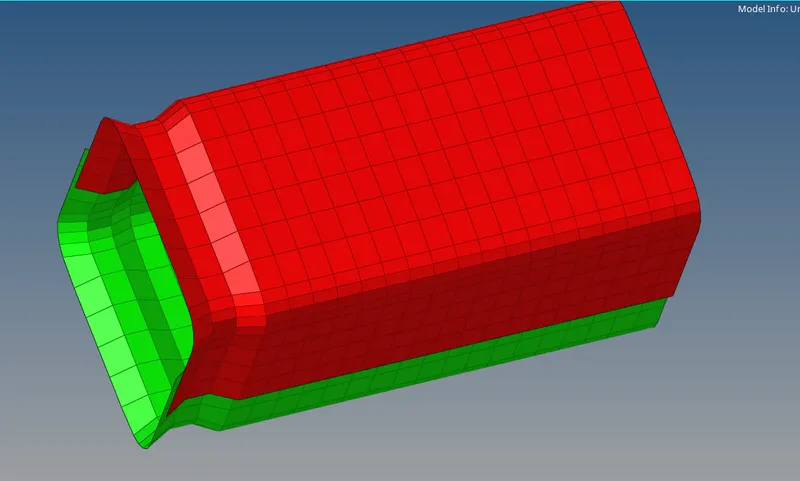
- Create a notch in the middle with the same depth from the previous case by using Tools>translate.

- As a choice can assign the value of Tstop as 55ms in Cards>Engine Run and in Engine-Animation-DT,Tstart and Tfreq as 25 and 0.1.
- In Analysis>Radioss,give the input file as (0000.rad) file and ‘tick’ include connectors which keeps in connected the surfaces and option as ‘-nt 4’ and click ‘Radioss’.
- It runs the base simulation and gives the error file as (0001.out) file which consists of mass error,energy error,external work and at the end of file it should indicate ‘NORMAL TERMINATION’ which indicates successful simulation without any errors.
- Now change the Client selector (ToolBar) from ‘Hypermesh’ to ‘HyperView’ to create the animation of crash.Upload the file (h3d) in ‘Load model and results’ of case 1 and ‘Apply’.Save the animation video.
- Now change the Client selector from ‘Hyperview’ to ‘HyperGraph 2D’ where you need to plot the graphs which are given.
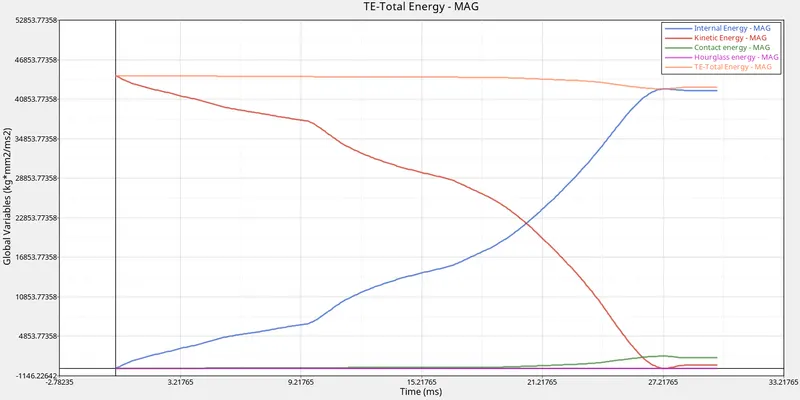
- Plot the graphs for internal energy,kinetic energy,hourglass energy,contact energy, total energy of the simulations.
CASE 6:
- Import the Case 5 Starter file(0000.rad) from Solver deck.
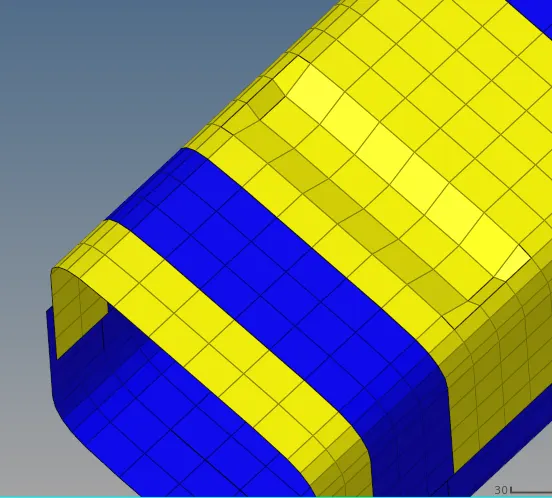
- Create a notch on two opposite faces using 2D>Translate.
- As a choice can assign the value of Tstop as 55ms in Cards>Engine Run and in Engine-Animation-DT,Tstart and Tfreq as 25 and 0.1.
- In Analysis>Radioss,give the input file as (0000.rad) file and ‘tick’ include connectors which keeps in connected the surfaces and option as ‘-nt 4’ and click ‘Radioss’.
- It runs the base simulation and gives the error file as (0001.out) file which consists of mass error,energy error,external work and at the end of file it should indicate ‘NORMAL TERMINATION’ which indicates successful simulation without any errors.
- Now change the Client selector (ToolBar) from ‘Hypermesh’ to ‘HyperView’ to create the animation of crash.Upload the file (h3d) in ‘Load model and results’ of case 1 and ‘Apply’.Save the animation video.
- Now change the Client selector from ‘Hyperview’ to ‘HyperGraph 2D’ where you need to plot the graphs which are given.
- Plot the graphs for internal energy,kinetic energy,hourglass energy,contact energy, total energy of the simulations.
Crash tube: Mainly used in car bumpers to resist the crash and reduce the impact.
COMPARISON:
Case 1 and Case 2:
 START _ CASE 1
 END_CASE 1
 START_CASE 2
 END_CASE 2
1.The energies from the graph and Engine file(.0001) are very identical and similar due to adding the Inacti parameter in case 2 which adjusts the penetration during simulation.
2.So as there are no penetrations in the model in case 1 and even after simulation of crash in case 2 Inacti adjusts the gap while simulation.
Observation between case 4 and case 5 where case 4 is without notch and case 5 is with notch:
 START_CASE 4
 END_CASE 4
 START_CASE 5
 END_CASE 5
- Due to creating the notch and removal of boundary conditions,it affects the increase in time step, number of cycles and there is a decrease in internal energy and external work.
As there is already TH NODE is created in the Output block in the Tab view and it takes the average of all the results and gives the output,TH/PART is not considered.
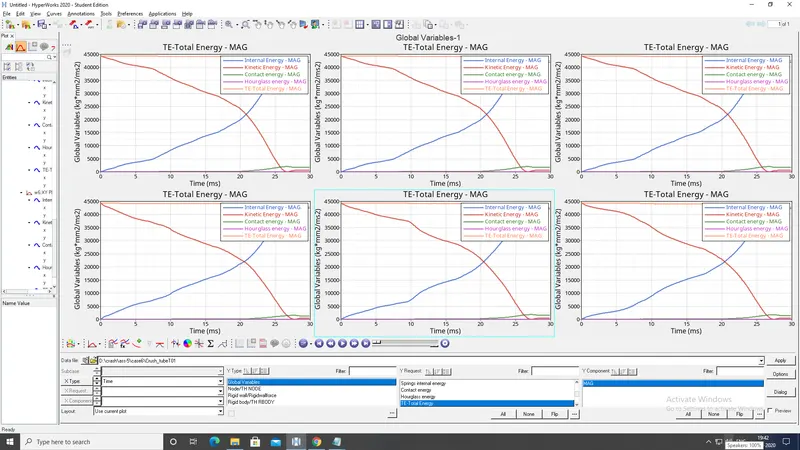
Energies varies between the graphs in case 1,2,3 and 4,5,and 6 as internal energy and kinetic energy changes between case 4 and case 5 due to the notch.
Observation between the case 2 and case 3 as case 2 is type 7 and case 3 is type 11.
- The number of cycles and time steps in case 3 increases when compared to case 2 due to change in Interface type from type 7 to type 11.
- Internal energy and contact energy remains constant.
Type 7:
- Contact gap can be constant.
- Resistive forces are applied to keep the slave nodes out of the contact gap.
Type 11 is similar to Type 7
RESULT:Completed the simulation and Plotted the graphs for different energies.
CONCLUSION:
From the graphs it can be concluded that,creating the notch between the crash tube causes changes in increasing and decreasing in internal energy and kinetic energy.
Contact energy remains constant.