Comparison of simulation using different material formulations in RADIOSS
OBJECTIVE: To simulate the given case for 7 different simulation conditions. To compare and contrast the various simulation cases.
PROCEDURE: In order to complete the given simulation, the following steps have to be taken:
1. Import the .rad file and give the appropriate material properties and failure cards.
2. Export to another .rad file.
3. Go to Analysis => RADIOSS. This will complete the simulation.
4. Check the mass and energy errors by opening the .out file. If the mass and energy errors are within acceptable values, then proceed with the results of the simulation.
5. Create graph for internal energy vs time using Hypergraph 2D.
6. Create .gif files of displacement, strain and stress.
7. Compare and contrast the results obtained from the various cases.
The CAD geometry of the plate that is being indented is given below:
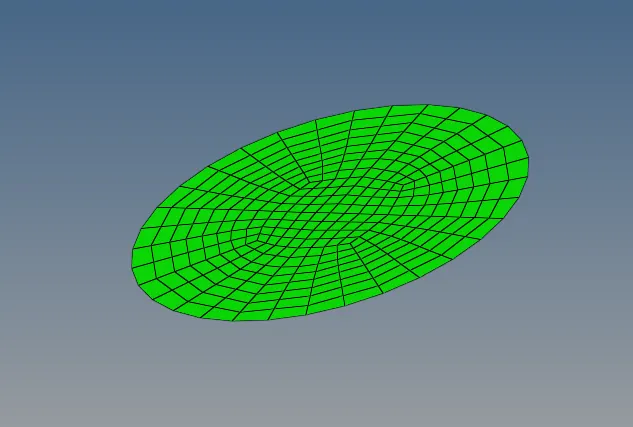
Fig.1 CAD geometry of the plate
The simulation includes the indentation of the plate by using a rigid sphere as given below:
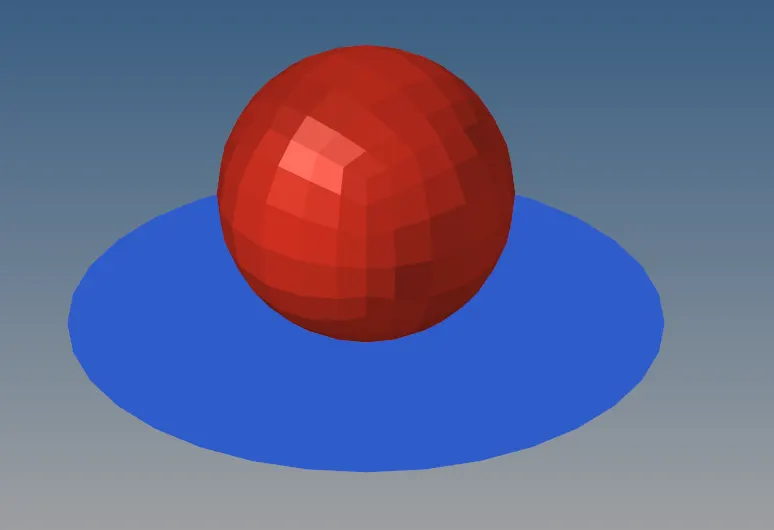
Fig.2 Simulation with red spherical indenter applying force upon the blue plate
CASE 1: Material - Law2, EPS_max - 0.15, failure - delete:
In case 1, the Johnson-Cook material was used with maximum strain value of 0.15 given with failure card. LXFEM is set at 0 which means that the elements are deleted and not cracked when they exceed the maximum strain value. The following results were obtained:
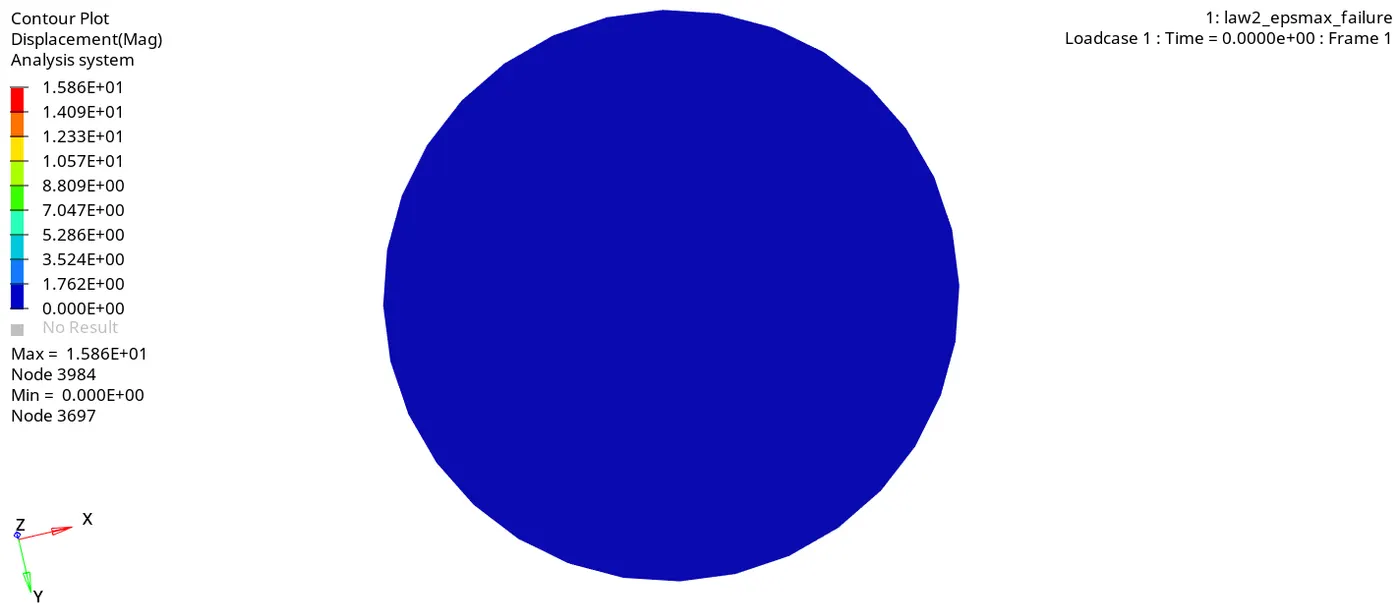
Fig.3 Displacement variation in case 1
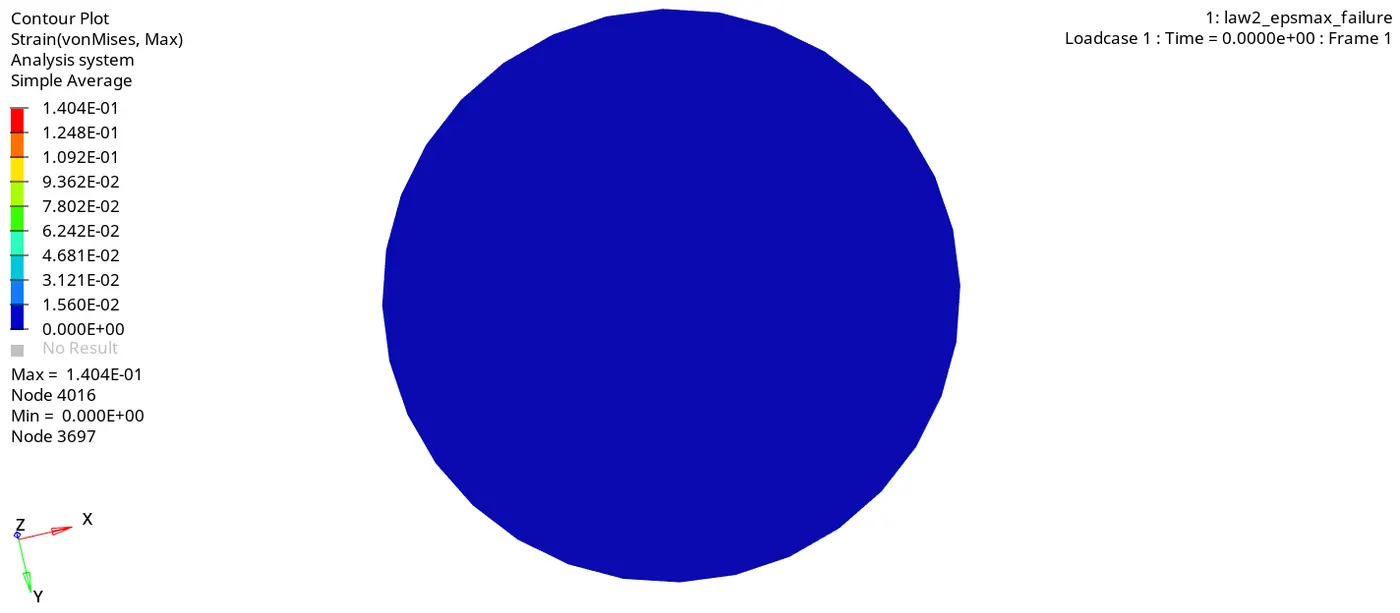
Fig.4 Strain variation in case 1
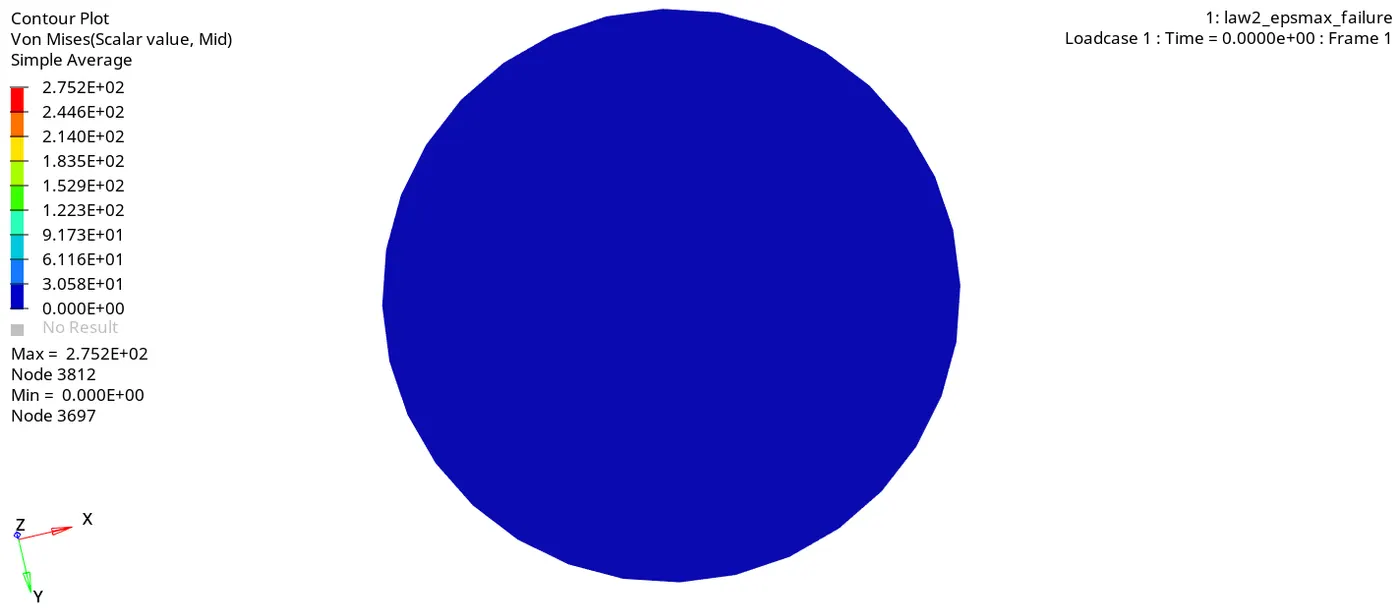
Fig.5 Von Mises stress variation of case 1
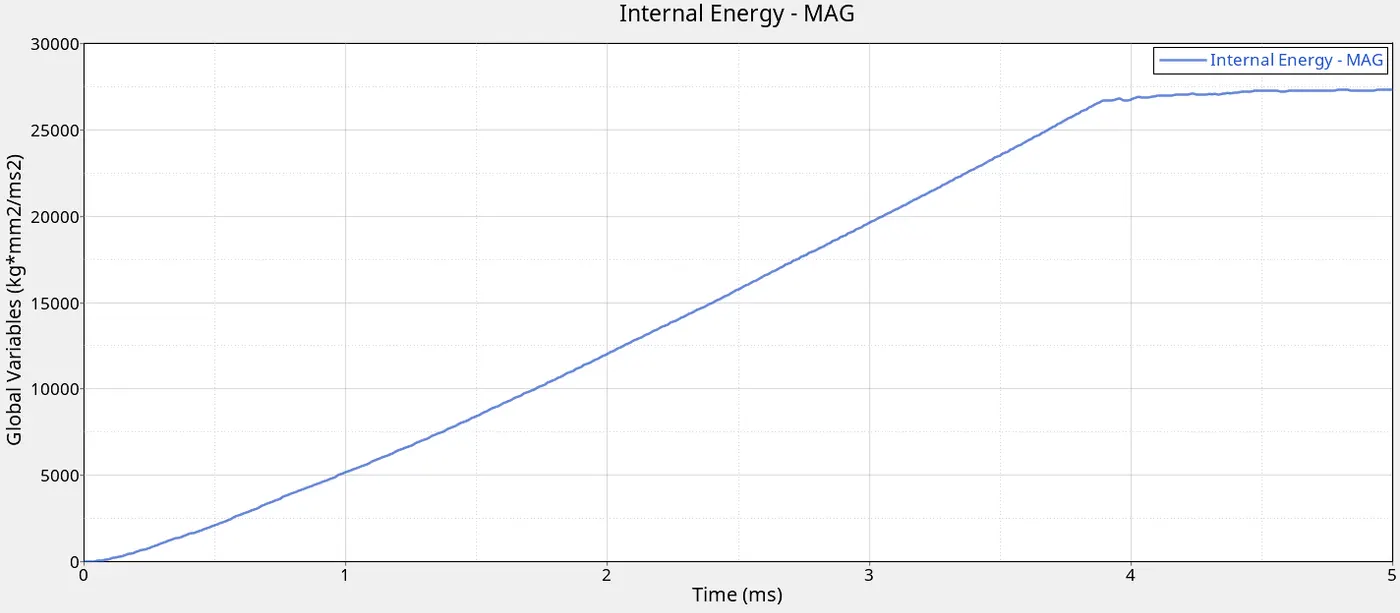
Fig.6 Internal energy vs time for case 1
CASE 2: Material - Law2, EPS_max - 0.15, failure-crack:
In case 2, the only difference was made on the failure card:
Ifail_sh = 1
Dadv = 1
Ixfem = 1
Because of Ixfem being 1, these specific settings lead to material being cracked instead of delted when the strain increases beyond the maximum.The following results were obtained:
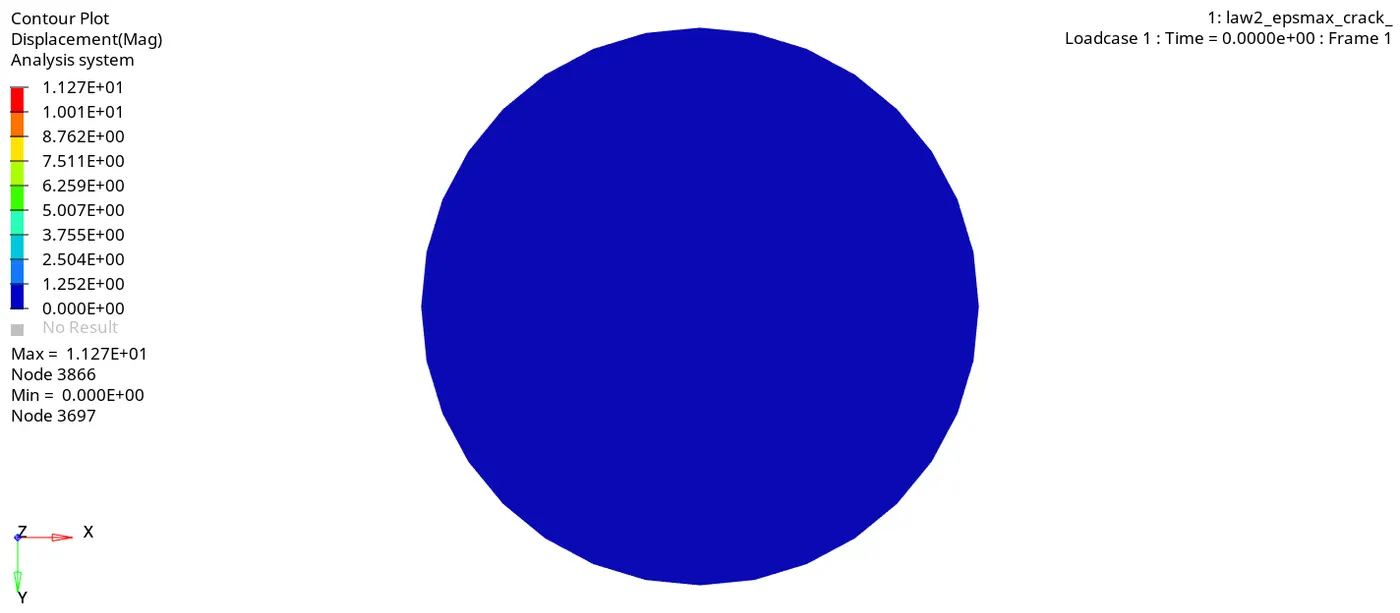
Fig.7 Displacement variation in case 2
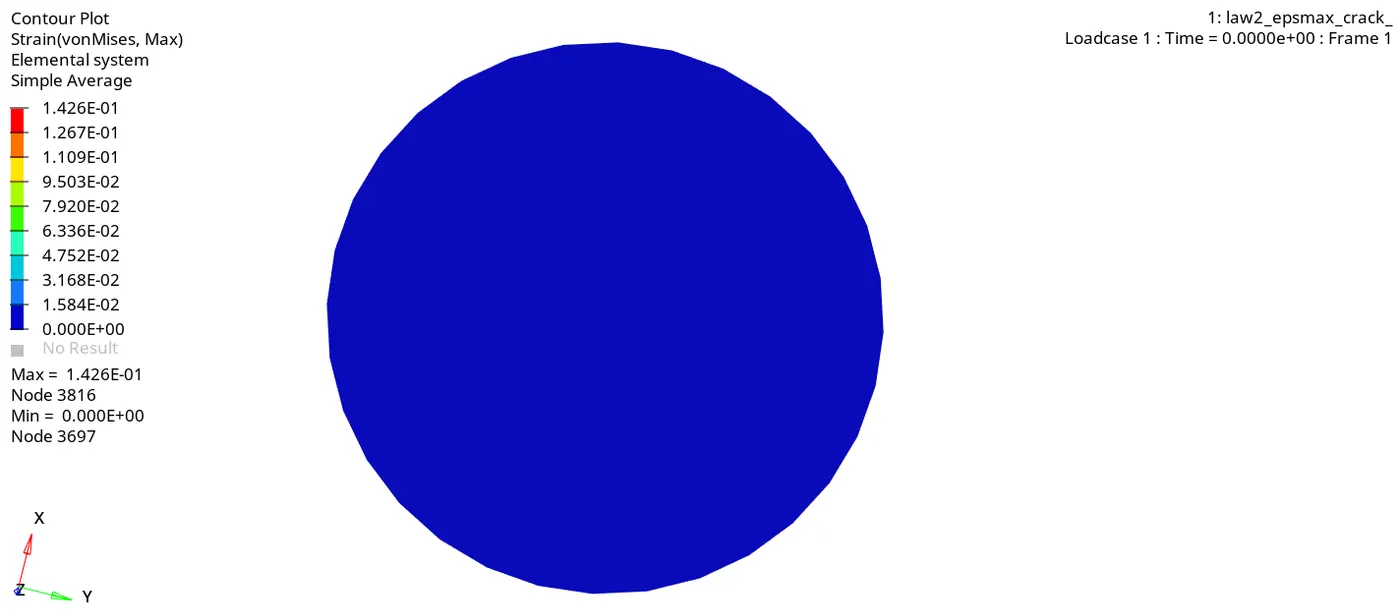
Fig.8 Strain variation in case 2
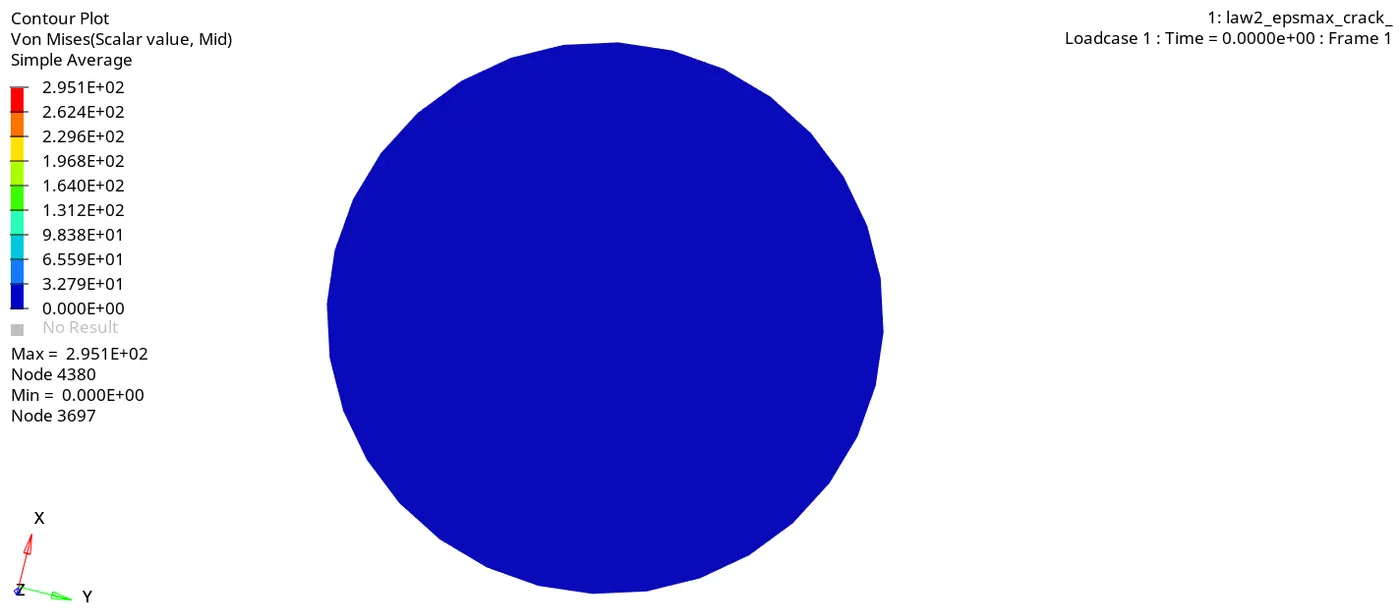
Fig.9 Von misses stress variation in case 2
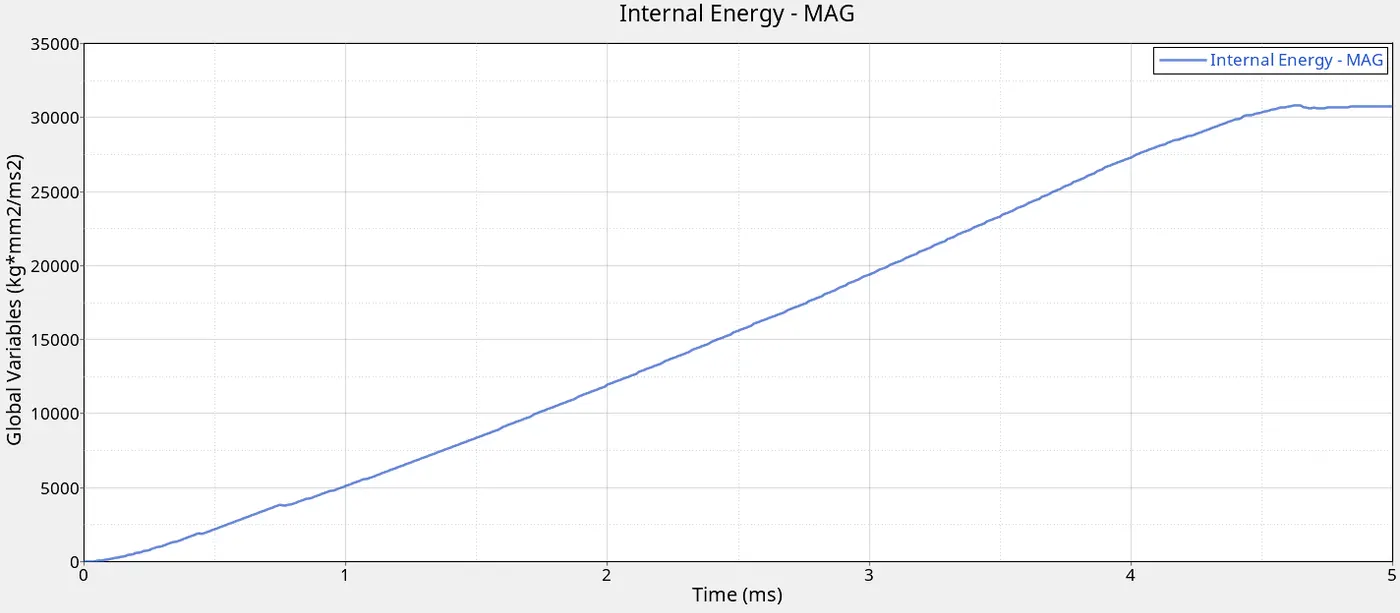
Fig.10 Internal energy graph in case 2
CASE 3: Material - Law 2, EPS_max - 0.15, no failure card:
This case is similar to case 1, but with failure card removed. The results obtained are given below:
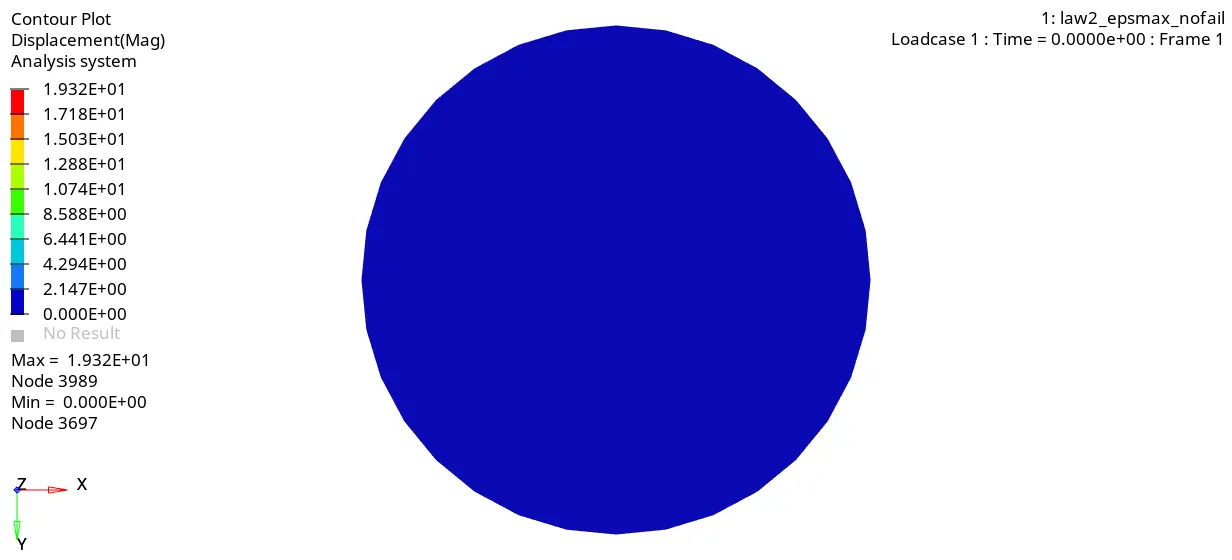
Fig.11 Displacement variation in case 3
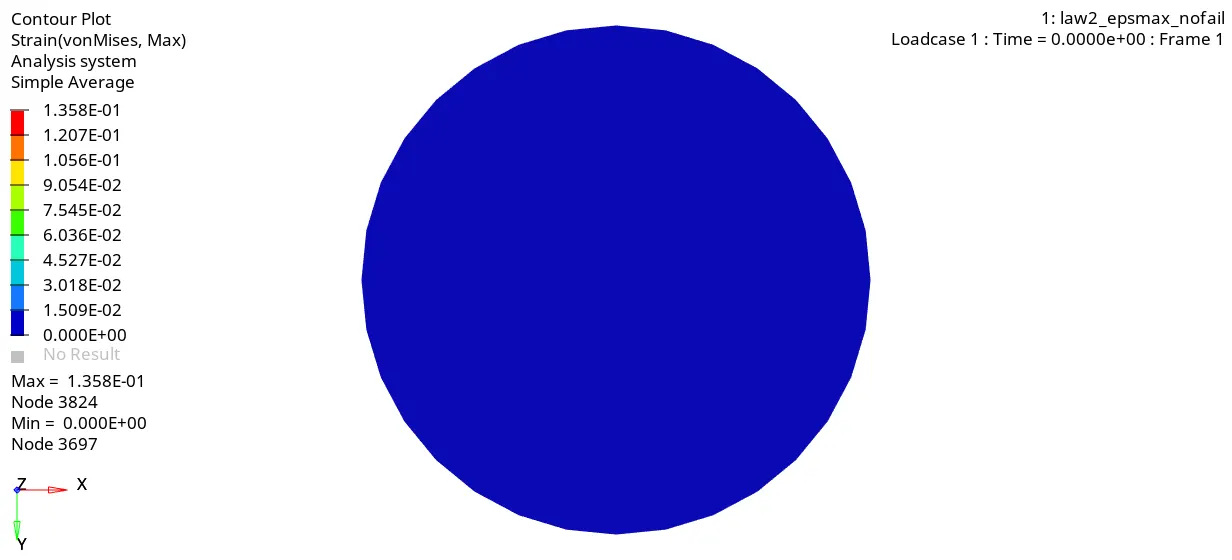
Fig.12 Strain variation in case 3
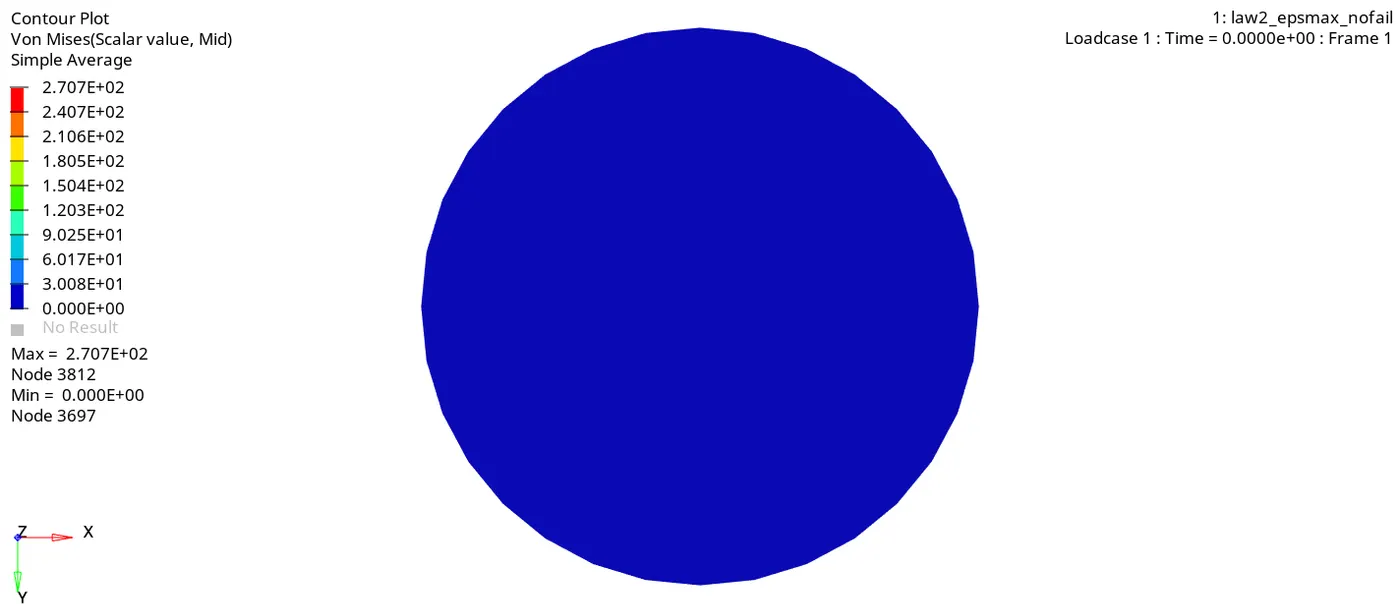
Fig.13 Stress variation in case 3
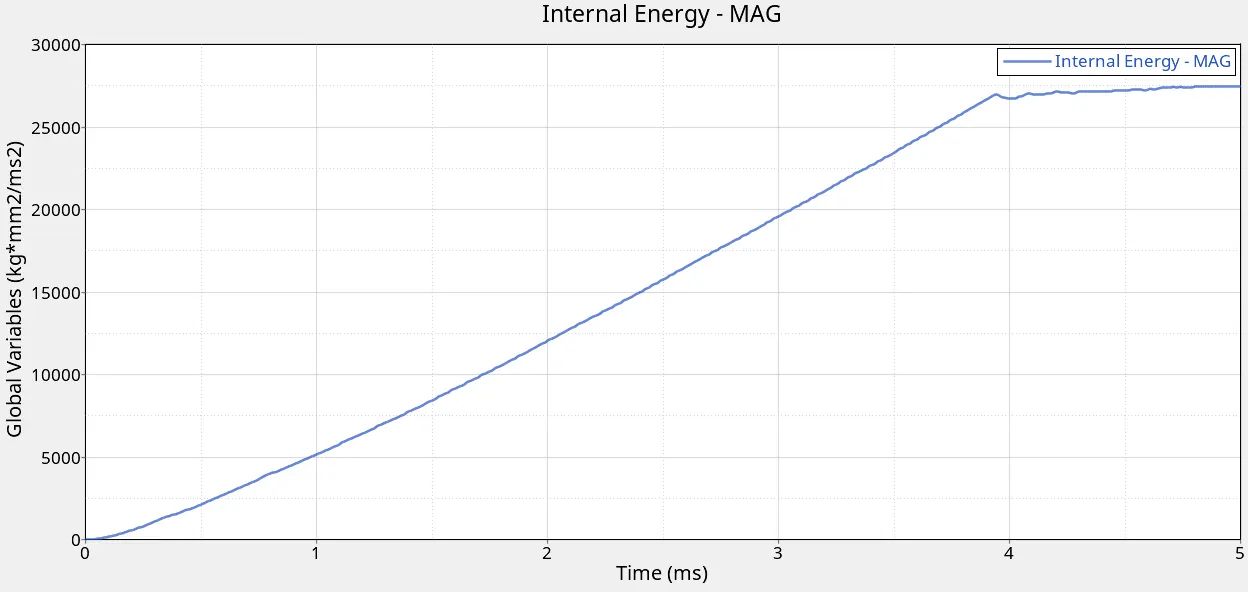
Fig.14 Internal energy vs Time in case 3
CASE 4: Material - Law 2, EPS_max removed, failure card removed:
This case is similar to case 1 but with failure card removed and EPS-max is also removed. The following results were obtained:
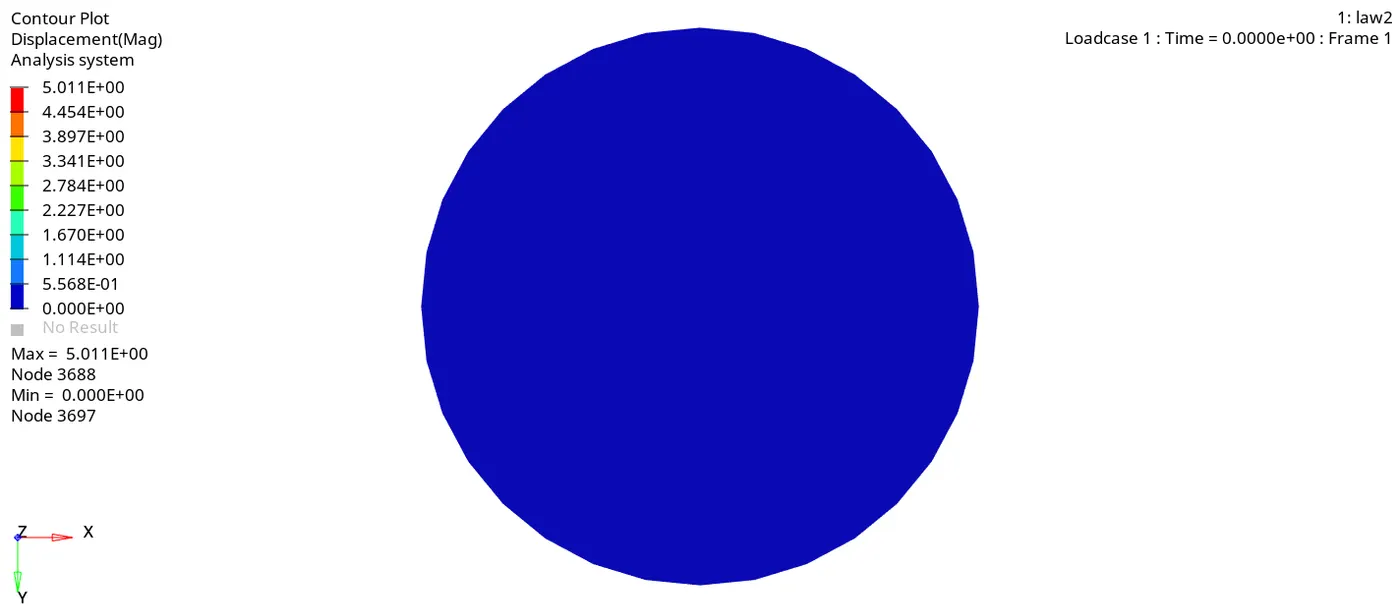
Fig.15 Displacement variation in case 4
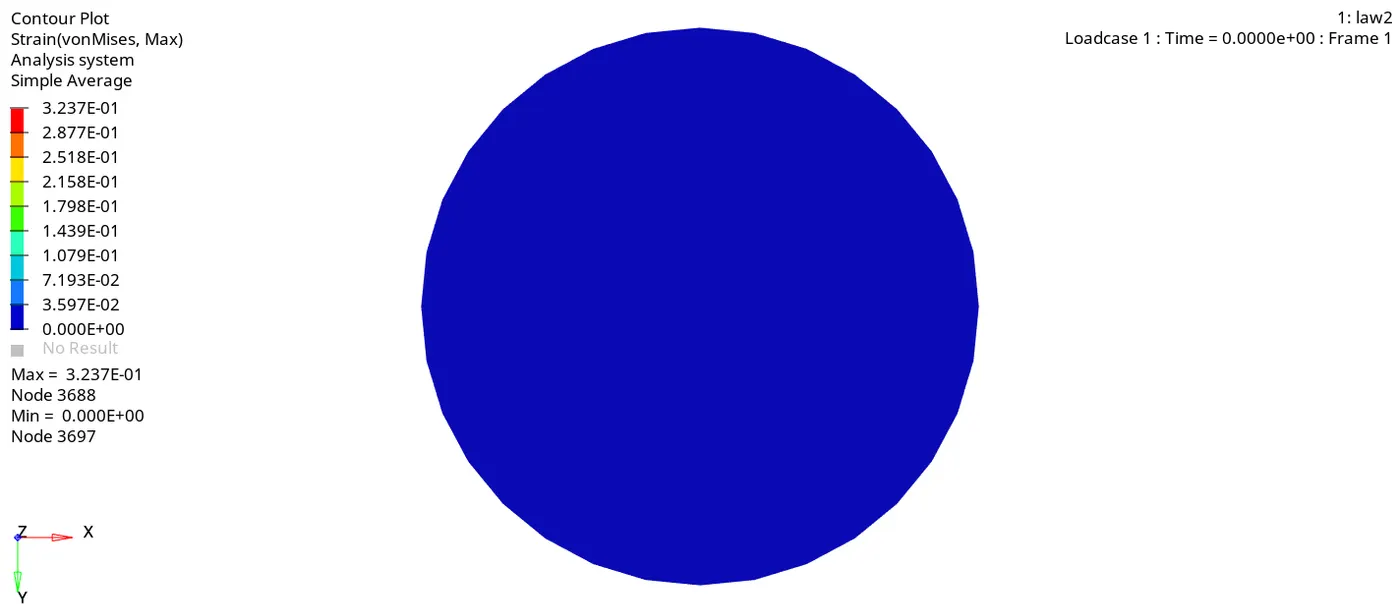
Fig.16 Strain variation in case 4
Fig.17 Von mises stress variation in case 4
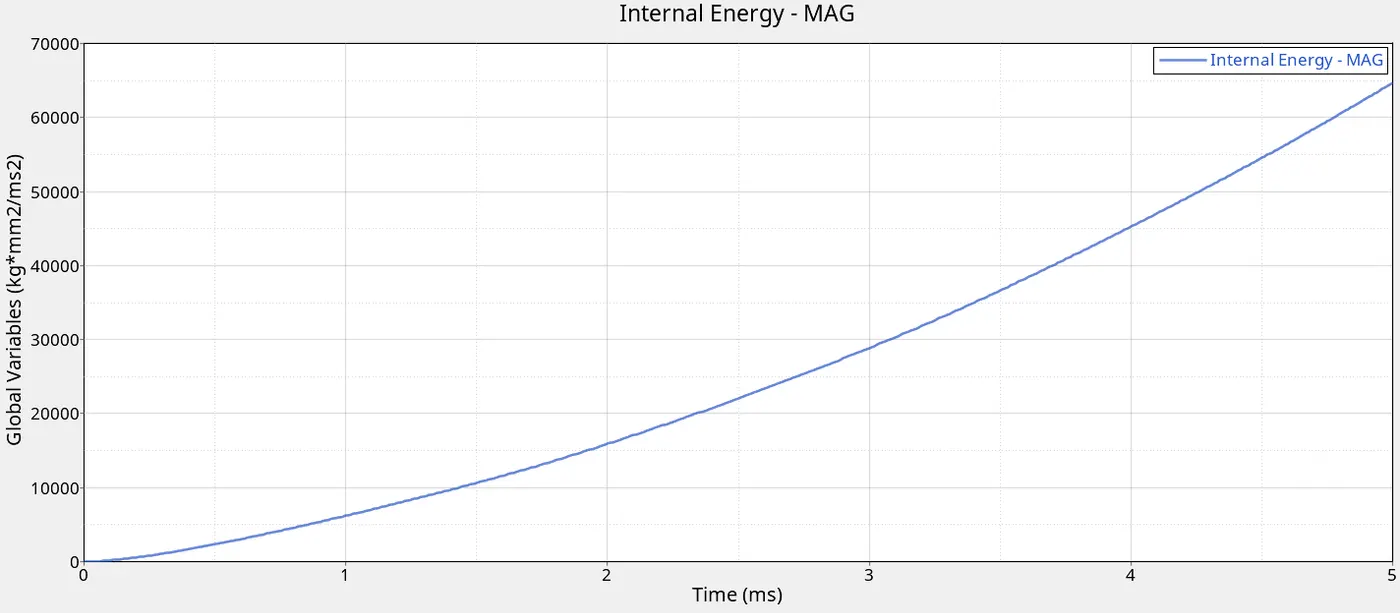
Fig.18 Internal energy vs Time in case 4
CASE 5: Material-Law 1:
This case is similar to case 4 but material model is changed to Law 1 material. The following results were obtained:
Fig.19 Displacement variation in case 5
Fig.20 Strain variation in case 5
Fig.21 Von Mises Stress variation in case 5
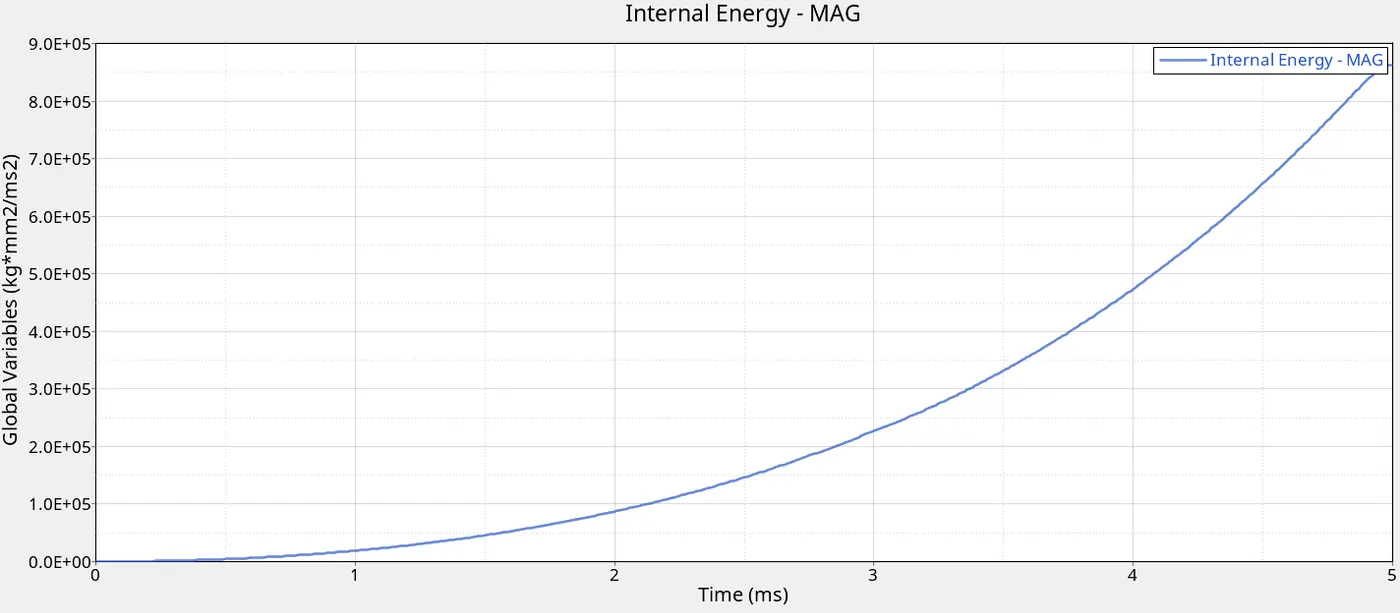
Fig.22 Internal energy vs Time in case 5
CASE 6: Material - Law 27:
In this case the material was changed to law 27. The following results were obtained:
Fig.23 Displacement variation in case 6
Fig.24 Strain variation in case 6
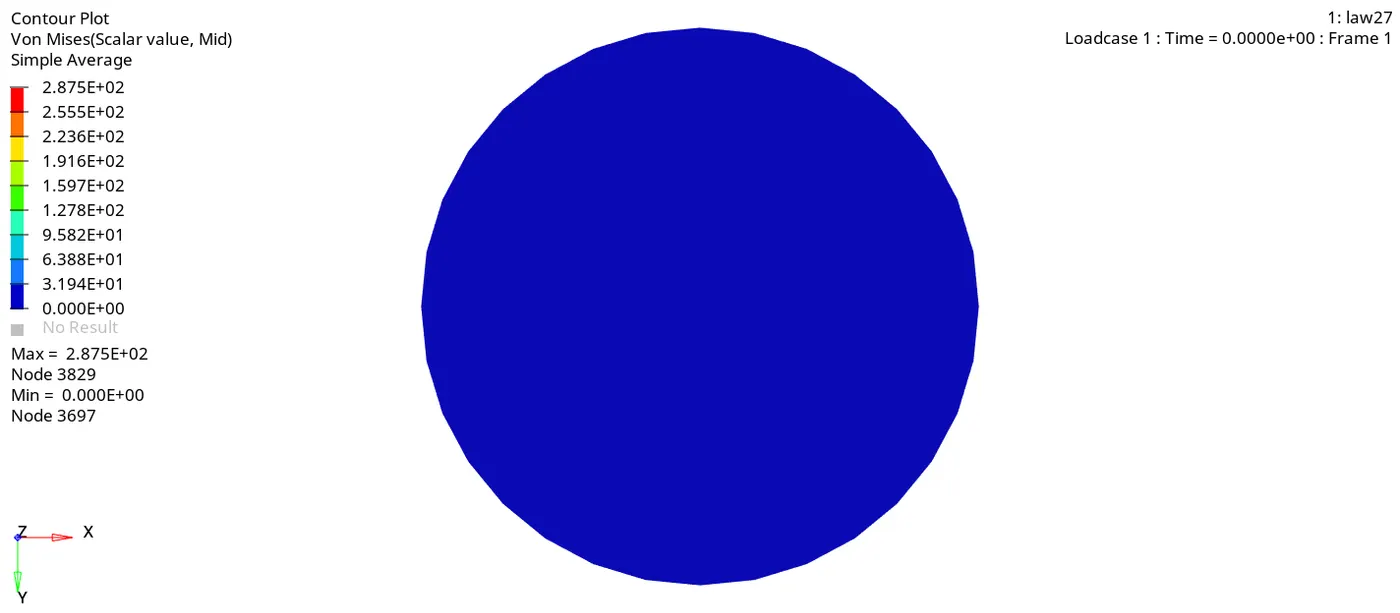
Fig.25 Von mises stress variation in case 6
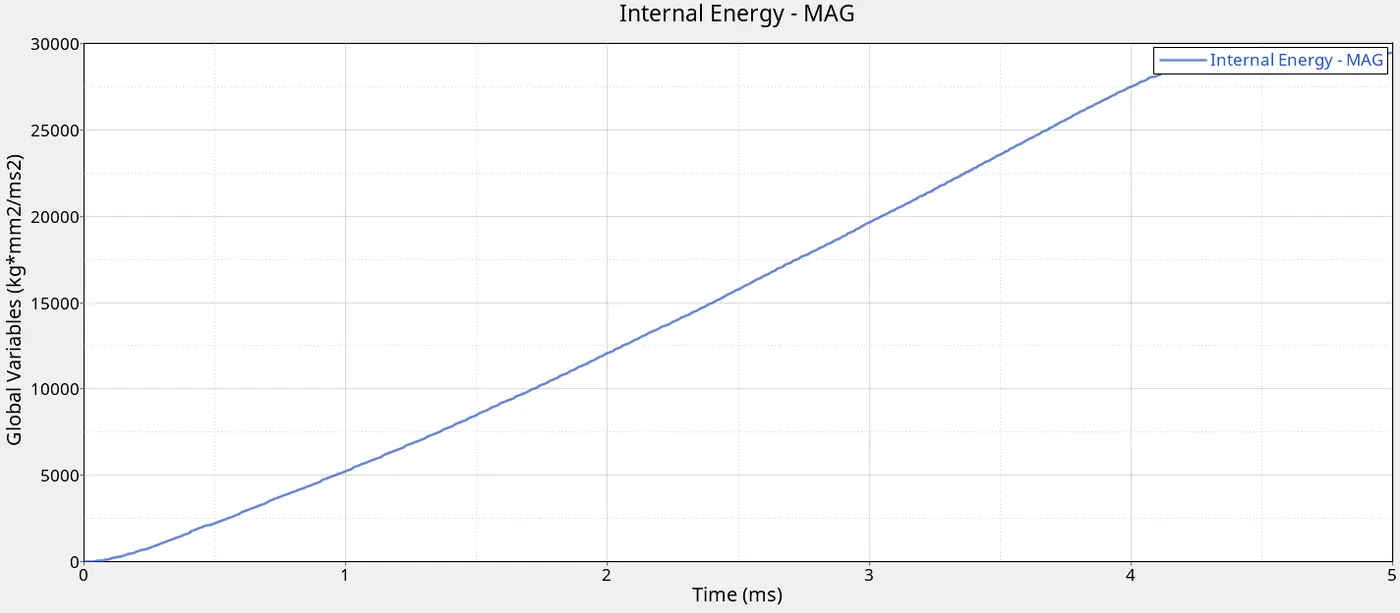
Fig.26 Internal energy vs time in case 6
CASE 7: Material - Law 36:
In this case, the material was changed to Law 36 material. The following results were obtained:
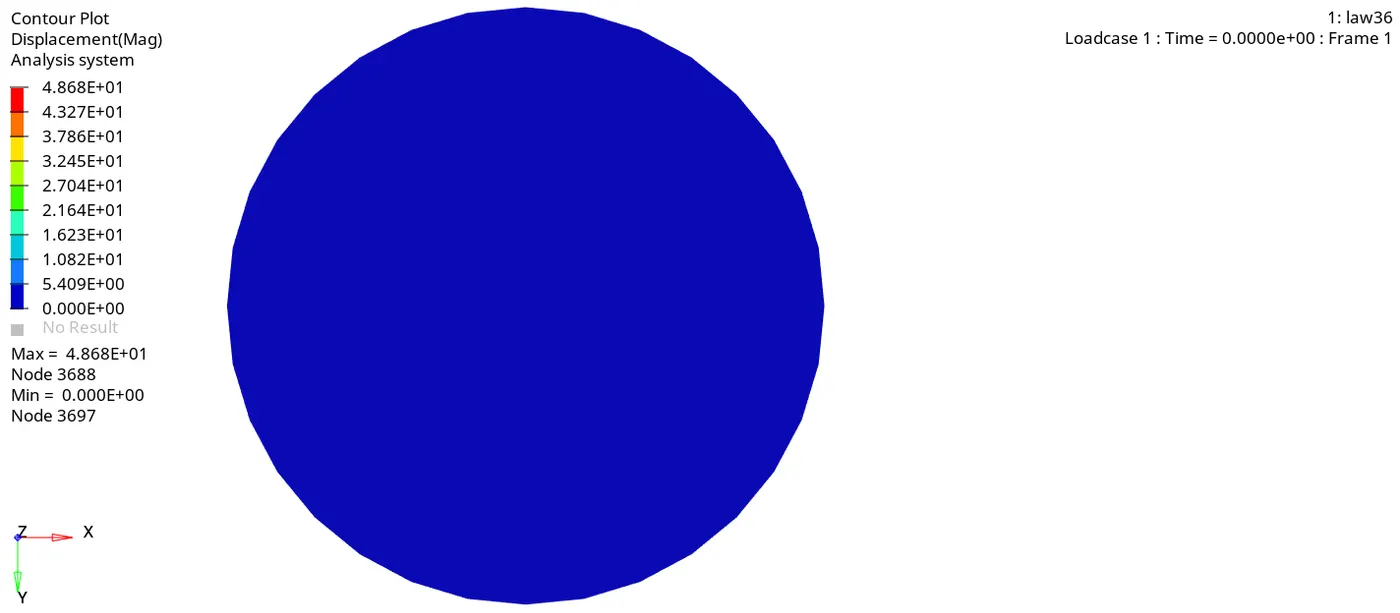
Fig.27 Displacement variation in case 7
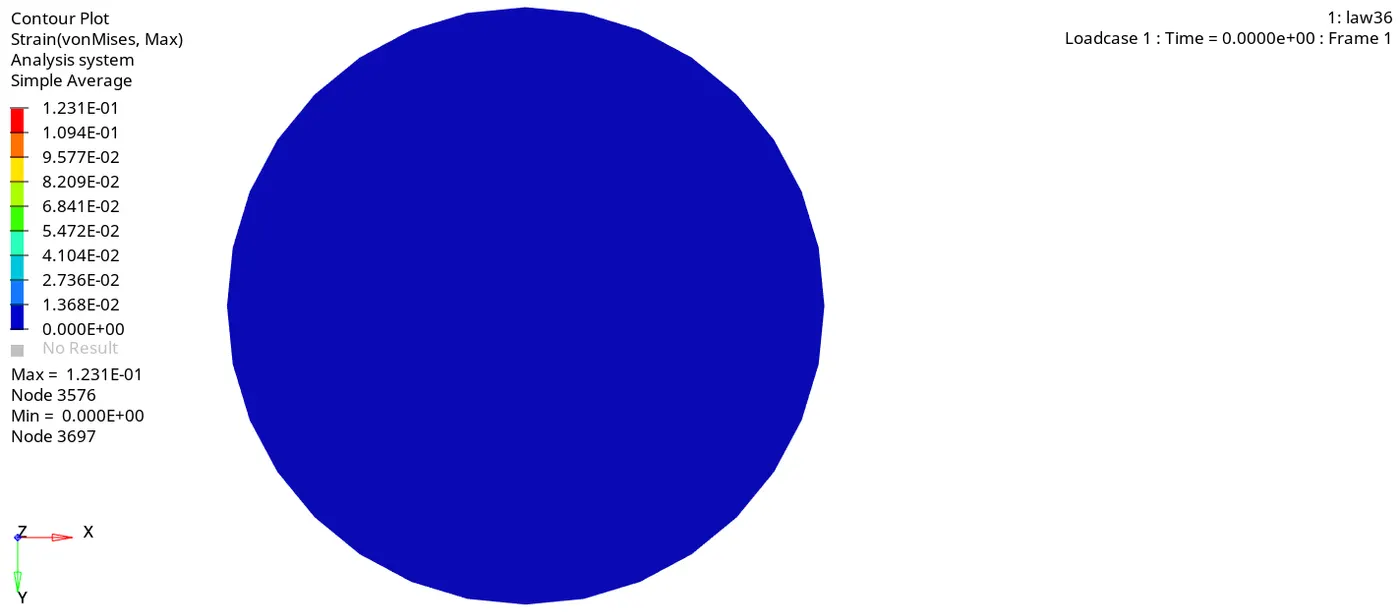
Fig.28 Strain variation in case 7
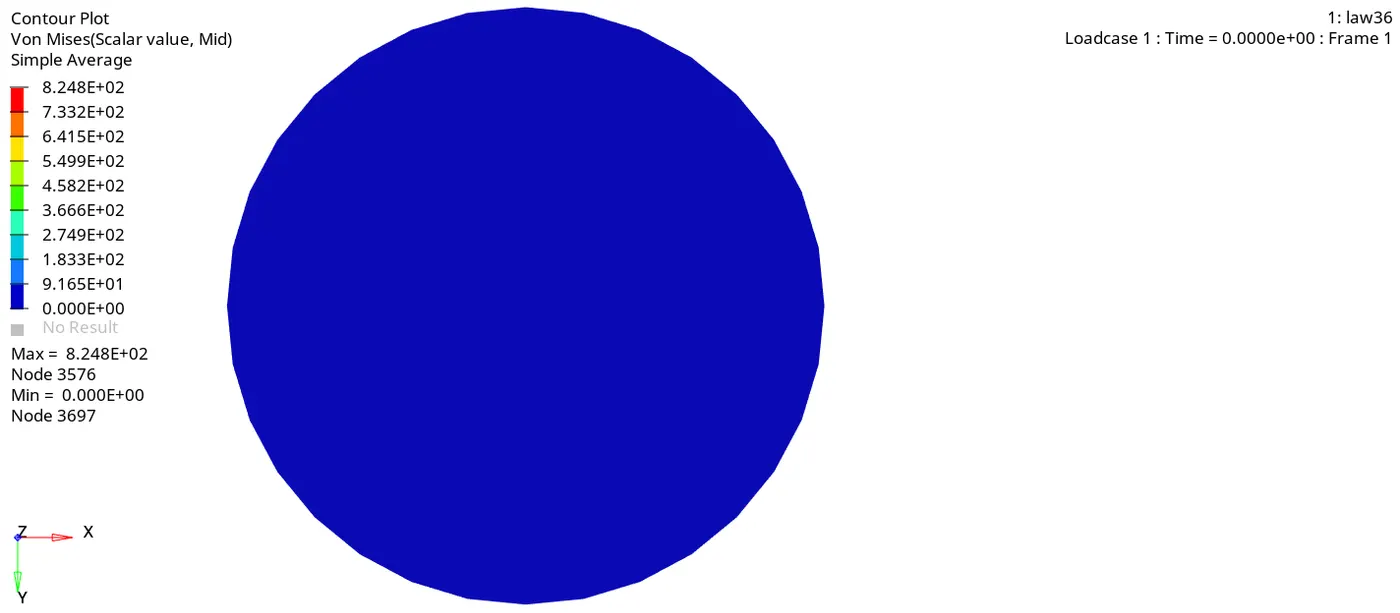
Fig.29 Von Mises stress variation in case 7
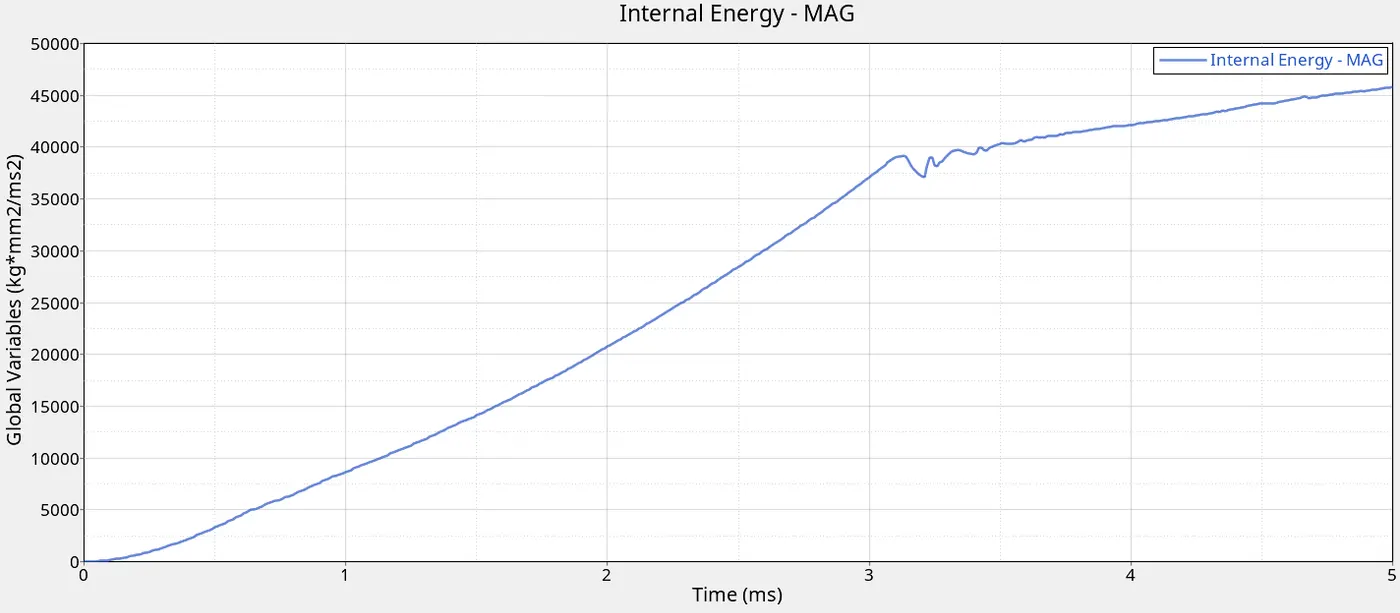
Fig.30 Internal energy vs Time in case 7
COMPARISON OF RESULTS:
The important parameters obtained from the seven cases are tabulated below:
|
Parameters |
Case 1 |
Case 2 |
Case 3 |
Case 4 |
Case 5 |
Case 6 |
Case 7 |
|
Elapsed time (s) |
92.38 |
100.77 |
100.75 |
98.12 |
95.84 |
110.30 |
105.77 |
|
Energy error |
1.3% |
5.9% |
1.2% |
3.0% |
4.0% |
1.1% |
-1.3% |
|
Maximum Internal Energy (J) |
27500 |
30500 |
27000 |
65000 |
875000 |
28000 |
46000 |
|
Maximum displacement (mm) |
15.86 |
11.27 |
19.32 |
5.011 |
4.999 |
16.69 |
48.68 |
|
Maximum strain |
0.1404 |
0.1426 |
0.1358 |
0.3237 |
0.201 |
0.1607 |
0.0922 |
|
Maximum von mises stress (MPa) |
275.2 |
295.1 |
270.7 |
424.7 |
1089 |
287.5 |
824.8 |
When observing the internal energy graphs, they are usually increasing linearly and then reach a plateau. The exception is in case where it was a parabolic curve with no plateau being seen. This is most likely the result of using Law 1 material which is elastic in nature and does not go to plastic region. Therefore the material is absorbing all the energy internally which is not realistic in case of Aluminium. Therefore, case 5 is unrealistic and should not be used to analyse the material simulations.
In terms of realistic simulation, case 7 is the most realistic because the strain curves can be given using experimental data and hence the simulation achieved is more realistic.
CONCLUSION: The seven cases were successfully simulated according to the given parameters. The graph of energy was plotted versus time and the .gif files of the displacement, strain and von mises stress variations were obtained. The important parameters of the cases were tabulated and compared.