Study of different material laws on Radioss by Impact testing
Comparing the results of Different Material Properties
Objective
i. Study the various Material Models and their Parameters
ii. Change the Material properties as per each case.
iii. Run the Simulation for the 7 cases
iv. Compare the Results
| Law | Material | Behaviour |
| 1 | Elastic | Follows Hook's Law through out the stress strain curve |
| 2 |
Johnson Cook (Isotropic elasto Plastic) |
Material stress is a function of Plastic strain, strain rate and Temperature. |
| 27 | Brittle Plastic | Von Mises hardening with Brittle Damage. Failure occurs only in Tension. |
| 36 |
Piecewise Linear material (Isotropic elasto Plastic) |
Work Hardening in the Stress-Strain Curve is defined by the user defined function |
Procedure
Step 1: Import the starter file
Import > Solver Deck > FIRST_RUN_0000.rad (select) > Import
i. The starter file is in ASCII (American Standard Code for Information Interchange) format and contains model information such as:
a. Nodes
b. Load Conditions
c. Velocity
d. Boundary Conditions, etc.
[Note: The starter file should always end with 0000.rad. After changing the parameters (Eg. Velocity) and running the next simulation, the file becomes FIRST_NAME_0001.rad and so on.]
Step 2: Edit the Engine File and run the simulation
2.1 Edit the Engine File
Model Browser > Control Cards > Select and Edit
i. The engine File is in ASCII (American Standard Code for Information Interchange) format and stores Run control data such as Time History and Animation frequency, etc.
ii. We can edit the Engine file from the Control cards itself.
2.2 Conduct the Analysis
Analysis > Radioss > Input File : (File Location) > Hit Radioss
i. The input file is the same Started file (contains model information) that we had just imported.
ii. The animation video along with the frames will be saved in the same folder where the starter file exists.
2.3 Review the Simulation
We have to import the animation file in Hyperview first:
Hyperview > Load File > FIRST_RUN. h3d > Apply
i. The tools to review the simulation are available on Hyperview.
ii. Hyperview is a post processing and visualization environment for FEA that gives the output of the analysis in a simulations format that is user friendly to understand.
iii. From the simulation, we can review how the impact force acts and causes deformtions and point of rupture on the model.
| Case No. | Current Law # | Change to Law # | Changes in the Material Parameters | Description | Simulation |
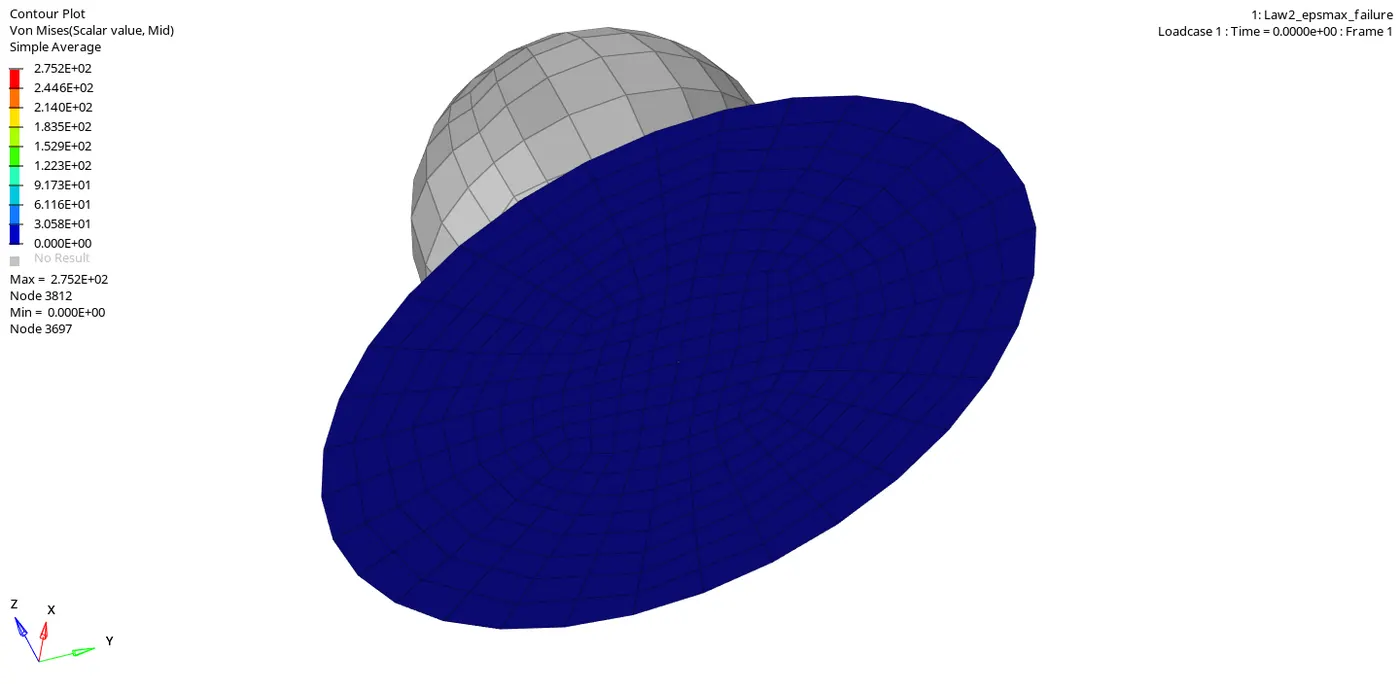
| 1 | Law 2 | Not applicable |
EPSmax & `sigmamax` are the failure criterias. They are Ultimate Stress and Strain values from the the Stress starin curve. |
 |
|
| 2 | Law 2 |
Change the failure parameters in Johnson Failure Card: Ifail_sh = 1 Dadv = 1 Ixfem = 1 |
D1, D2 & D3 (from Starin rate data) are the failure criterias. | 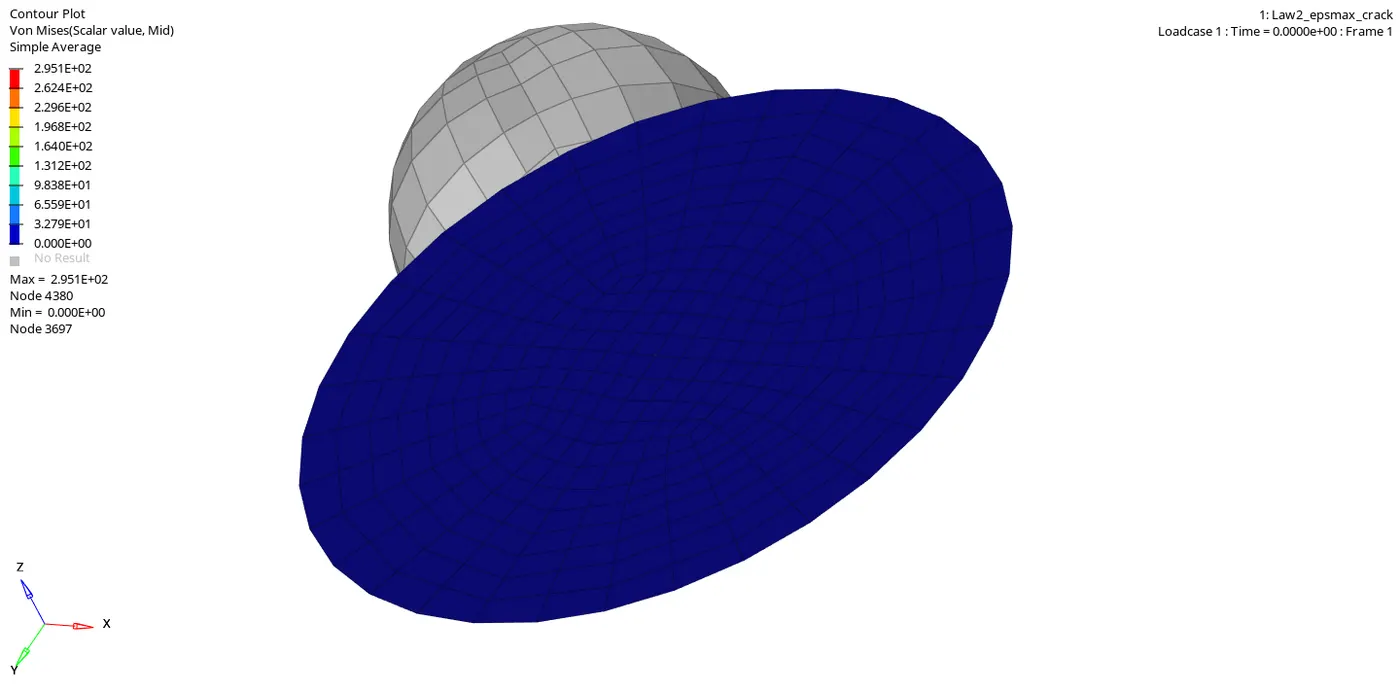 |
|
| 3 | Law 2 | Delete the /Fail/JOHNSON Material Card | Failure criterias | 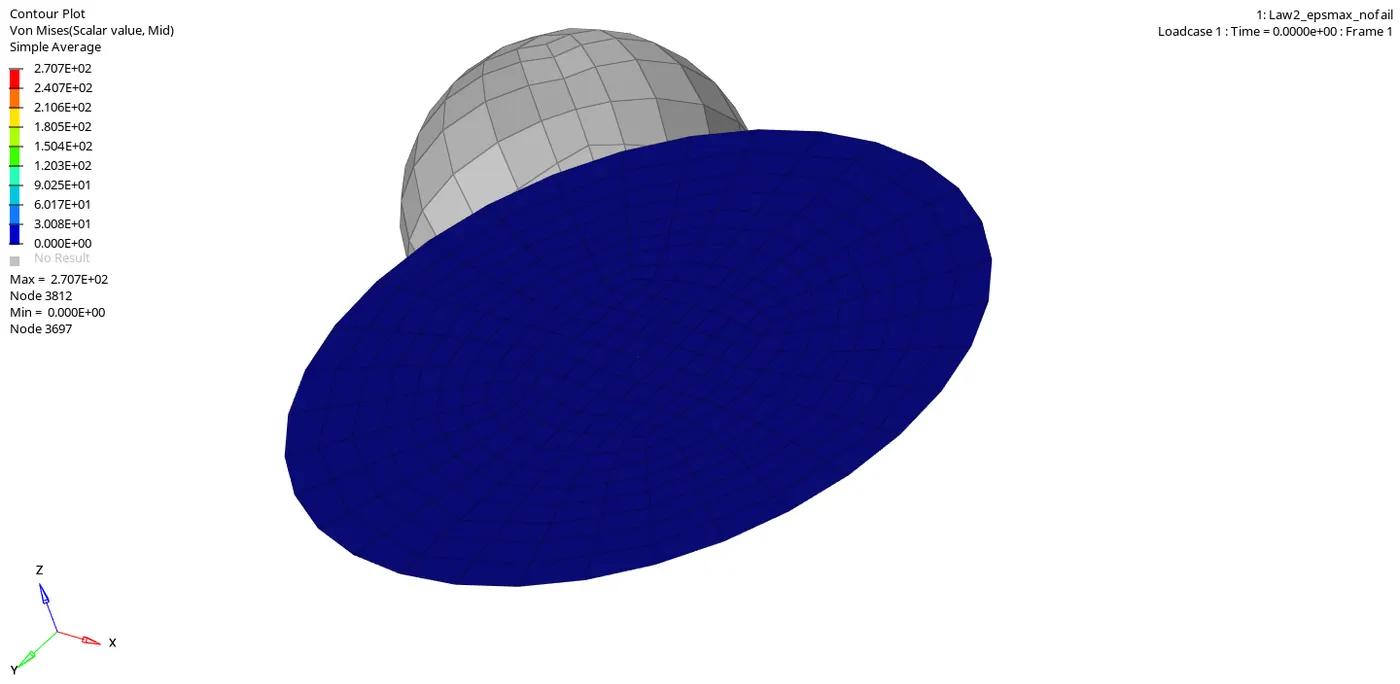 |
|
| 4 | Law 2 | Delete EPS_p_max | When EPS_p_max is set to zero, we get Infinite Strain. Simulation will stop element reaches `sigmamax` | 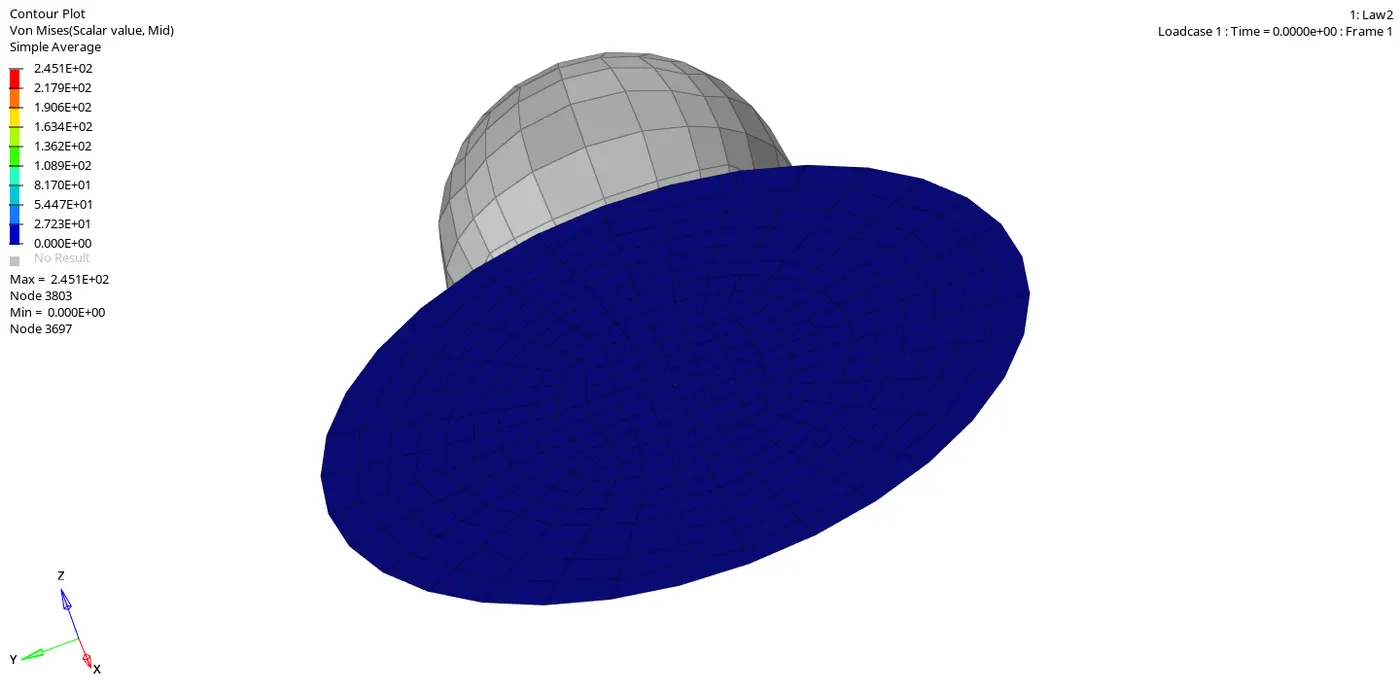 |
|
| 5 | Law 2 | Law 1 | Keep the Density, Young's Modulus, and Poisson's ratio same as that in Law 2 material card | Material is completely Elastic, i.e. Infinite strain rate. There are no Failure criterias, therefore the elements won't fail. | 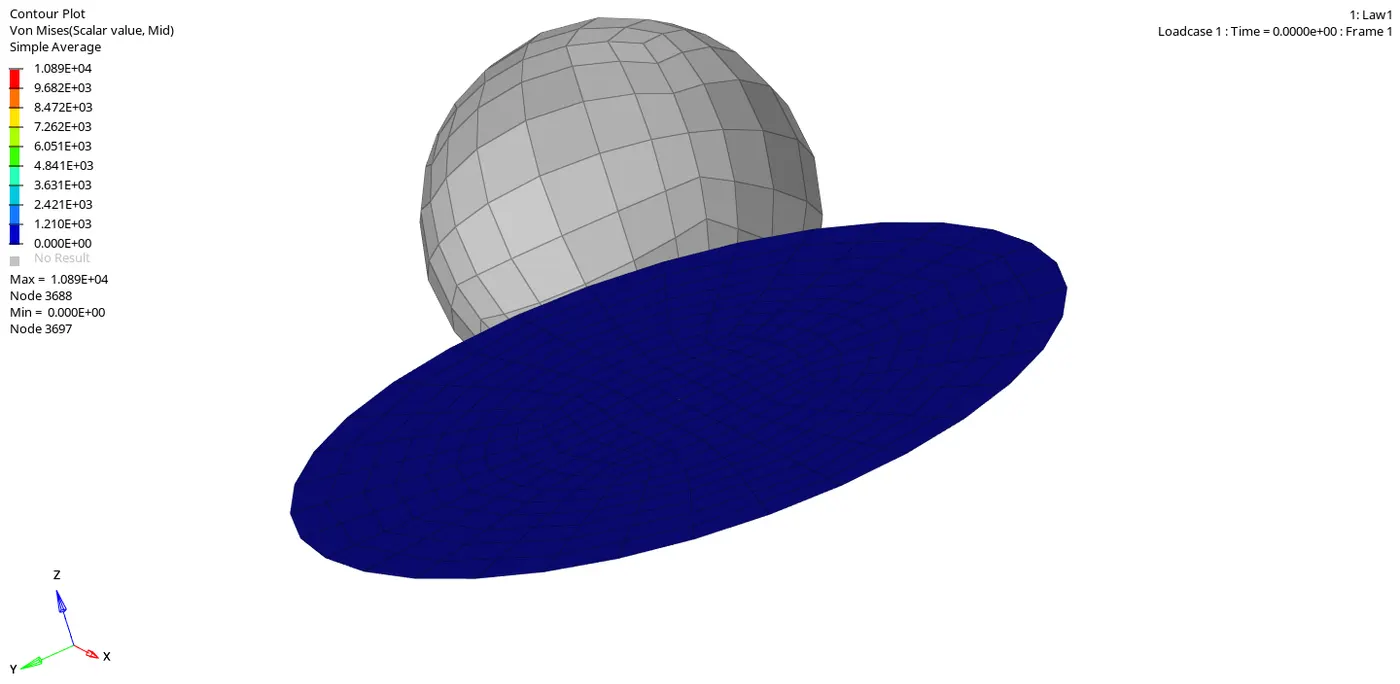 |
| 6 | Law 36 |
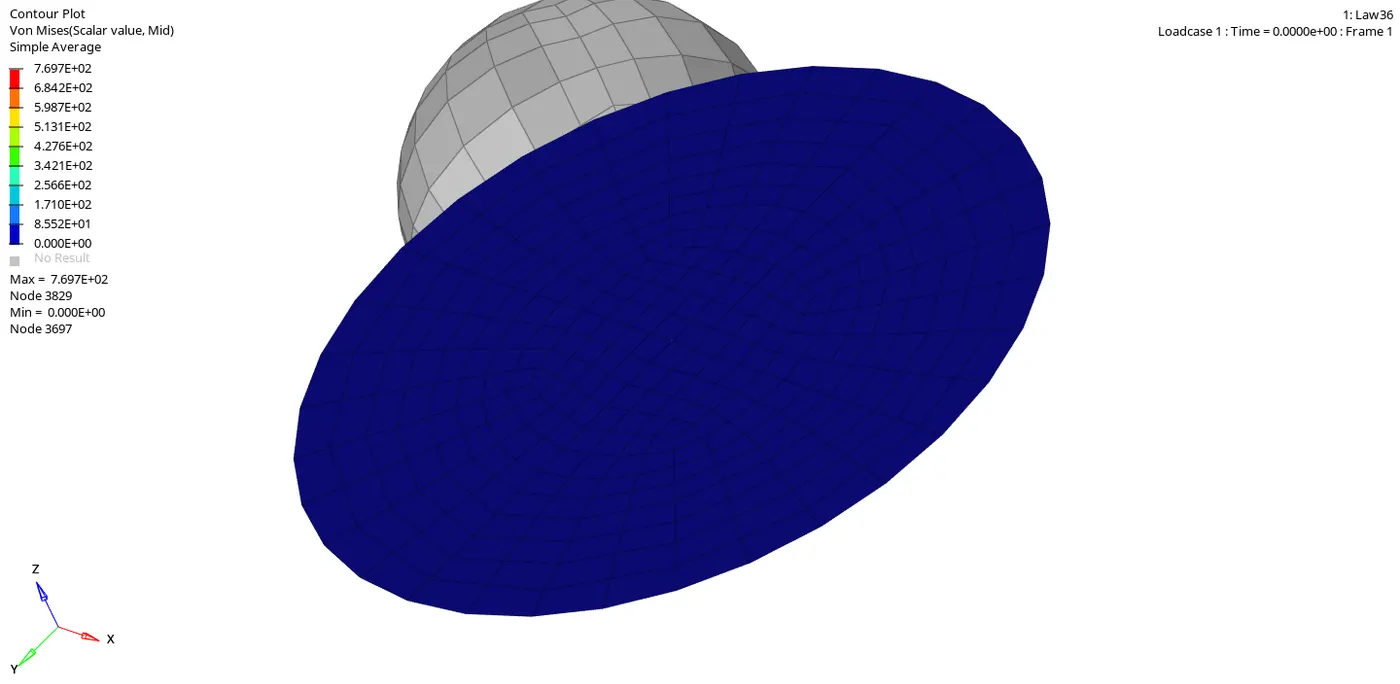
The elastic region is defined by Density, Young's Modulus, and Poissons's Ratio. The plastic region is defined by the rupture parameters. |
The Rupture parameters are : EPS_t : Strain at the beginning of Tensile Damage EPS_m : Strain at the end of Tensile Damage Epsilon_F : Tensile Failure Strain [The above are rupture parameters for Torsion only] EPS_p_max : Plastic Failure Strain [The last one is a combined failure] |
 |
|
| 7 | Law 27 |
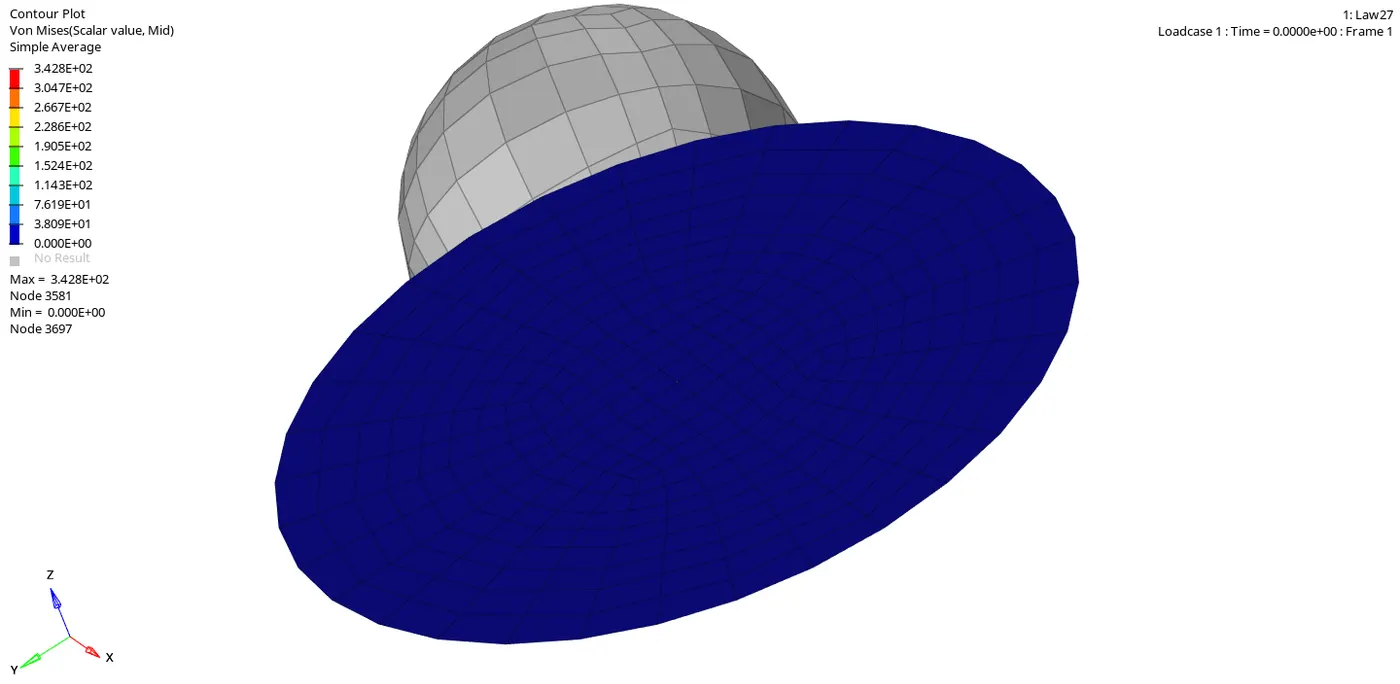
The failure parameters are: et: strain at the beginning of Tensile Failure em: Maximum Tensile strain dmax: Maximum Damage factor ef: Max. Tensile strain for Element deletion |
 |
Step 5: Plot of the Graphs
i. The tools to plot the graph are available on Hypergraph.
Hypergrapgh 2D > Data File > FIRST_RUNT01 > Apply
ii. Hypergraph is a data analysis and plotting tool that represents the FEA from the simulation in graphs with respect to the selected unit system.
Step 4: Check the Results
i. A starter Output file of .out format is generated after analysis.
ii. The Output file contains the data during simulation, such as Cycle, Timestep, Energies, and Errors.
iii. We have to check for energy and Mass error.
iv. The Simulation tells only half the picture, we have to study the various energies acting on the system.
Note: There are some rules to be followed.
a. The error must be Negative and decreasing.
b. It is normal if the error slightly increases and then increases.
c. There is a problem if the error only increases, it will reach 99.9% showing computational failure.
d. The Range for acceptable error is -15% to +5%.
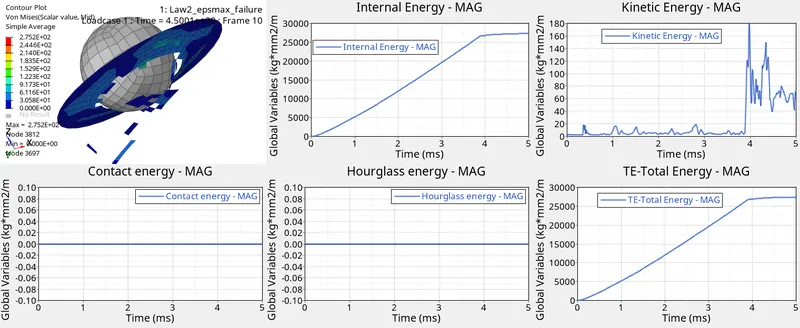
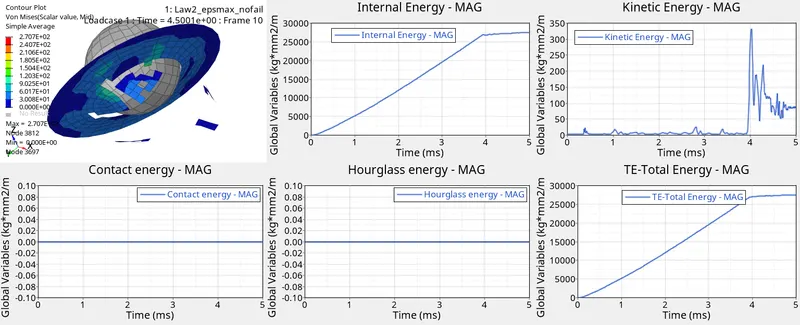
Case 1: Law 2 without any change
| Energy | Statement |
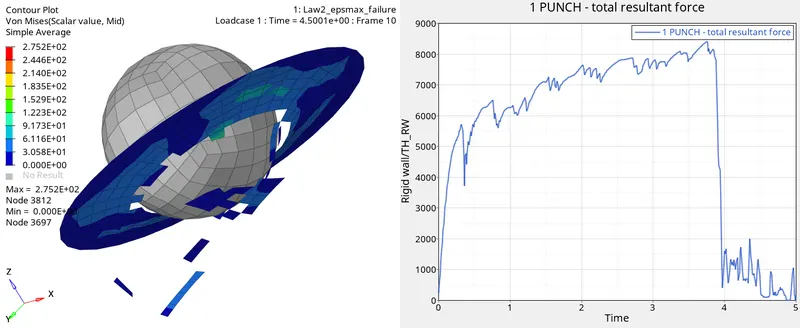
| RigidWall | After reaching Ultimate stress, the element is deleted and hence we see a dip in the stress strain curve. |
| Internal Energy | Internal energy (Strain energy due to deformation) increases lineraly up to plastic failure and remains almost constant afterwards. |
| Kinetic energy | Sudden spike during the failure indicating the rate of deformation (displacement subjected to a velocity). |
| Contact Energy | There are no contact forces between the components. |
| Hourglass Energy | Hourglass is taken care of and won't cause Energy error. |
| Total Energy | The Total energy Curve is almost similar to the Internal energy (Kinetic Energy is very small) indicating no Energy Error. |
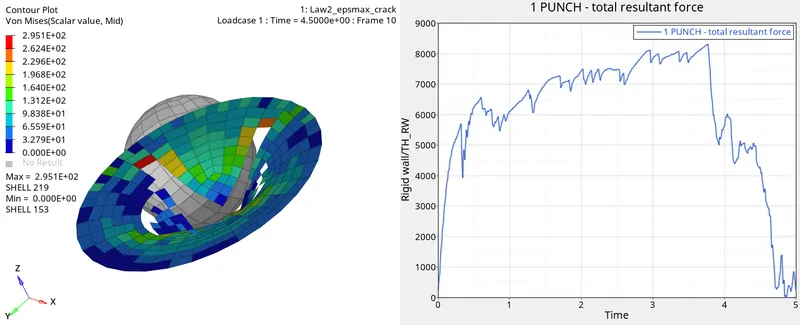
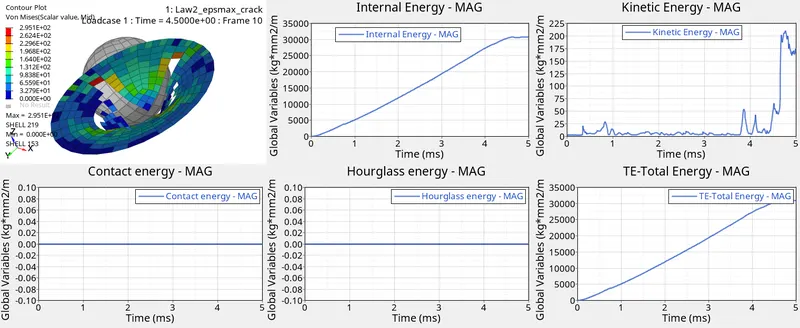
Case 2: Law 2 with change in Johnson Failure Card
| Energy | Statement |
| RigidWall | The solver used Dadv = 1 to initiate cracking once it reaches Uktimate stress, the drop after plastic failure is gradual as the elements are cracked and not deleted. |
| Internal Energy | Internal energy (Strain energy due to deformation) increases lineraly up to plastic failure and remains almost constant afterwards. |
| Kinetic energy | Increases rapidly (but not spiking like in case 1). The rate of deformation is controlled by the Johnson Failure parameters. |
| Contact Energy | There are no contact forces between the components. |
| Hourglass Energy | Hourglass is taken care of and won't cause Energy error. |
| Total Energy | The Total energy Curve is almost similar to the Internal energy (Kinetic Energy is very small) indicating no Energy Error. |
Case 3: Law 2 without Johnson Failure Card
| Energy | Statement |
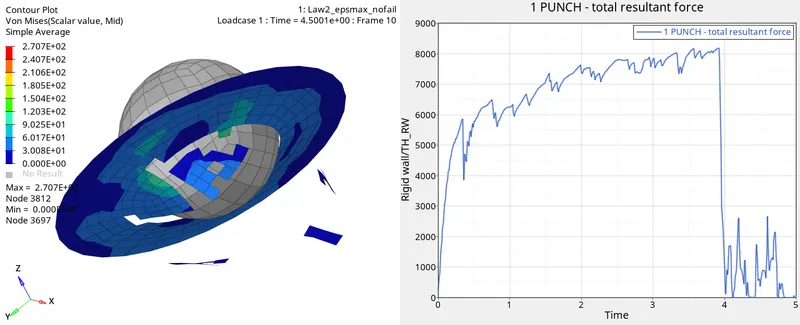
| RigidWall | There is no Failure criteria, if any Integration Point reaches Maximum plastic strain, element will fail and we see the sudden dip. Element could've Dissapeared/Broken/Torn into pieces. |
| Internal Energy | Internal energy (Strain energy due to deformation) increases lineraly up to plastic failure and remains almost constant afterwards. |
| Kinetic energy | As there is no failure criteria, maximum deformation occurs (displacement subjected to a velocity) leading to a spike during the failure. |
| Contact Energy | There are no contact forces between the components. |
| Hourglass Energy | Hourglass is taken care of and won't cause Energy error. |
| Total Energy | The Total energy Curve is almost similar to the Internal energy (Kinetic Energy is very small) indicating no Energy Error. |
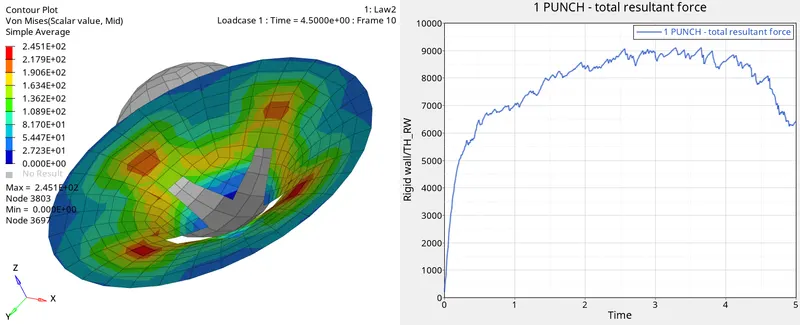
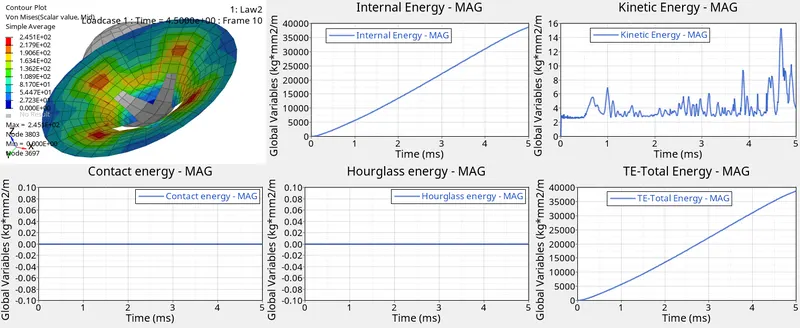
Case 4: Law 2 with Default Ultimate Stress
| Energy | Statement |
| RigidWall | Due to Infinite strain, bending occurs beyond the Ultimate plastic strain. As the element reaches the default maximum failure (10 KN) , the element begins to crack. |
| Internal Energy | The Strain energy continues to increase at the same rate even after cracking is initiated. This result is undesirable and no material possess infinite strain rate. |
| Kinetic energy | The element is bending at a very low rate so the Kinetic energy produced on the element is also less due to slow rate of deformation (displacement subjected to a velocity). |
| Contact Energy | There are no contact forces between the components. |
| Hourglass Energy | Hourglass is taken care of and won't cause Energy error. |
| Total Energy | The Total energy Curve is almost similar to the Internal energy (Kinetic Energy is very small) indicating no Energy Error. |
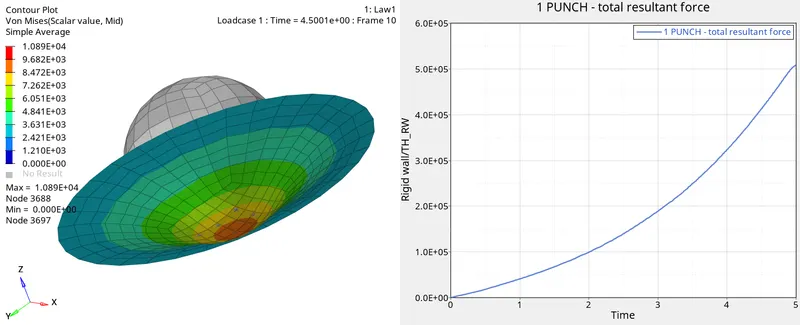
Case 5: Law 1
| Energy | Statement |
| RigidWall | Pure Bending occurs as it is a purely elastic material. The element doesn't get cracked/deleted. |
| Internal Energy | Internal energy (Strain energy due to deformation) increases only linearly as it has an infinite elastic limit. (Only elasticity, no plasticity). |
| Kinetic energy | Kinetic energy almost remains constant, but increases during maximum deformation. |
| Contact Energy | There are no contact forces between the components. |
| Hourglass Energy | Hourglass is taken care of and won't cause Energy error. |
| Total Energy | The Total energy Curve is almost similar to the Internal energy (Kinetic Energy is very small) indicating no Energy Error. |
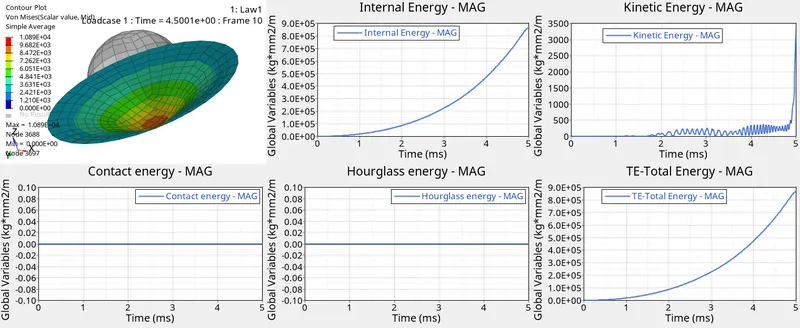
Case 6: Law 36
| Energy | Statement |
| RigidWall | The element gets ruptured once it reaches Failure Tensile strain (maximum deformation). Stress reduction happens till `sigma underset m`but after that point strain is still accumalated till `epsilon underset f` and then element gets deleted. |
| Internal Energy | Internal energy (Strain energy due to deformation) increases lineraly up to plastic failure and further increases slowly (due to D1, D2, D3) until the element is deleted. |
| Kinetic energy | Rise in Kinetic energy at two points. First at Rupture (`epsilon underset t`) and then `epsilon underset m` . |
| Contact Energy | There are no contact forces between the components. |
| Hourglass Energy | Hourglass is taken care of and won't cause Energy error. |
| Total Energy | The Total energy Curve is almost similar to the Internal energy (Kinetic Energy is very small) indicating no Energy Error. |
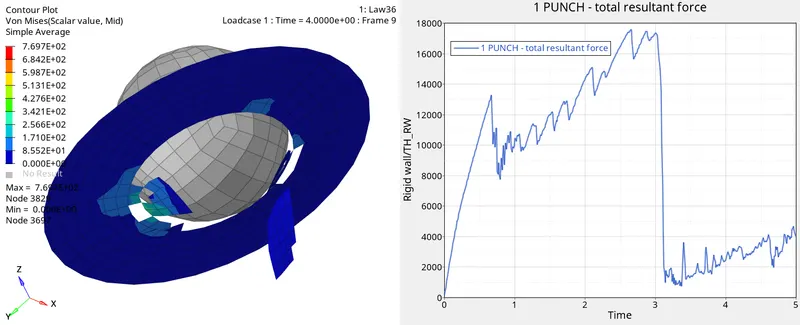
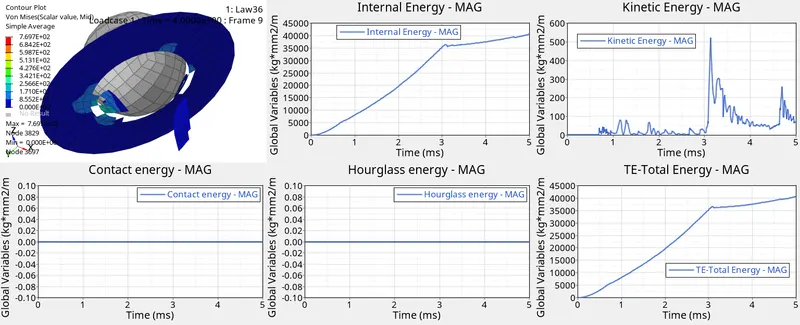
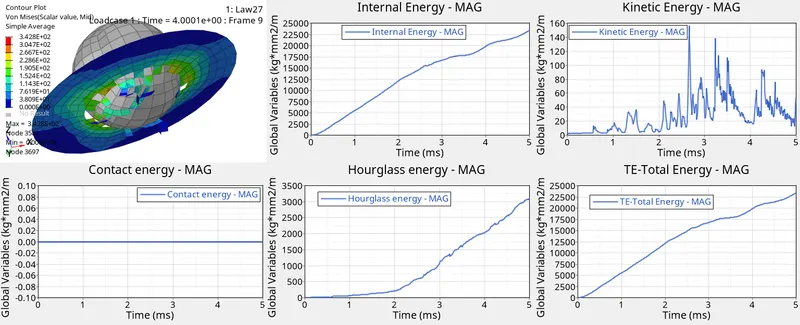
Case 7: Law 27
| Energy | Statement |
| RigidWall | Plastic region is very narrow for Brittle materials and the element fails quickly due to very low strain rate. The failure is due to Maximum Tensile strain and the element gets deleted. |
| Internal Energy | Since Brittle, the strength is very high leading to a higher yield point. |
| Kinetic energy | At different stages of penetration on the plate, the elements are failing quickly and there are many spikes in the energy curve caused by the deformation (displacement subjected to a velocity). |
| Contact Energy | There are no contact forces between the components. |
| Hourglass Energy | Hourglass is increasing which might cause some energy error. |
| Total Energy | The Total energy Curve is almost similar to the Internal energy (Kinetic Energy is very small). |
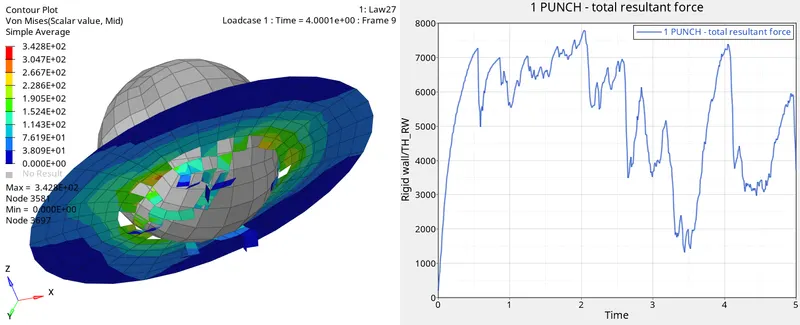
Conclusion
Based on the stress and strain conditions given, Law 36 is more suitable as it follows the results of real time testing and shows the behaviour of a real world material (elasticity and plasticity).
We input the lab data as User defined functions and alter the work hardening portion of the stress strain curve to match the lab results.
The image below is the Damage and Rupture parameters that the solver follows during work hardening in Law 36 material model:
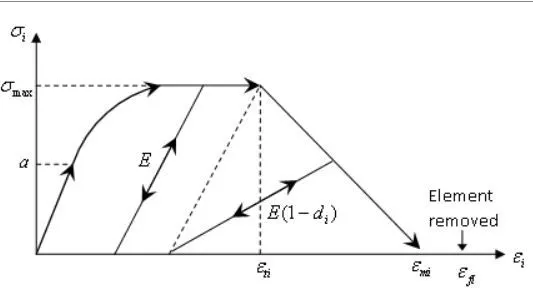
E = Young's Modulus
`sigma underset max`= ultimate stress at Tensile failure
`epsilon underset max`= Plastic Strain at Tensile Failure
`epsilon underset m`= Stress reduction till this point
`epsilon underset f`= Failure Plastic Strain (element is removed here)
Learning outcome
I learnt:
i. The different Material cards and their behaviour.
ii. The failure criterias for different material cards.
iii. Studing how Crack is developed from the material cards.
iv. Damage and Rupture parameters in Law 36 Model.