Assignment 4
Objective: Setting up simulation with different parameters and therreafter comparing the plots and results
Running the simulation
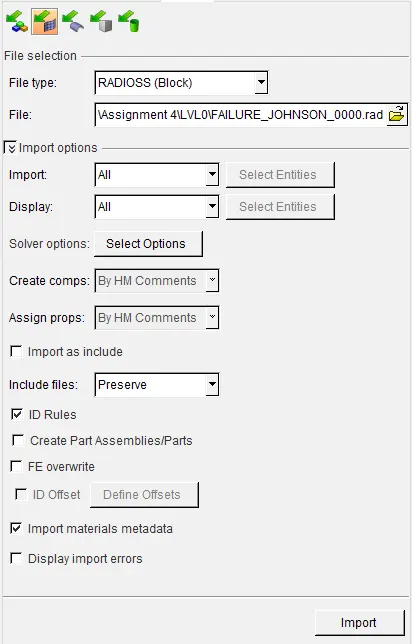
Step 1: Import the solver deck in Hypermesh from the import tab
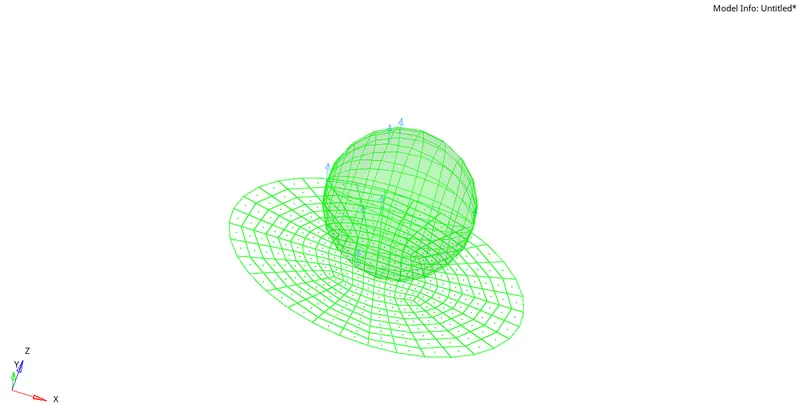
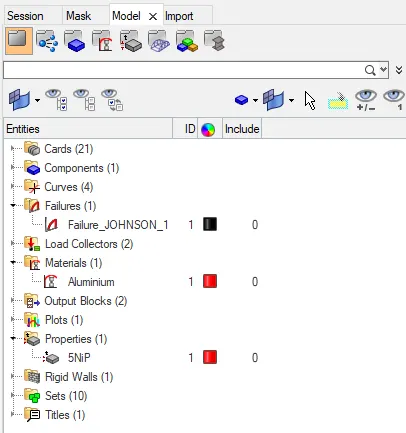
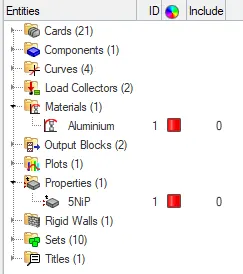
Step 2: Once the import is complete, go to model browser and there you can change material,property, failure card, etc
Step 3: Once the necessary changes are made in the model browser, go to Analysis> Radioss
Select Export option : All
Run Option : Analysis
Run Number : 1
Options : -nt 8
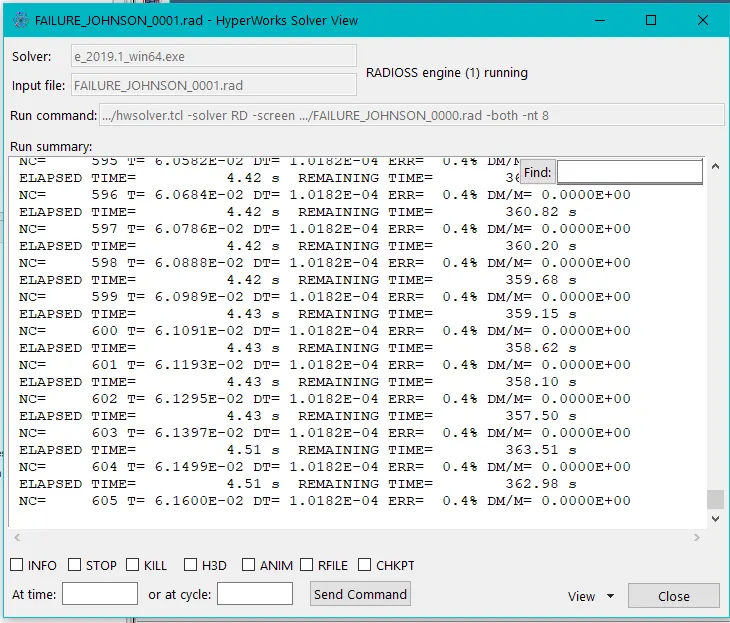
Choose a specific folder to write simulation file there and hit radioss button, Solver window will open and will solve the problem

Case 1:
Failure Model : FAIL/JOHNSON
Material Card : M2_ PLAS_JOHNS_ZERIL
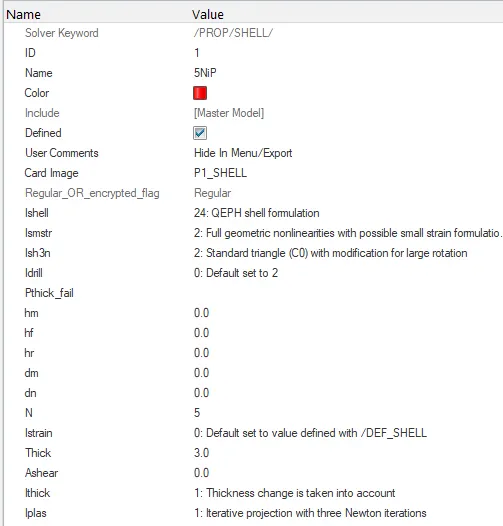
Property Card : P1_Shell
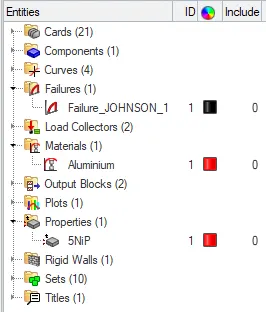
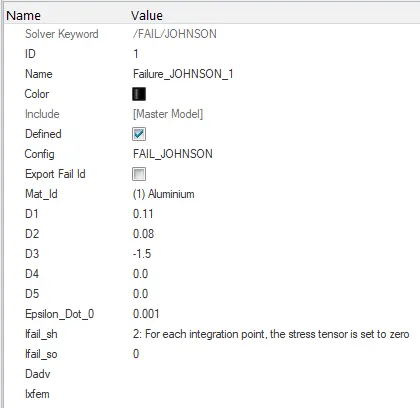
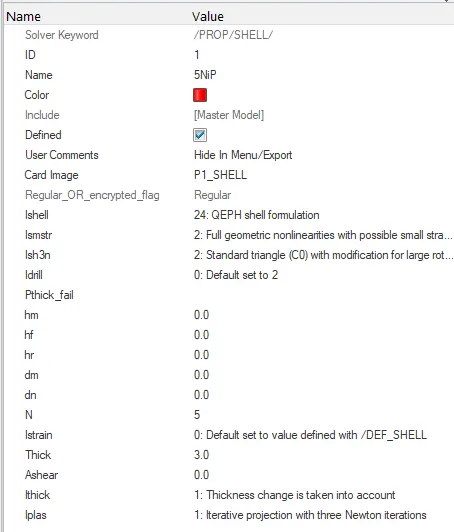
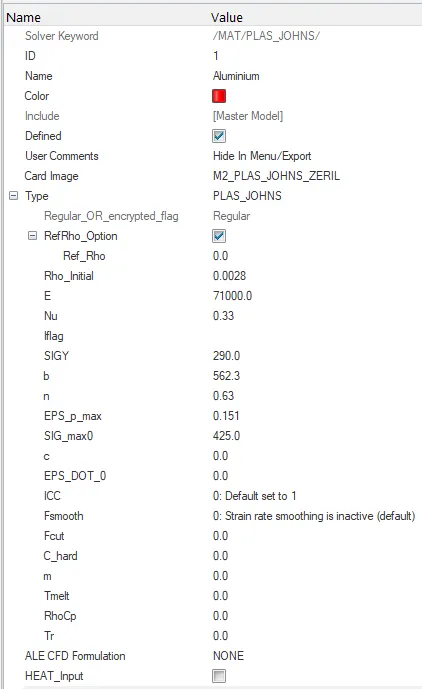
Sneaking into FAILURE_JOHNSON_0001.out file to view Energy and mass error

Energy Error : 0.8%
Mass Error : 0%
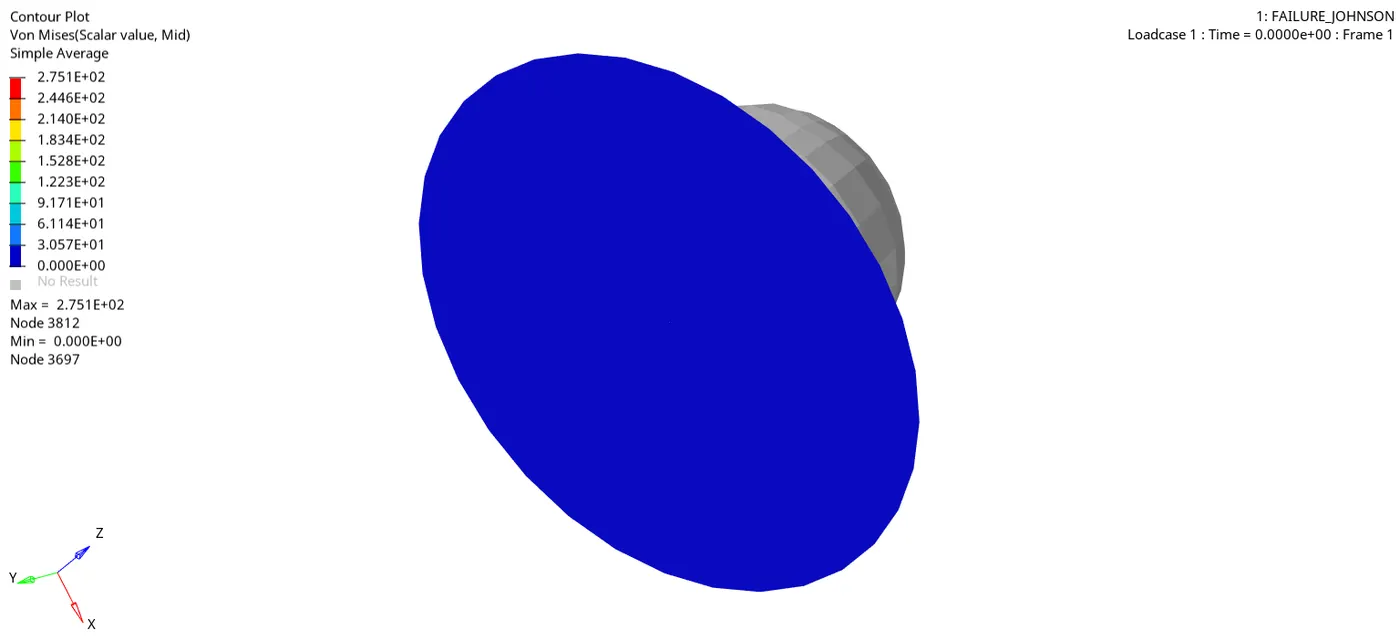
Vonmises stresses animation
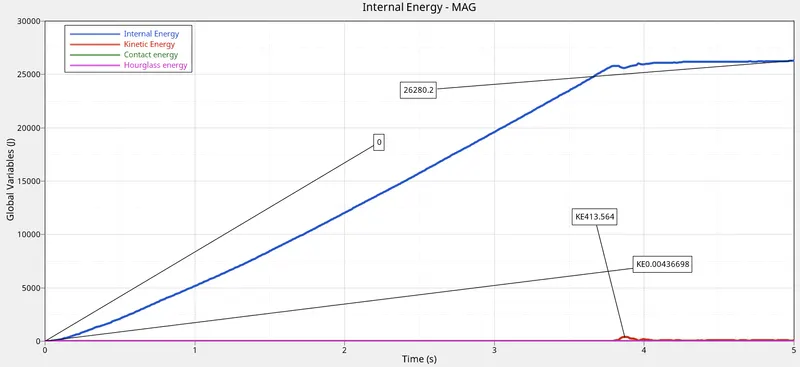
Internla Energy, Kinetic Energy, Contact Energy, Hourglass Energy vs Time
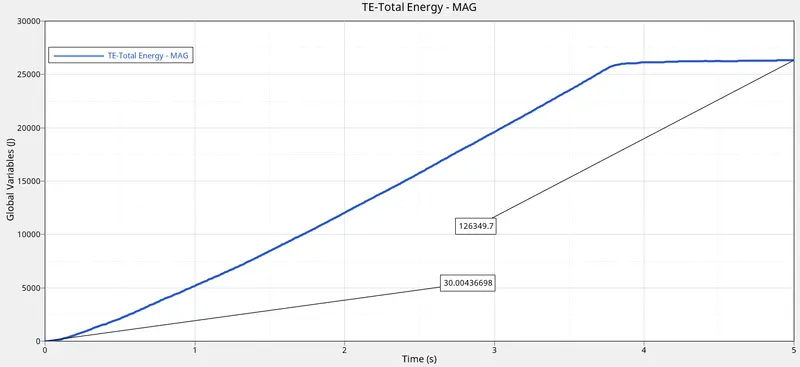
Total Energy vs time
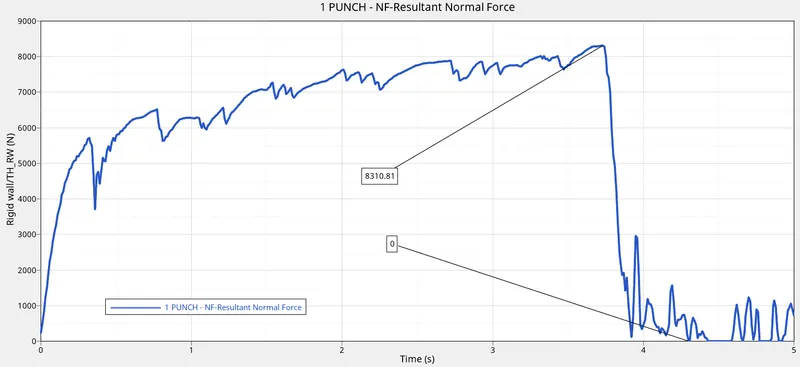
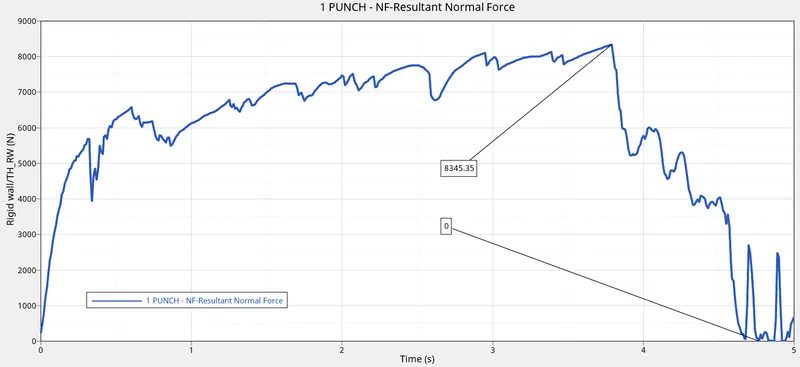
Rigid wall forces vs time
Combined plots
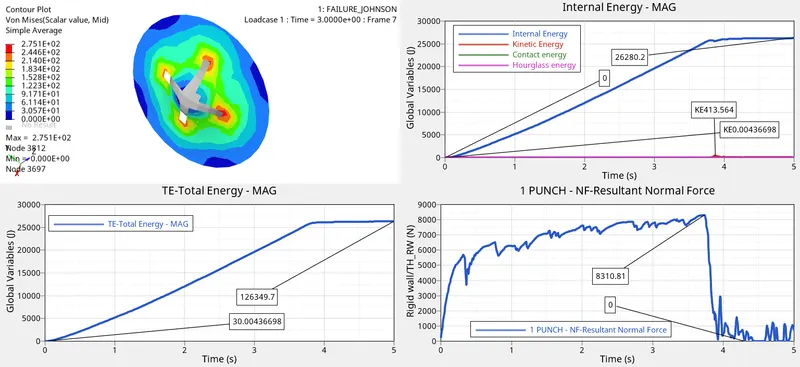
Results:
M2_PLAS_JOHNS_ZERIL: This law represents an isotropic elasto-plastic material using the Johnson-Cook material model. This model expresses material stress as a function of strain, strain rate and temperature. In this model the material behaves as a linear-elastic material when the equivalent stress is lower than the plastic yield stress, for higher stress values, the material behavior is plastic.
FAIL/JOHNSON card is used which describes the failure criteria by Johnson-Cook failure model.
Her Ixfem is no set which is 0 as default, hence the element will be deleted if they reaches the failure criteria
Case 2:
Failure Model : FAIL/JOHNSON
Material Card : M2_ PLAS_JOHNS_ZERIL
Property Card : P1_Shell
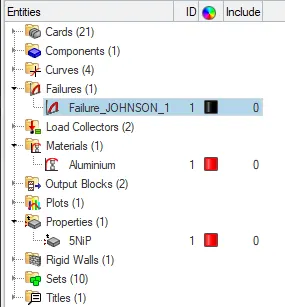
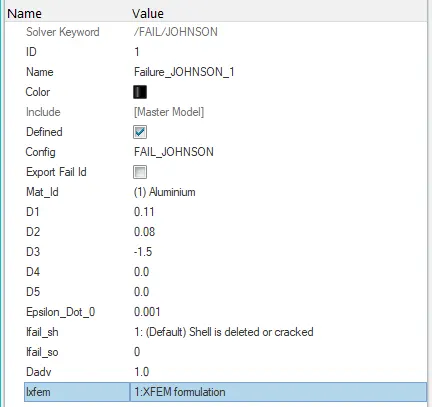
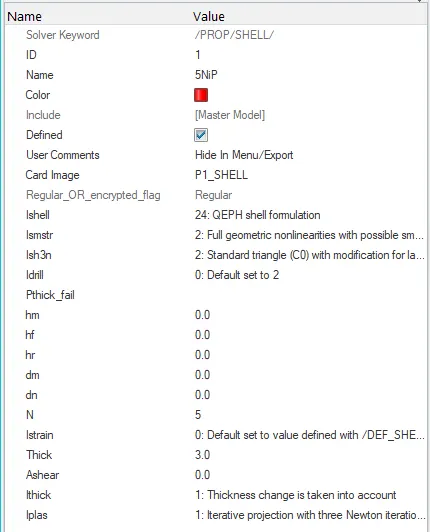
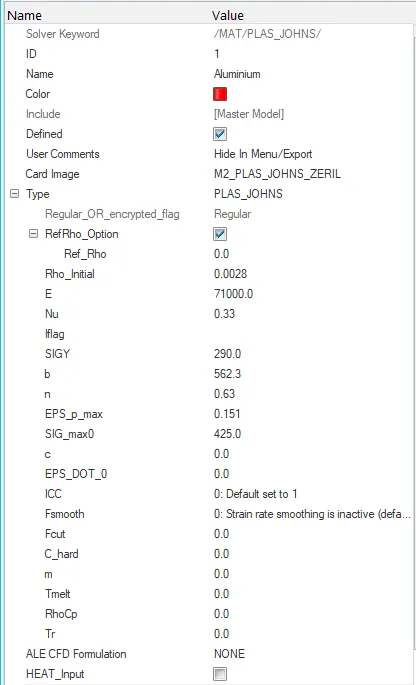
Sneaking into FAILURE_JOHNSON_0001.out file to view Energy and mass error

Energy Error : 3.7%
Mass Error : 0%
Vonmises stresses animation
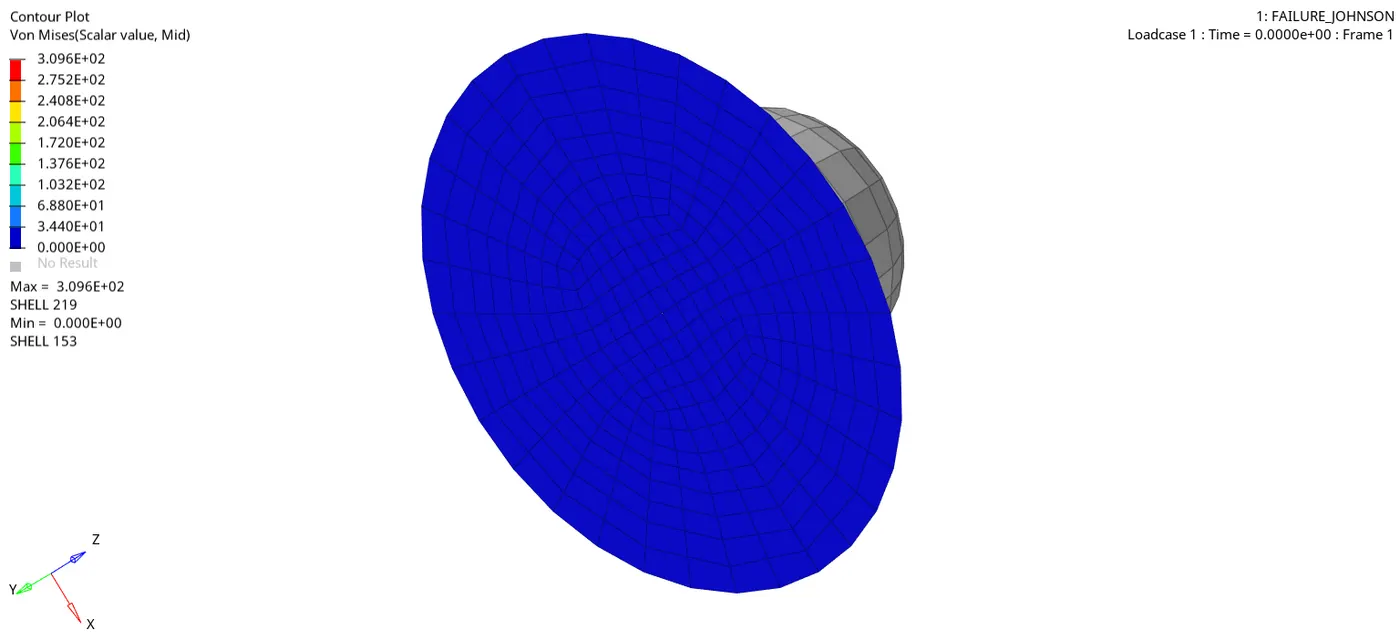
Internla Energy, Kinetic Energy, Contact Energy, Hourglass Energy vs Time
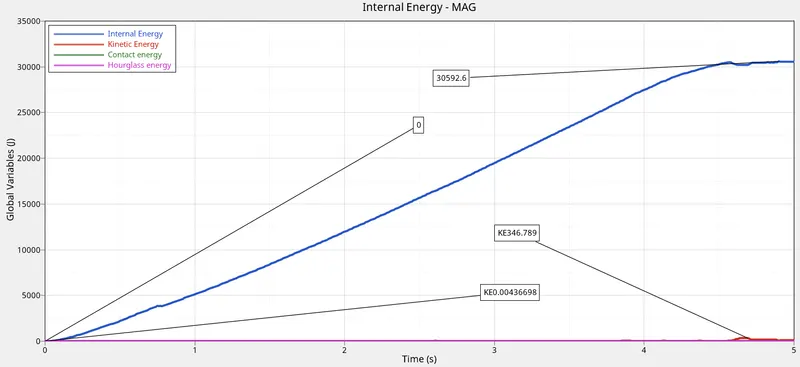
Total Energy vs time
Rigid wall forces vs time
Combined plots
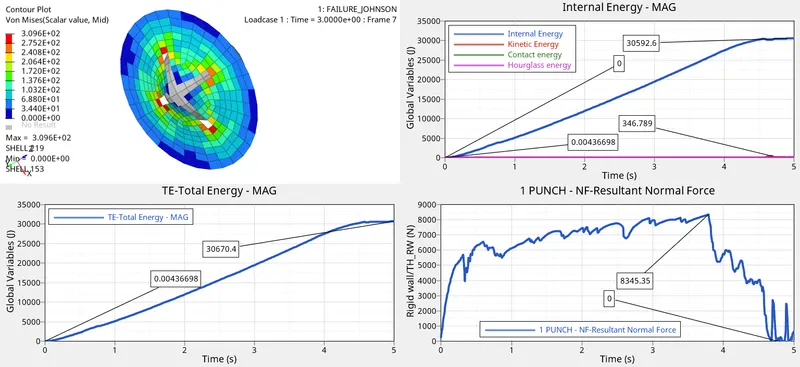
Results: Here is case is same as the Case 1, Ixfem is change to 1 which changes the elements to crack once they reaches the failure criteria, hence the elements were cracked open as visualised in the animation
Case 3:
Failure Model : ---
Material Card : M2_ PLAS_JOHNS_ZERIL
Property Card : P1_Shell
Sneaking into FAILURE_JOHNSON_0001.out file to view Energy and mass error

Energy Error : 0.8%
Mass Error : 0%
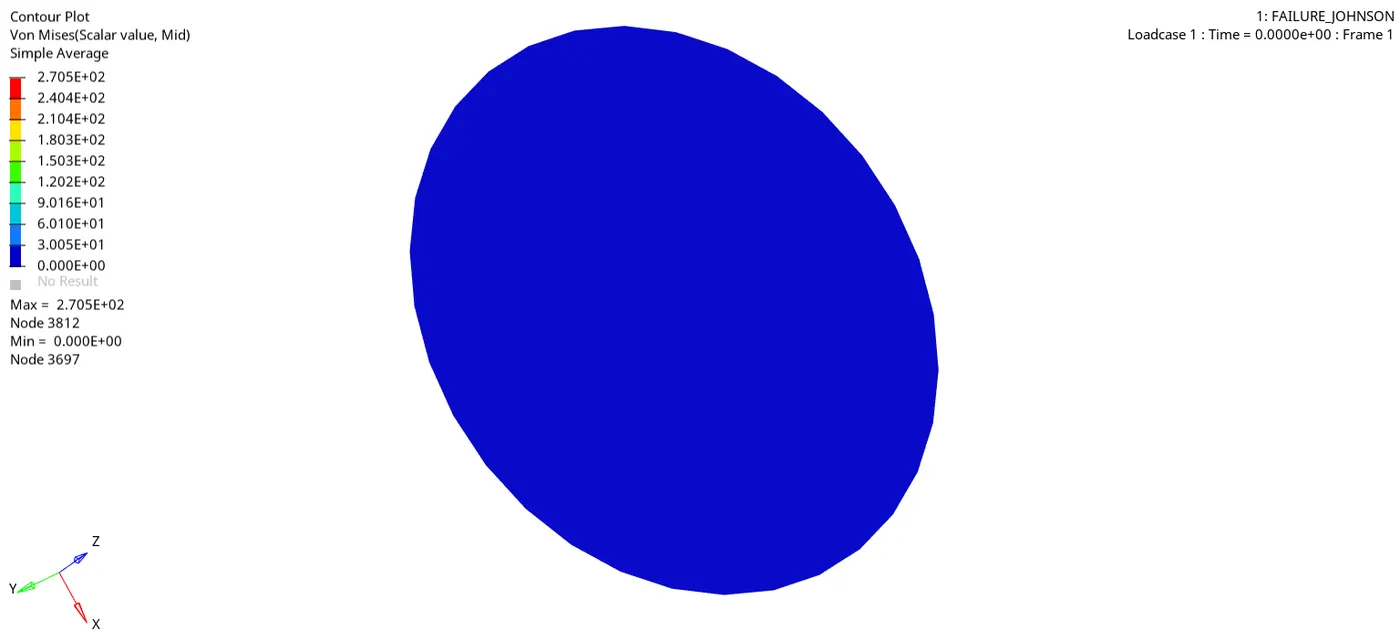
Vonmises stresses animation
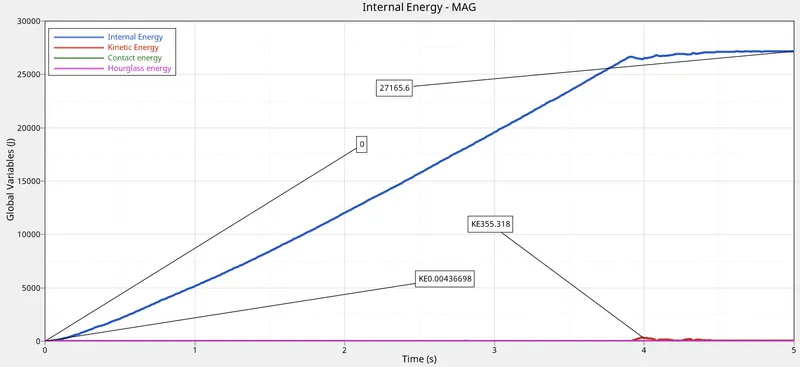
Internla Energy, Kinetic Energy, Contact Energy, Hourglass Energy vs Time
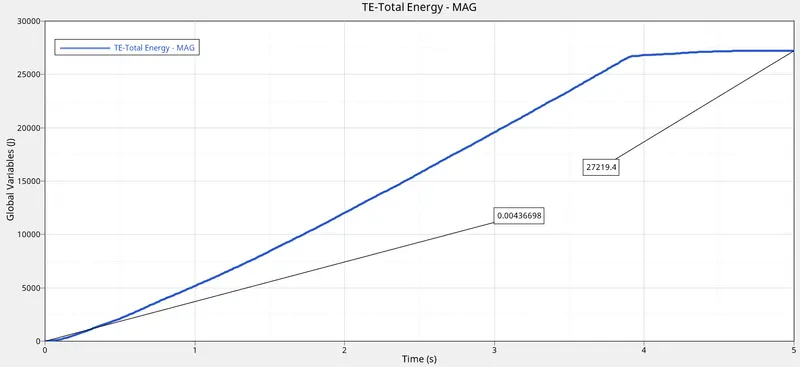
Total Energy vs time
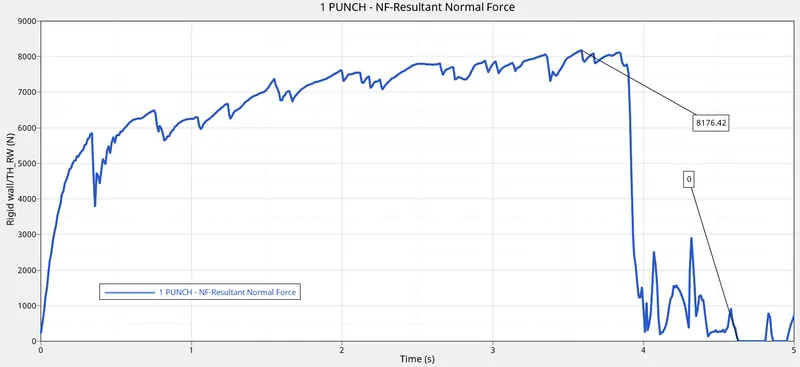
Rigid wall forces vs time
Combined plots
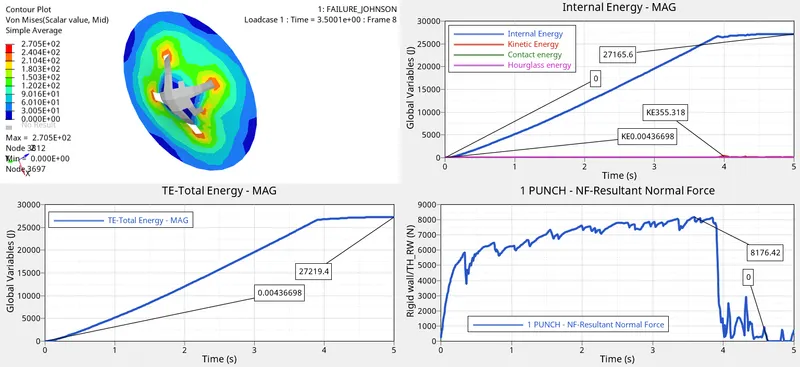
Results:
In this the failure the elements got deleted when the after overcoming the threshold of maximum plastic strain.It was also observed that in thi case the values of Vonmises stress, total Energy and the R-Wall Forces were minimum as compaed to rest on the analysis results
Case 4:
Failure Model : ---
Material Card : M2_ PLAS_JOHNS_ZERIL
Property Card : P1_Shell
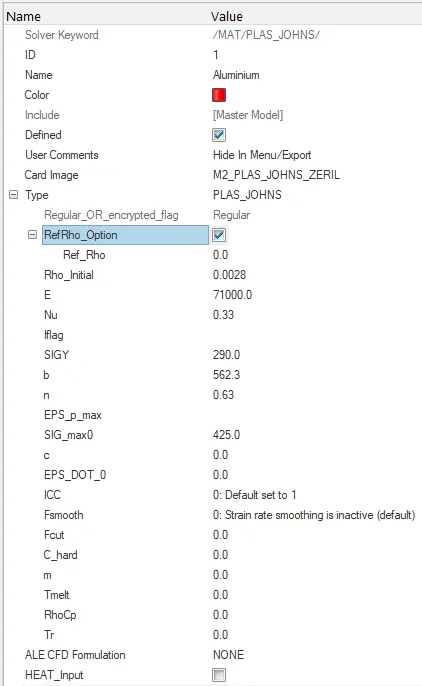
Sneaking into FAILURE_JOHNSON_0001.out file to view Energy and mass error

Energy Error : 3%
Mass Error : 0%
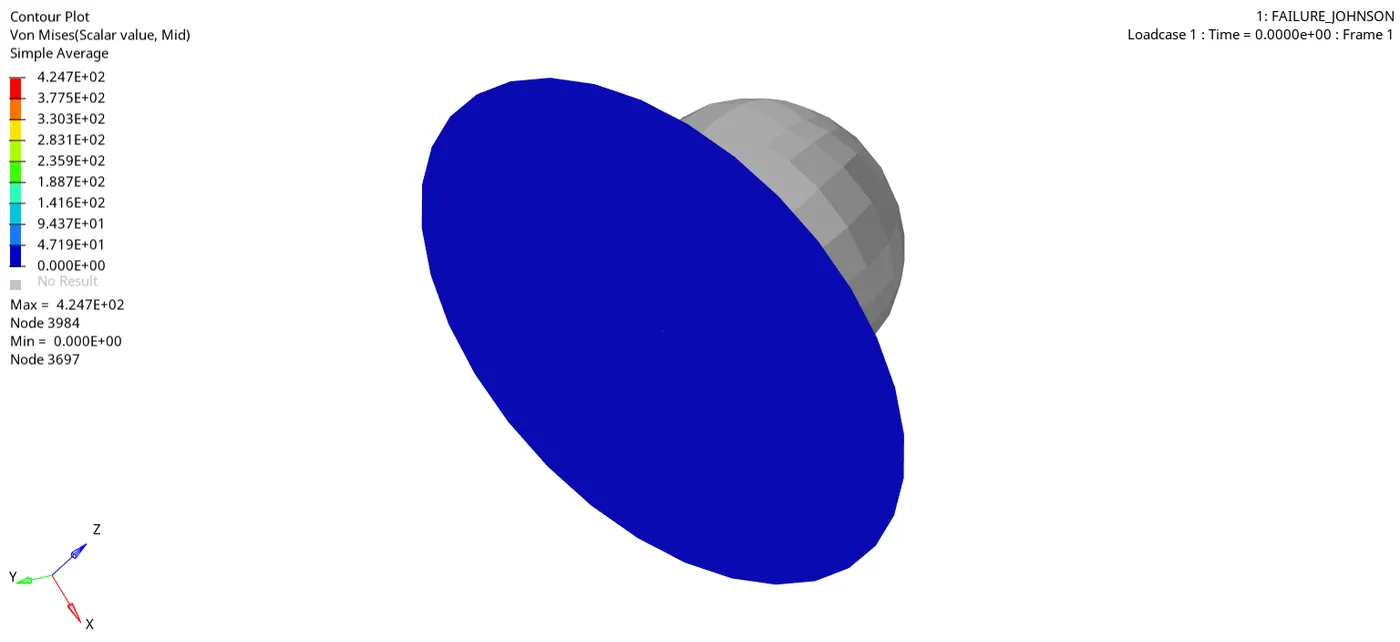
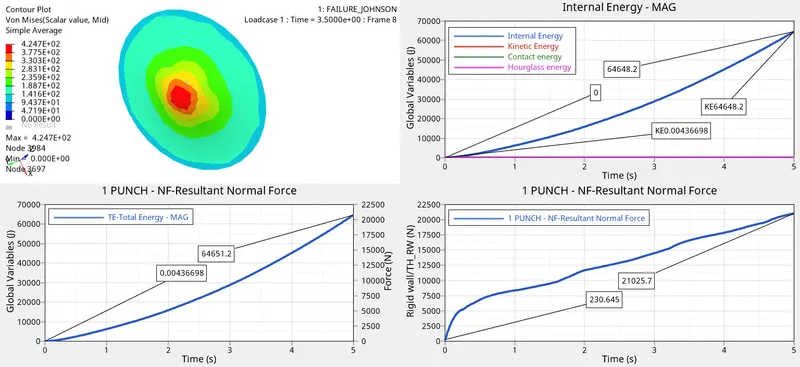
Vonmises stresses animation
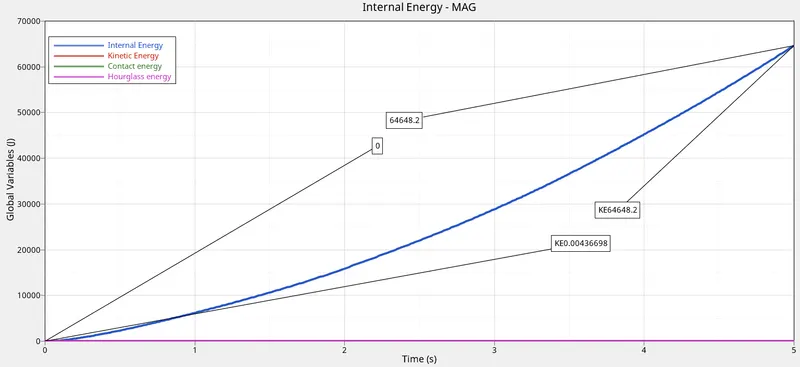
Internla Energy, Kinetic Energy, Contact Energy, Hourglass Energy vs Time
Total Energy vs time
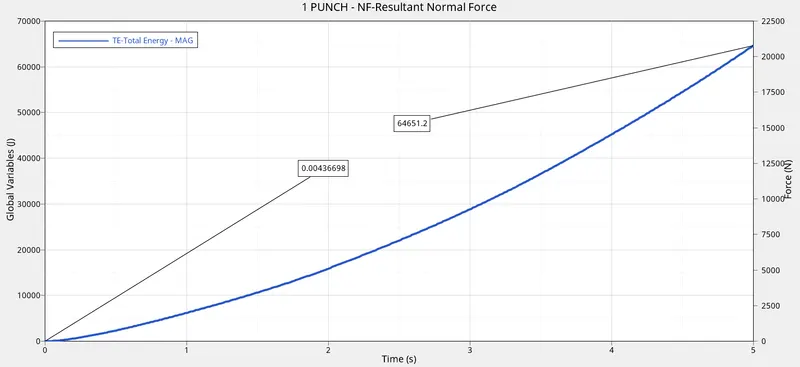
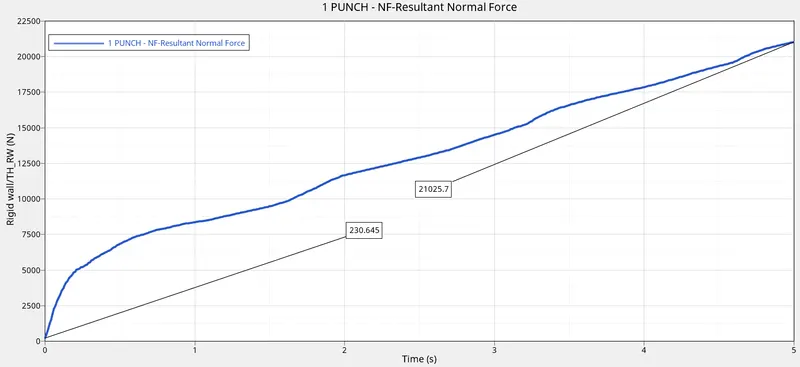
Rigid wall forces vs time
Combined plots
Results:
In this case the Epsmax value was removed and it is seen that the material follows linear curve of Total energy and Intrnal Energy with respect to time. Elements were not deleted and no cracking was observed. It is observed that in this case there is maximum displacement and the Maximum value of Kinetic Energy as compared to the other analysis results
Case 5:
Failure Model : ---
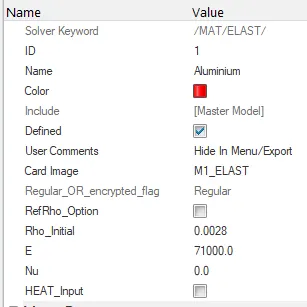
Material Card : M1_ELAST
Property Card : P1_Shell
Sneaking into FAILURE_JOHNSON_0001.out file to view Energy and mass error

Energy Error : 7.5%
Mass Error : 0%
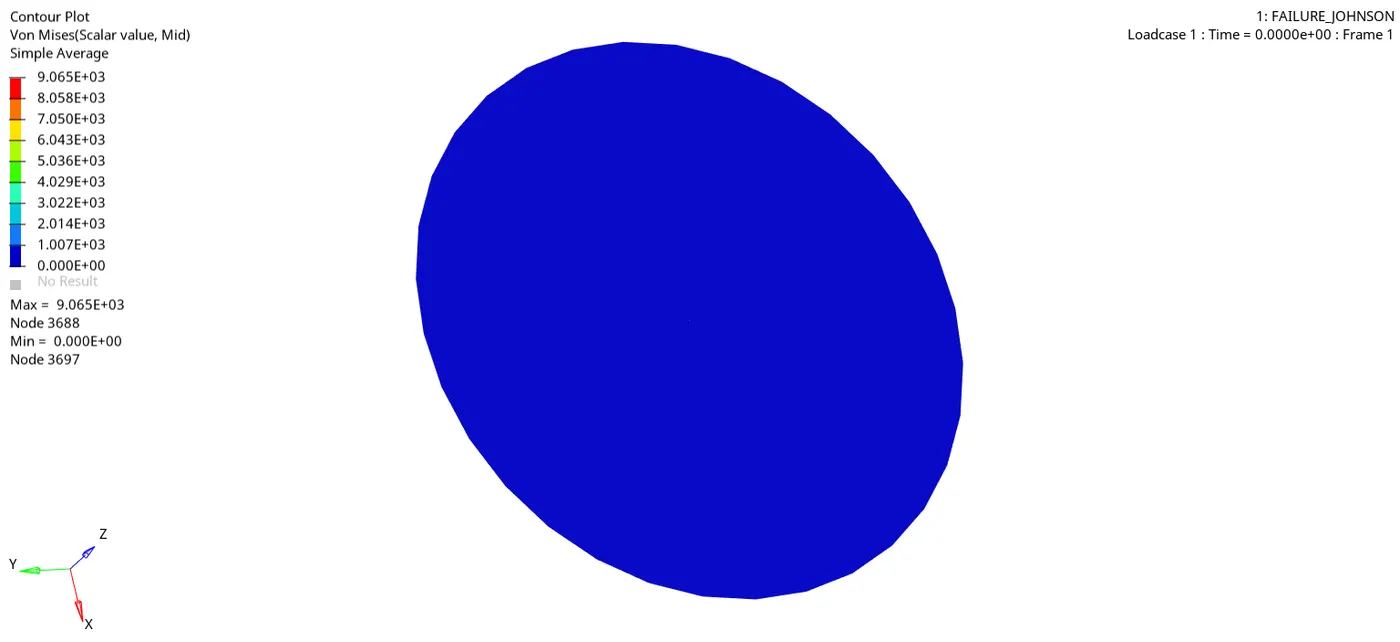
Vonmises stresses animation
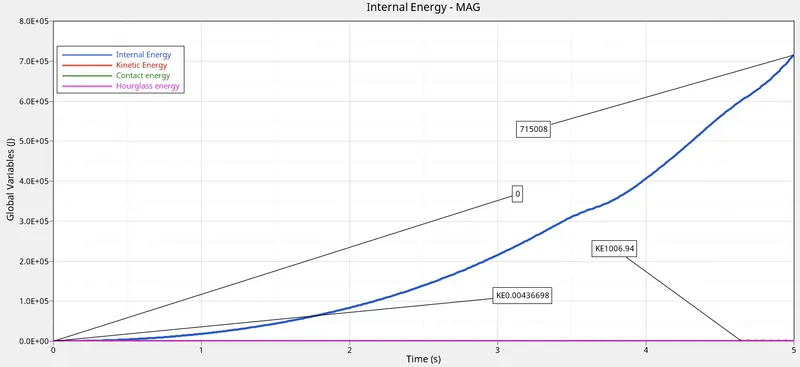
Internla Energy, Kinetic Energy, Contact Energy, Hourglass Energy vs Time
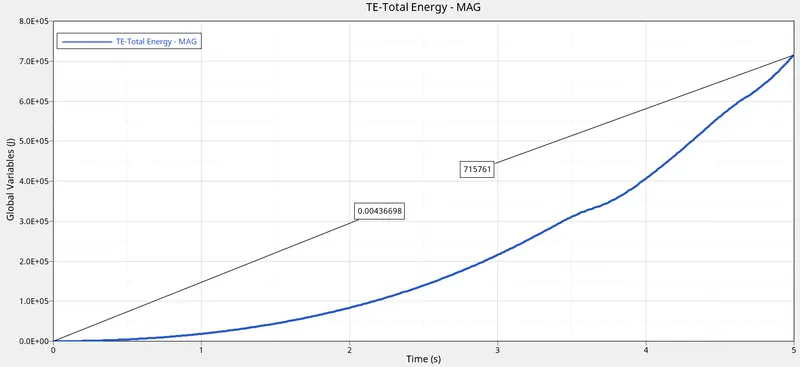
Total Energy vs time
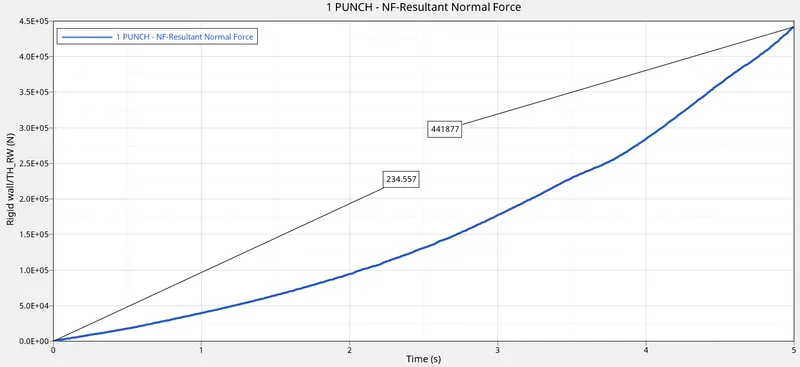
Rigid wall forces vs time
Combined plots
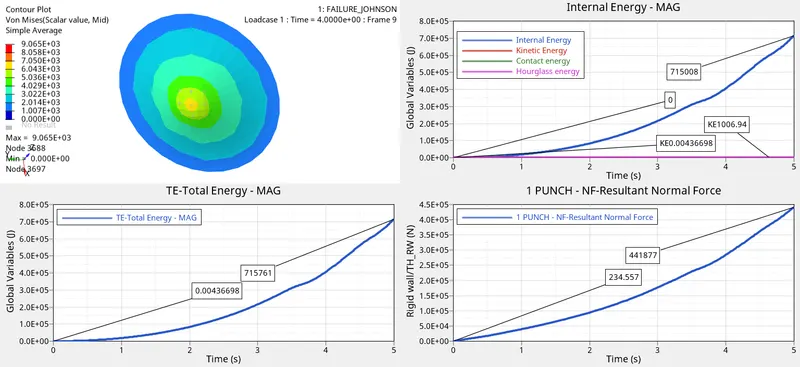
Results:
M1_ELAST: This card defines an isotropic, linear elastic material using Hooke's law. This law represents a linear relationship between stress and strain. It is available for truss, beam (type 3 only), shell and solid elements. This material law is used to model purely elastic materials. The material stiffness is determined by only two values: the Young's modulus (E), and Poisson's ratio ( υυ ).
From the graph and the animation, it is observed that the stress and strain follow a linear curve and the energy is constantly going on increasing, there is no crack was observed as such the Vonmises stress, total Energy and the R-Wall Forces was maximum as compaed to rest on the analysis results.
Case 6:
Failure Model : ---
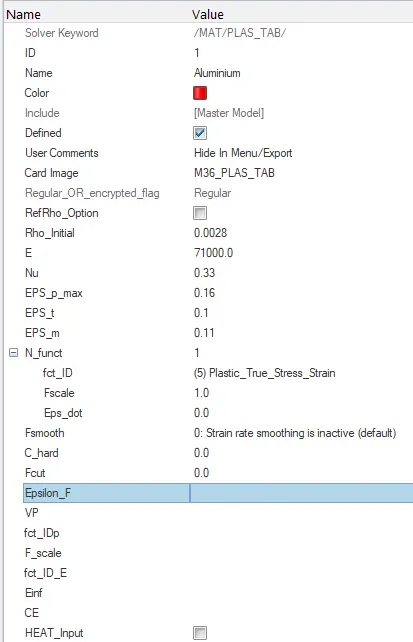
Material Card : M36_PLAS_TAB
Property Card : P1_Shell
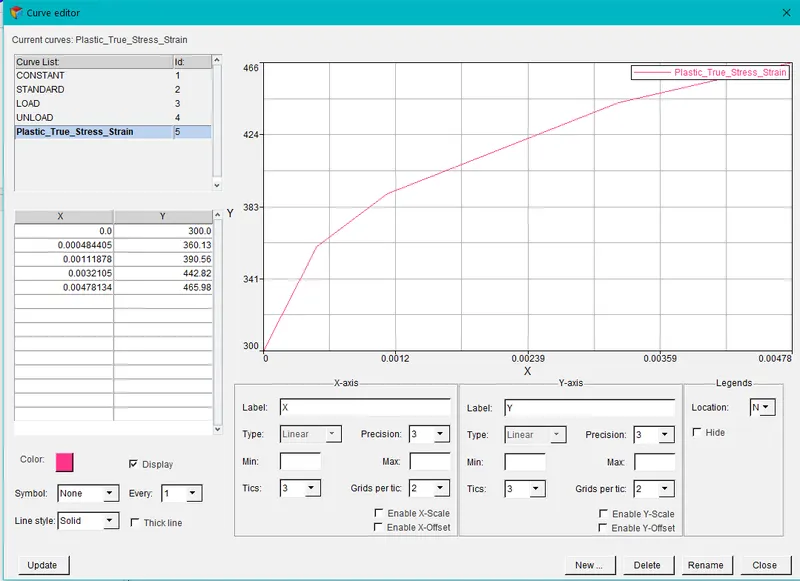
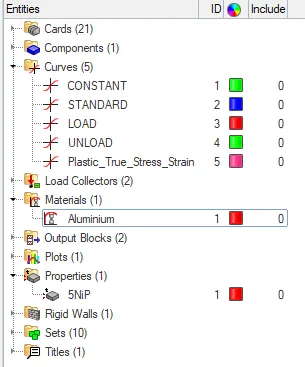
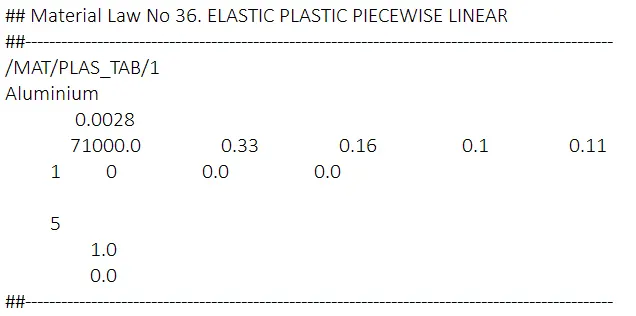
To create the material card, feed the stress strain curve data into the curve, and then assign the curve to the card
Sneaking into FAILURE_JOHNSON_0001.out file to view Energy and mass error

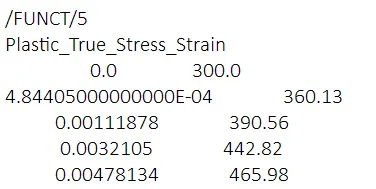
Energy Error : 1.5%
Mass Error : 0%
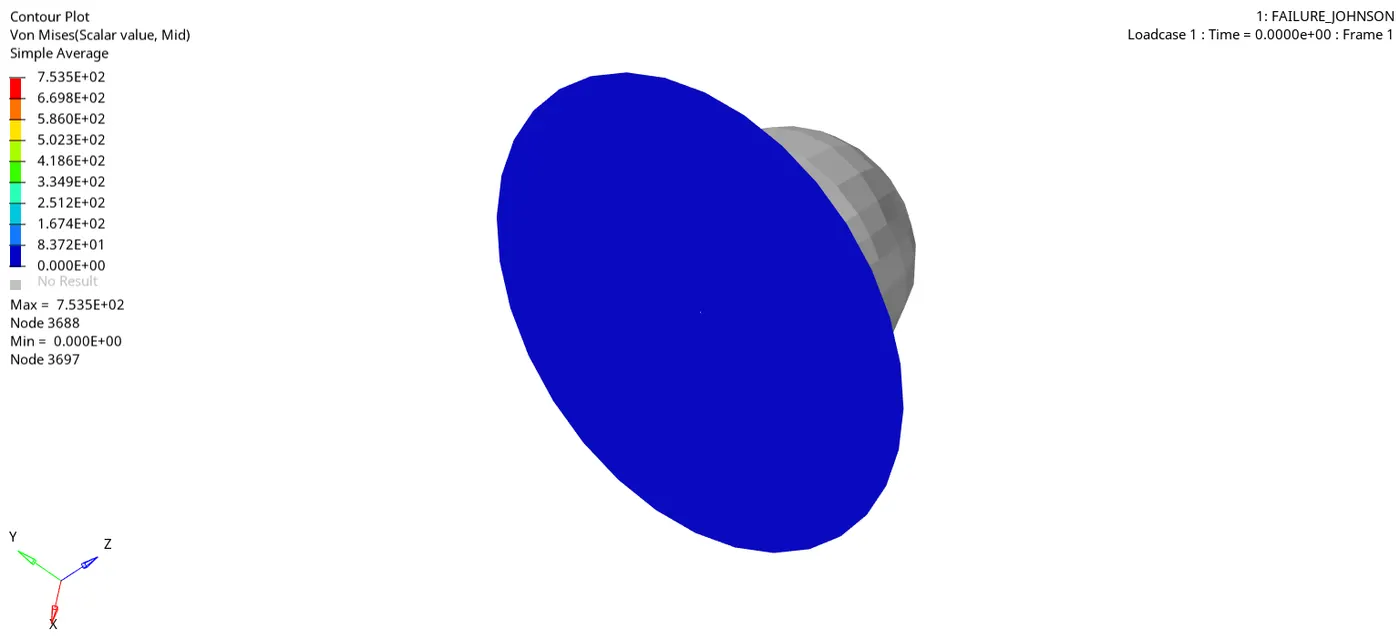
Vonmises stresses animation
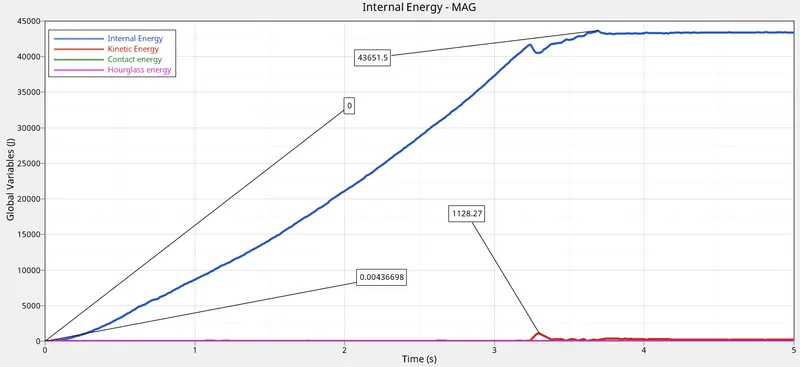
Internla Energy, Kinetic Energy, Contact Energy, Hourglass Energy vs Time
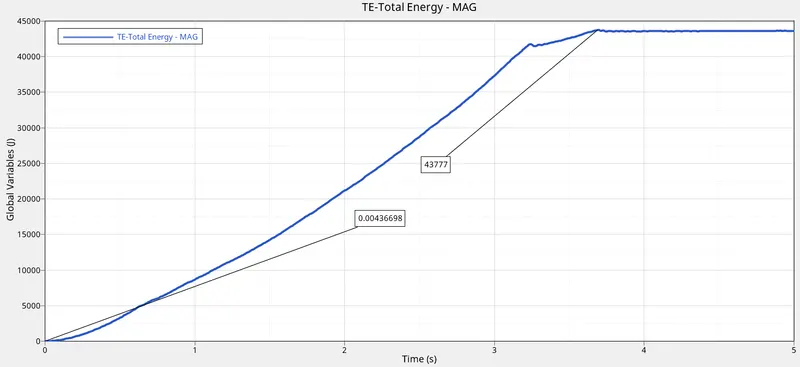
Total Energy vs time
Rigid wall forces vs time
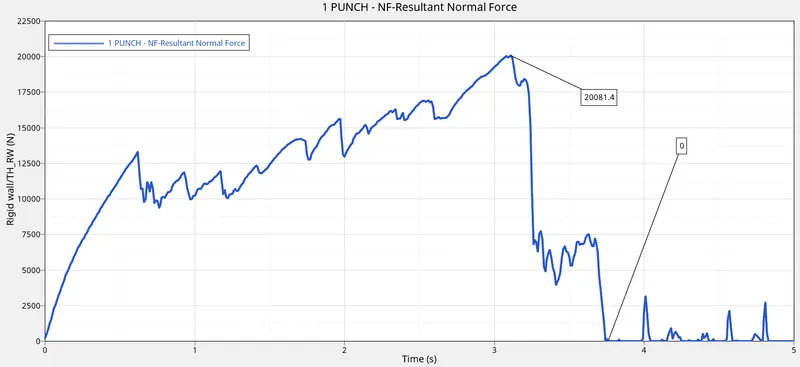
Combined plots
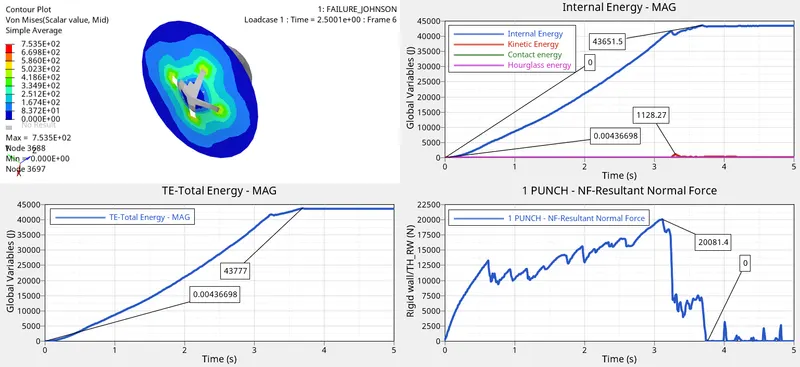
Result:
M36_PLAS_TAB, This law models an isotropic elasto-plastic material using user-defined functions for the work-hardening portion of the stress-strain curve for different strain rates.
First the material undergoes plastc deformation, due to phenomenan of work hardening, more energy was decepiated by the system, thus the material was torn apart from the parent material.
Case 7:
Failure Model : ---
Material Card : MAT27_PLAS_BRIT
Property Card : P1_Shell
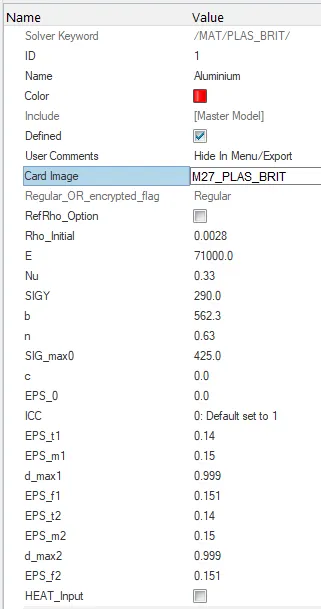
Sneaking into FAILURE_JOHNSON_0001.out file to view Energy and mass error

Energy Error : 1.1%
Mass Error : 0%
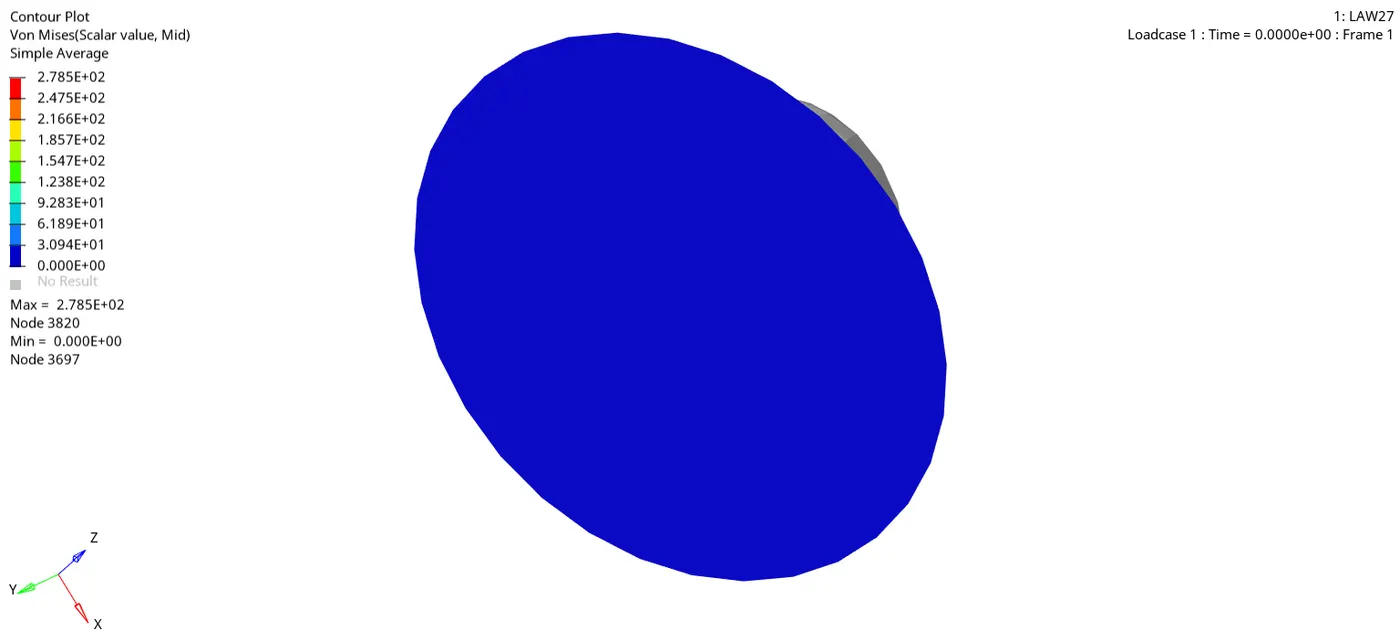
Vonmises stresses animation
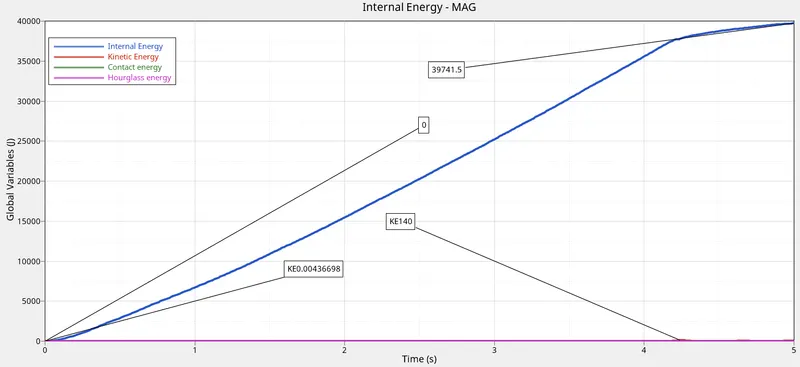
Internla Energy, Kinetic Energy, Contact Energy, Hourglass Energy vs Time
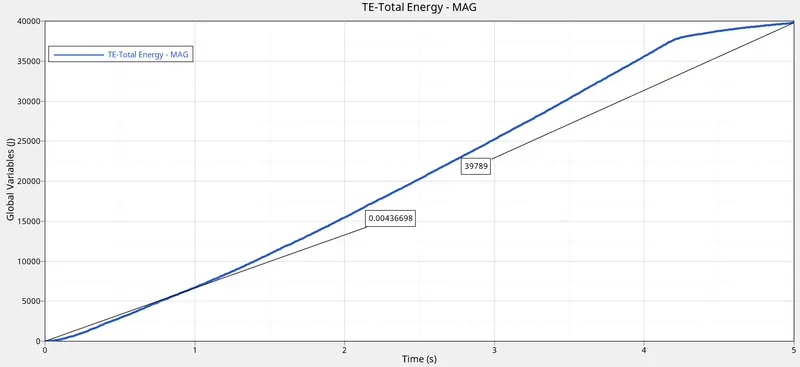
Total Energy vs time
Rigid wall forces vs time
Combined plots
Result:
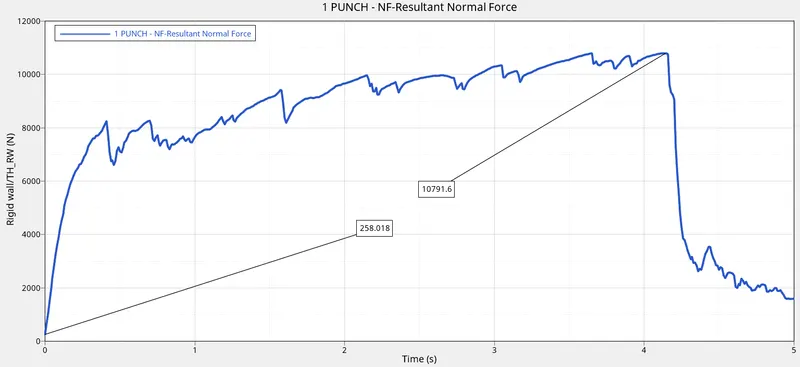
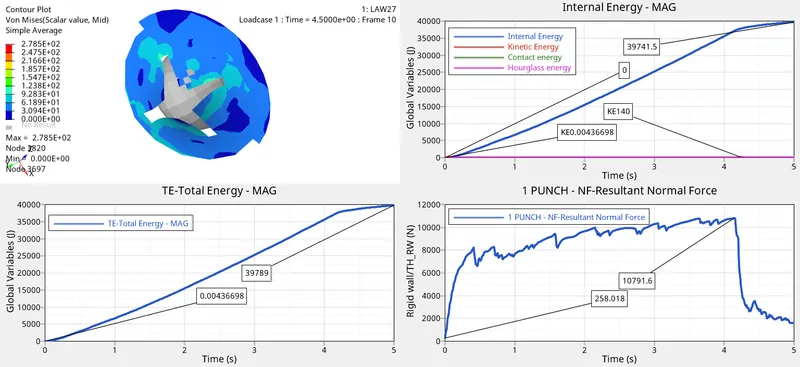
MAT27_PLAS_BRIT, This law combines an isotropic elasto-plastic Johnson-Cook material model with an orthotropic brittle failure model, in this model, the material behaves as a linear-elastic material when the equivalent stress is lower than the plastic yield stress and for higher stress values, the material behavior is plastic. When the analysic was performed it is seen that the material was broken onsat by the crackwhich propogated from the centre toward the outer perifery of the material. Th forces rises till the fracture point and then significant drop was observed in R-wass forces. From the total energy graph it is observed that after the fracture little more energy was absorbed by the system to propogate the brittle fracture. The maximum displacement was also observed as compared to rest of the analysis results.
Conclusion
- Run seven simulations with different parameters and cards
- Different failure mode was observed
- Contour and graphs were plotted to have a visual and numerical representation
- Law2_espmax_nofail had the minimum energies throughout the analysis
- Law1 have the maximum of all the eergies
- Law36 has the maximum displacement and Law2 have the minimum displacement
- Note: Here in the conclusion Law2, Law36, etc only represent the name of the simulation not the actual card name
| S.No | Point of Comparison | Law2_epsmax_failure | Law2_espmax_crack | Law2_espmax_nofail | Law2 | Law1 | Law27 | Law36 |
| 1 | Energy Error | 0.8% | 3.7% | 0.8% | 3% | 7.5% | 1.1% | 1.5% |
| 2 | Mass Error | 0% | 0% | 0% | 0% | 0% | 0% | 0% |
| 3 | Elapsed Time | 124.81s | 296.19s | 261.15s | 256.69s | 253.87s | 119.37s | 133.63s |
| 4 | Total Number of Cylces | 49384 | 49407 | 49405 | 48737 | 47901 | 49356 | 52204 |
| 5 | Max Displacement | 1.881E+01 | 8.105E+00 | 1.858E+01 | 5.011E+00 | 5.005E+00 | 6.033E+00 | 3.368E+01 |
| 6 |
Vonmises, Min Max |
0 2.751E+02 |
0 3.096E+02 |
0 2.705E+02 |
0 4.247E+02 |
0 9.065E+03 |
0 2.785E+02 |
0 7.535E+02 |
| 7 |
Internal Energy, Min Max |
0 2.628E+04 |
0 3.059E+04 |
0 2.717E+04 |
0 6.465E+04 |
0 7.150E+05 |
0 3.974E+04 |
0 4.365E+04 |
| 8 |
Kinetic Energy, Min Max |
4.367E-03 4.136E+02 |
4.367E-03 3.468E+02 |
4.367E-03 3.553E+02 |
4.367E-03 6.465E+04 |
4.367E-03 1.007E+03 |
4.367E-03 1.400E+02 |
4.367E-03 1.128E+03 |
| 9 |
Contact Energy, Min Max |
0 0 |
0 0 |
0 0 |
0 0 |
0 0 |
0 0 |
0 0 |
| 10 |
Hourglass Energy, Min Max |
0 0 |
0 0 |
0 0 |
0 0 |
0 0 |
0 0 |
0 0 |
| 11 |
Total Energy, Min Max |
3.000E+01 1.263E+05 |
4.367E-03 3.067E+04 |
4.367E-03 2.722E+04 |
4.367E-03 6.465E+04 |
4.367E-03 7.158E+05 |
4.367E-03 3.979E+04 |
4.367E-03 4.378E+05 |
| 12 |
Resultant Normal Rigid wall forces Min Max |
0 8.311E+03 |
0 8.345E+03 |
0 8.176E+03 |
2.306E+02 2.102E+04 |
2.346E+02 4.419E+05 |
2.580E+02 1.079E+04 |
0 2.008E+04 |
| 13 |
Outcome Points |
Low Energy error |
More Simulation Time |
Minimum of Max Vonmises Minimum Max Total Energy Minimum Max R-Wall Forces |
Minimum Displacement Maximum Max Kinetic Energy |
High Energy Error Less No. of Cycles Maximum Max Vonmises Maximum Max Total Energy Maximum Max R-Wall Forces |
Less Simulation time |
More No. of Cycles Maximum Displacement |