ANALYSIS AND STUDY OF COVID-19 DATA USING BENFORD’S LAW.
Abstract
The Covid19/Wuhan virus knocked out the feet of everyone in 2019. Mankind has suffered a lot, and the global economies were down. But, like always, together we have managed to overcome the situation. Rapid vaccinations brought a sense of relief to people. During the pandemic, many numbers/variables were recorded each day. Many questions were raised about the authenticity of these numbers. In this project, we take a step to answer some of these questions. The project helps us decide to be in favor/against some of the arguments. This can be achieved by verifying a phenomenon called Benford’s law.
The Wikipedia definition of Benford’s law is that Benford's law is an observation that in many real-life sets of numerical data, the leading digit is likely to be small. This is quite against the common belief that the probability of occurrence of a number as a leading digit is equal for all the other numbers. Well, Mathematics works in mysterious ways. In this project, variables like total/new deaths reported, and total/new vaccinations for the desired country/or at a global level, are checked for consistency with Benford’s distribution.
Motivation for the work
The motivation and idea to work on this project came while watching a Netflix documentary series [1] named “Connected: The Hidden Science of Everything”. In one of the episodes, the host Latif Nasser explores a law of numerical probability that applies to classical music, contemporary social media, tax fraud, and perhaps the entire universe. The law is called Benford’s Law.
This was also the time, when media, critics, political parties, and organizations started questioning the authenticity of the data/information on Covid-19 cases, tests, deaths, and vaccinations provided/ recorded by some of the countries. This led me to think if we could apply Benford’s law to Covid-19 data and made me rewatch the particular episode of the documentary.
Introduction
It all started in December 2019 when the first case of Coronavirus disease was identified in Wuhan. The disease spread worldwide in a matter of months, creating a pandemic. The contagious nature of the virus forced the governments to shut down all the economic activities, other than essential services, leading to a global economic downfall, and disruption of global supply chains to name a few problems. Massive testing measures were taken by governments across the globe to detect and contain the virus. As of 6th May 2022, the virus has infected more than half a billion people, leading to more than 6 million officially recorded deaths. Studies suggest that the actual figure is twice as more as the actual number. In some countries, it is 10 times the official count.
The remarkable growth in technology and the continuous efforts by the scientists made it possible to create a vaccine in under 1 year. This is one of the fastest vaccines ever developed for a disease of this nature [2]. The respective governments started vaccinating their people at a record-breaking pace. After 2 complete years, the global functionality is almost at its pre-covid levels.
Logarithmic scale:
A logarithmic scale is a scale of measurement where the position is marked using the logarithm of the value, instead of the value itself. On a linear scale, the distance between 1 and 2 would be the same as 2 and 3, because it is additive in nature. But, on a logarithmic scale, things work differently, the distance between 1 and 2 is not the same as 2 and 3. Surprisingly it is the same as 2 and 4 because the scale is multiple/ratio in nature. A logarithmic scale is used when a large range of quantities is to be compared or plotted.
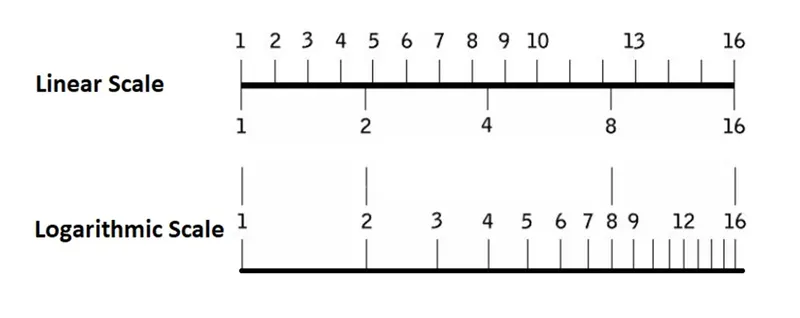
Figure 01 – Comparison of Linear and Logarithmic scales.
Benford’s Law:
Benford’s law is an observation about the leading digits of numbers occurring naturally. It says that the leading digits in many real-life numerical data sets are likely to be small. It was first discovered by Simon Newcomb in 1881 when he noticed that the earlier pages, which started with 1, were much more worn than the other pages. This was again observed by Frank Benford. Benford tested the phenomenon on data sets from domains as varied as Molecular chemistry to Demographics.
The law was further developed for the second and third digits also.
Conditions:
- Data should be Scale-invariant – The first digit should have the same distribution irrespective of the unit of measurement.
- Data must span several orders of magnitude. The accuracy of the Law increases as the orders of magnitude increase.
- Data must not be assigned sequentially.
- Data must not be influenced by human thought.
- Data must not have a built-in maximum or minimum value.
Explanation:
This section is directly absorbed from Brilliant.org[5], as I believe I couldn’t provide a better explanation than the one that the writers presented there.
The easiest way to explain Benford's law directly is to consider the (base-10) logarithms of the numbers in a given data set. If their fractional parts are uniformly (evenly) distributed inside the interval [0,1][0,1], then the data set will be Benford.
To see this, note that a number ‘x’ starts with a digit ‘d’ if and only if
`log_10d<={log_10x}<=log_10d+1`
i.e., Fractional part of the logarithm of the number ‘x’ lies in an interval of length
`log_10(d+1)-log_10(d)=log_10(1+1/d)`
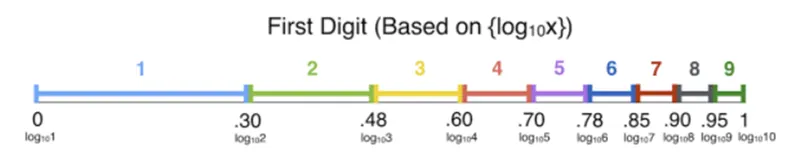
Figure 02 – Logarithmic Scale
For example, 74923 starts with a 7 because `{log_10(74923)}={4.8746}=0.8746` lies between `log_10(7)=0.845~~0.85` and `log_10(8)=0.903~~0.90`. If the set of values of `{log_10x}`, for x in the data set, is uniformly distributed in [0,1], then the probability that this happens will just be the width of the interval, as Benford’s law predicts.
So, the probability of the leading digit occurring is
`P(d)=log_10(1+1/d), din(1,9)`
The leading digits, thus have the distributions as shown below
|
d |
P(d) |
|
1 |
30.1 % |
|
2 |
17.6 % |
|
3 |
12.5 % |
|
4 |
9.7 % |
|
5 |
7.9 % |
|
6 |
6.7 % |
|
7 |
5.8 % |
|
8 |
5.1 % |
|
9 |
4.6 % |
Table 01 – Probability of the leading digits
The graphical representation of the distribution would be as follows,
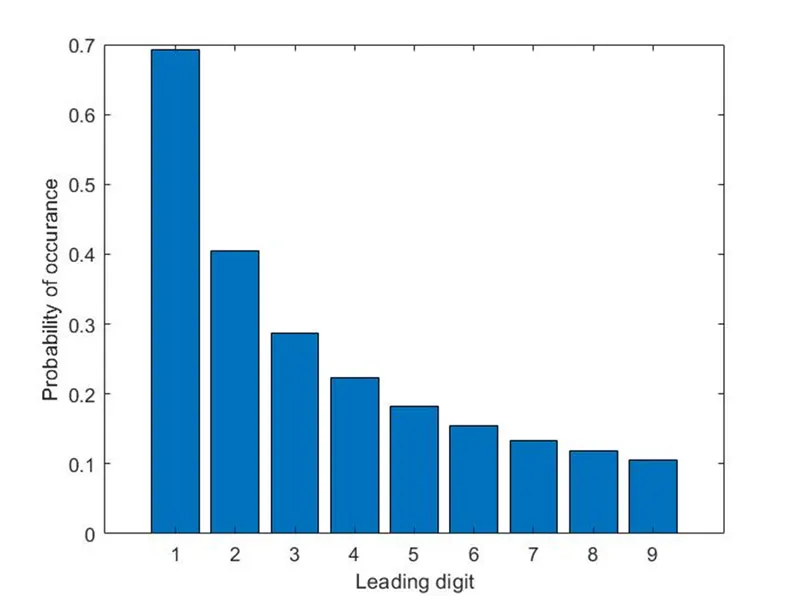
Plot 01 – Benford’s distribution
Applications
Benford’s law can be used whenever there is naturally occurring data in varying magnitudes. Some of the examples are,
- Accounting Fraud detection
- Election data
- Macroeconomic data
- Price digit Analysis
- Genome data
- Scientific Fraud detection
Methodology
Data Accumulation
This part of the process has been simplified by the usage of data from a GitHub website [7] dedicated specifically for covid-related data. The website updates the data every 24 hours throughout the duration of the Covid-19 pandemic. Data is accumulated/ updated here, from various sources like the United Nations (UN), World Bank, Global Burden of Disease, Covid-19 data repository by the Center for Systems Science and Engineering (CSSE) at Johns Hopkins University (JHU), etc. It is to be noted that, the date of confirmed cases and deaths are the dates on which they are reported, rather than the actual date of test and death respectively.
The data is available in CSV, XLSX, and JSON formats. The data contains information on Covid related variables total cases, new cases, new cases smoothed, total cases per million, new cases per million, new cases smoothed per million, total deaths, new deaths, new deaths smoothed, total deaths per million, new deaths per million, new deaths smoothed per million, excess mortality, excess mortality cumulative, excess mortality cumulative absolute, excess mortality cumulative per million, ICU patients, ICU patients per million, hospitalized patients, hospitalized patients per million, weekly ICU admissions, weekly ICU admissions per million, weekly hospital admissions, weekly hospital admissions per million, stringency index, reproduction rate, total tests, new tests, total tests per thousand, new tests per thousand, new tests per thousand, new tests smoothed, new tests smoothed per thousand, positive rate, tests per case, tests units, total vaccinations, people vaccinated, people fully vaccinated, total boosters, new vaccinations, new vaccinations smoothed, total vaccinations per hundred, people vaccinated per hundred, people fully vaccinated per hundred, total boosters per hundred, new vaccinations smoothed per million, new people vaccinated smoothed and new people vaccinated smoothed per hundred and Non-Covid related data.
Code/Script
The Code/script to analyze the data is written in MATLAB. It is as follows.
Extraction of Numerical information and Non-numerical information as data and header respectively.
%Numerical information is raw data, whereas Non-numerical information is Geographical location, variable etc.
[data,header] = xlsread('owid-covid-data.xlsx');

%Collecting all the variables.
Available_parameters=header(1,5:end);

%Selection between a Global study or a Country level study
level=questdlg('Study to be performed at Global level ?','Yes','No');
For Global study
if strcmp(level,'Yes')

    %Variable Selection
    %Note - It is prescribed not to select variables such as total deaths or
    %toatal cases, as they would naturally rise. Which makes the data move
    %in a single direction.
    uiwait(msgbox('It is prescribed not to select parameters involving total data, as they would naturally rise or stay constant','Warning'))
    uiwait(msgbox({'For accurate results, the following parameters would be the best choice';'new_cases';'new_deaths';'new_tests';'new_vaccinations'},'suggestion'))
    [parameter_index,tf] = listdlg('PromptString',{'Select a parameter'},'ListString',Available_parameters,'SelectionMode','single','Name','parameter Selection');
    parameter=Available_parameters(parameter_index);

    %Data extraction of selected variable
    parameter_data=data(1:end,parameter_index);
    parameter_data(isnan(parameter_data))=0;
    country_selected='Global Data';
end
For the Country level study
if strcmp(level,'No')

    %Country selection
    %Note - For accurate results, it is prescribed to select only those countries whose data is
    %sufficiently high and ranges in multiple orders.
    countries_list=header(:,3);
    unq_Available_countries=unique(header(:,3));
    uiwait(msgbox('It is prescribed not to perform this study on countries whose data is low','Warning'))
    [country_number,tf] = listdlg('PromptString',{'Select a country'},'ListString',unq_Available_countries,'SelectionMode','single','Name','Country Selection');
    country_selected=unq_Available_countries(country_number)
    n=1;

    %Data Extraction of selected variable
    %Extraction of the first and last position of the country in the Excel
    for i=1:length(countries_list)
        k=strcmp(countries_list(i),country_selected);
        if k==1
            value(n)=i;
            n=n+1;
        end
    end

    country_first_occ=value(1);
    country_last_occ=value(end);
    uiwait(msgbox('It is prescribed not to select parameters involving total data, as they would naturally rise or stay constant','Warning'))
    [parameter_index,tf] = listdlg('PromptString',{'Select a parameter'},'ListString',Available_parameters,'SelectionMode','single','Name','parameter Selection');
    parameter=Available_parameters(parameter_index);
    parameter_data=data(country_first_occ:country_last_occ,parameter_index);
    parameter_data(isnan(parameter_data))=0;
end
Extracting the first digit of each number in the data
for i=1:length(parameter_data)
    value=parameter_data(i);
    value=num2str(value);
    first_digit(i)=str2num(value(1));
    if first_digit(i)==0
        a=value;
        value=str2num(value);
        value=value*10^length(a);
    end
    value=num2str(value);
    first_digit(i)=str2num(value(1));
end
Calculating the occurrence of the first digit
total=0;
for i=1:9
    repeat(i)=length(find(first_digit==i));
    total=total+repeat(i);
end
Calculating the probability of occurrence of the first digit
for i=1:9
    P_data(i)=repeat(i)/total;
end
Probability of the occurrence of the first digit as per Benford's law
for i=1:9
    P_Ben(i)=log(1+(1/i));
end
Check of closeness with Benford's law
%Calculated using Mean Square method.
fit = goodnessOfFit(P_data,P_Ben,'MSE');
x=(1:9);
Results
Geographic_location=country_selected
Varaiable=parameter
Goodness_fit=fit

%Line Plots comparing the actual probability with Benford's probability distribution
figure(1)
plot(x,P_Ben)
hold on
plot(x,P_data)
legend('Benfords Distribution','Covid Distribution')
xlabel('First Digit')
ylabel('Probability')
title(country_selected,parameter)

%Bar chart showing the actual probability distribution of the data
figure(2);
bar(x,repeat);
xlabel('First Digit')
ylabel('Total Occurence')
title(country_selected,parameter)
Results
It is up to the user to select the country and the variable for which the Benford’s law has to be studied. But here I provide results for some of the most controversial data.
- New Deaths in India
Goodness of fit = 0.3242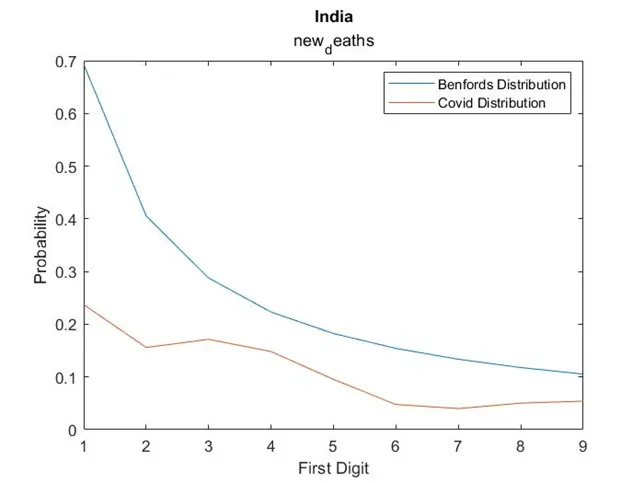
Plot 02 – New Deaths in India
- New Vaccinations in India
Goodness of fit = 0.3314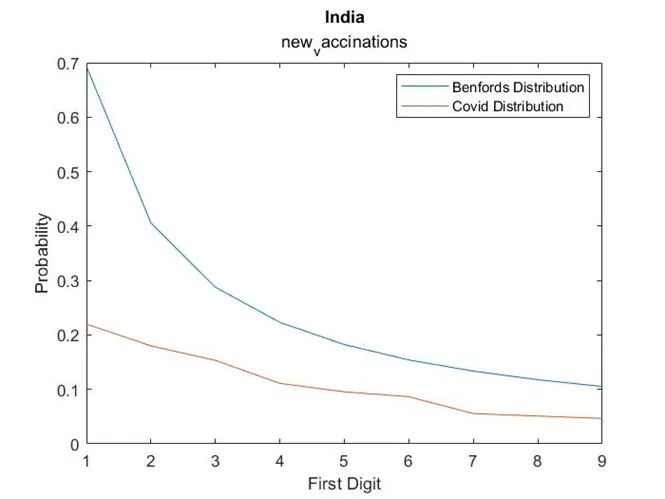
Plot 03 – New vaccinations in India - New Cases in China
Goodness of fit = 0.3044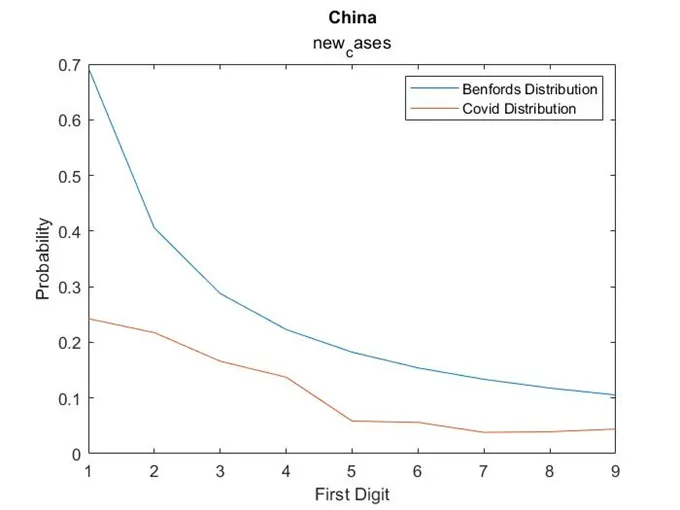
Plot 04 – New cases in China
It can be seen in that the data in the above-mentioned cases follow Benford’s law, but not accurately. The Goodness of fit is the measure of, how close is the distribution of data to the Benford’s distribution. The smaller the Goodness of fit, the better is the distribution w.r.t the Benford’s law. So, from the results of above three cases, we can support that the data is authentic.
It is to be noted that, one cannot completely decide if the data is authentic or bogus only based on Benford’s law. Benford’s law can be only used to support or contradict the data.
References
- https://www.netflix.com/in/title/81031737
- https://www.medicalnewstoday.com/articles/how-did-we-develop-a-covid-19-vaccine-so-quickly#Rigorous-guidelines-for-clinical-trials
- https://www.who.int/emergencies/diseases/novel-coronavirus-2019/question-and-answers-hub/q-a-detail/coronavirus-disease-(covid-19)-vaccines?adgroupsurvey={adgroupsurvey}
- https://en.wikipedia.org/wiki/COVID-19_pandemic#Vaccines
- https://brilliant.org/wiki/benfords-law/
- https://en.wikipedia.org/wiki/Benford%27s_law#cite_note-Newcomb-8
- https://github.com/owid/covid-19-data/tree/master/public/data
- https://doi.org/10.1038/s41562-021-01122-8
- https://doi.org/10.1038/s41597-020-00688-8