Ahmed Body Challenge
FLOW OVER AHMED’S BODY
1. OBJECTIVE
To describe Ahmed’s Body, and to simulate the fluid flow over the given Ahmed Body using the provided boundary conditions. Explain the reason for the negative pressure in the wake region and the significance of the point of separation.
2. 3D MODEL
The Ahmed’s Body is a simplified car model which is used to capture the essential flow features under the given boundary conditions. The parameters obtained using the Ahmed’s Body can be practically verified using the bodies or models in automobile organizations.
Two enclosures were designed to depict the fluid volume around the Ahmed’s Body, in which, one enclosure was used for higher refinement of mesh near the model to obtain clear contours of wake region.
The entire fluid volume was split using the plane having normal at z-axis, due to the symmetric nature of the model, and to obtain higher accuracy of velocity contours.
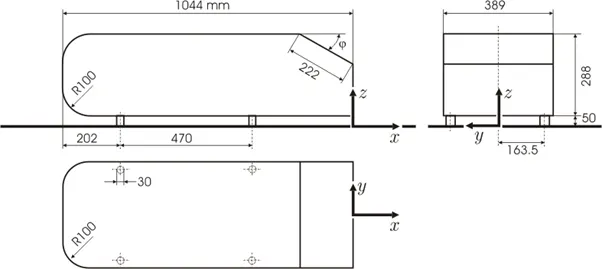
Fig.2.1.1. Ahmed’s Body 2-D Sketch
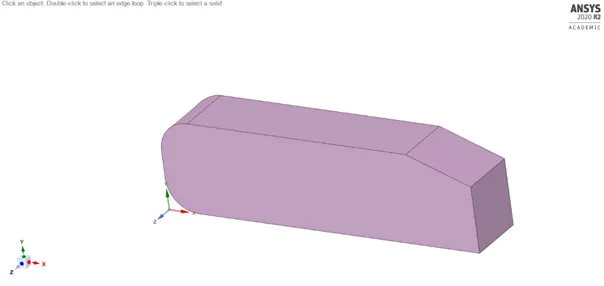
Fig.2.1.2. Ahmed’s Body 3-D Model
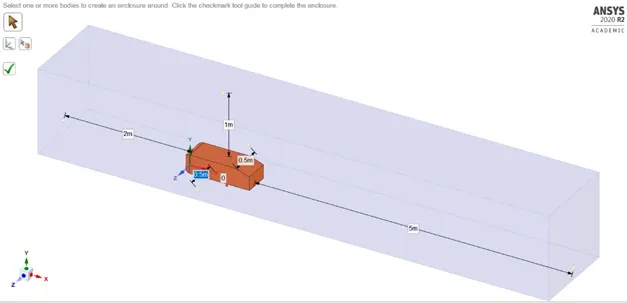
Fig.2.1.3. Outer Enclosure
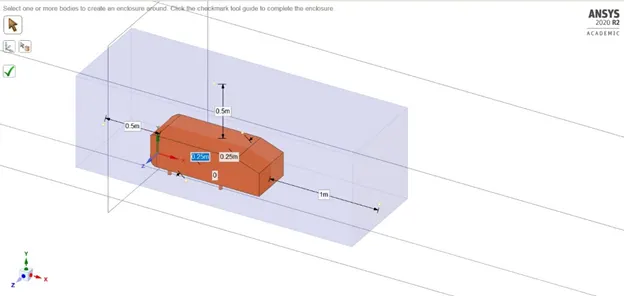
Fig.2.1.4. Inner Enclosure
3. MESH DETAILS
Table 3.1: Mesh Details (Without Refinement)
|
PARAMETERS |
SPECIFICATION |
|
MESH TYPE |
HEX DOMINANT |
|
ELEMENT SIZE |
0.075 m |
|
FACE SIZING |
0.005 m |
|
NUMBER OF ELEMENTS |
26808 |
|
NUMBER OF NODES |
26693 |
Table 3.2: Mesh Details (With Refinement)
|
MESH FEATURE |
REFINEMENT |
||
|
1 |
2 |
3 |
|
|
MULTIZONE |
YES |
||
|
ELEMENT SIZE |
0.075 |
0.05 |
|
|
BODY SIZING (m) |
0.05 |
0.03 |
|
|
FACE SIZING (m) |
0.005 |
0.003 |
|
|
INFLATION LAYERS |
5 |
||
|
GROWH RATE |
1.2 |
||
|
TRANSITION RATE |
0.272 |
||
|
ELEMENTS |
1,04,457 |
1,46,545 |
3,81,578 |
|
NODES |
41,039 |
81,711 |
1,28,135 |
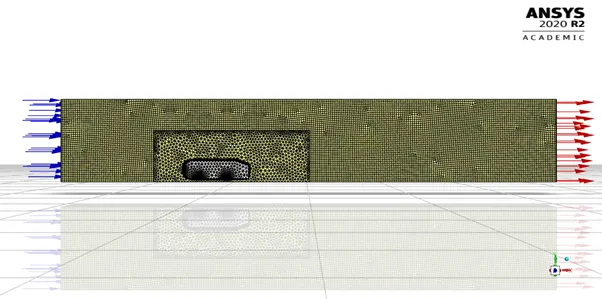
Fig.3.1.1. Fluid Volume Mesh
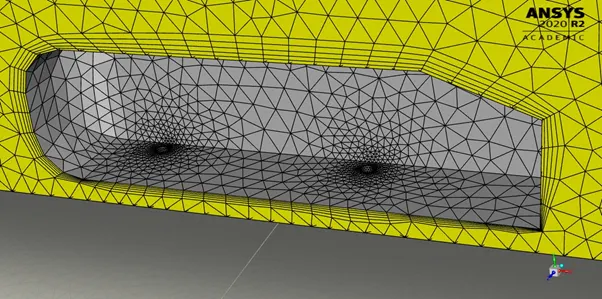
Fig.3.1.2. Inflation Layer and Face Sizing
4. BOUNDARY CONDITIONS
The given inlet condition was less than 1/6th of Mach number, which is considered as pressure-based problem.
Table 4.1: Boundary Conditions
|
PARAMETERS |
SPECIFICATION |
|
SOLVER |
PRESSURE – BASED |
|
INLET VELOCITY |
25 m/s |
|
OUTLET PRESSURE (GAUGE) |
0 Pa |
6. MATERIAL PROPERTIES
Air was used as the fluid material, having its pre-defined characteristic properties and values.
Table 5.1: Fluid Properties
|
PARAMETERS |
SPECIFICATION |
|
DENSITY |
1.225 kg/m3 |
|
VISCOSITY |
1.7894e-05 kg/m-s |
6. RESULTS
A plane is created at 0.0005 micron inside the fluid volume to obtain the pressure and velocity contours with ease. Multiple lines of 1 m length at distances of 1.5 m, 2.5 m, 3.5 m, and 4.5 m from the front of Ahmed’s Body are created to obtain the velocity magnitudes at various heights to conduct grid independence test.
6.1 DEFAULT ENCLOSURE
The wake region behind the Ahmed’s Body is not clearly defined due to low quality mesh obtained by having higher element size. A region of high velocity is obtained at the front portion of the body due to sudden obstruction of fluid flow.
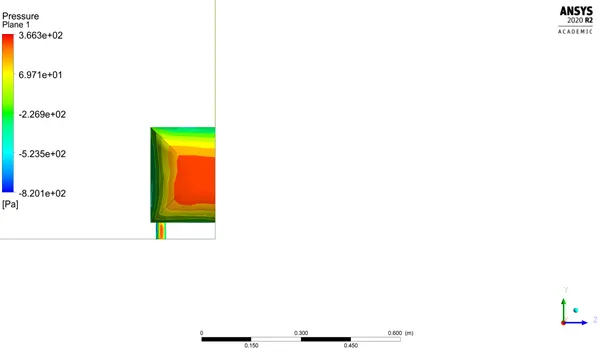
Fig. 6.1.1. Pressure Contours on Ahmed’s Body - Front
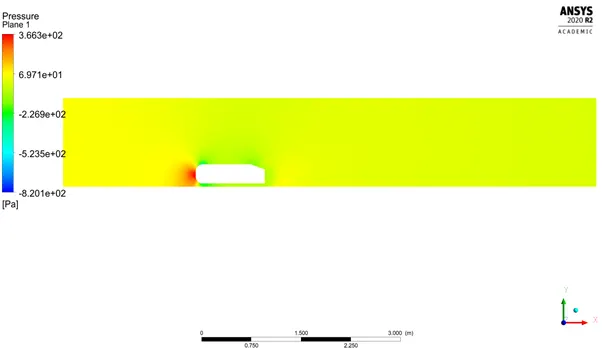
Fig.6.1.2. Pressure Contours
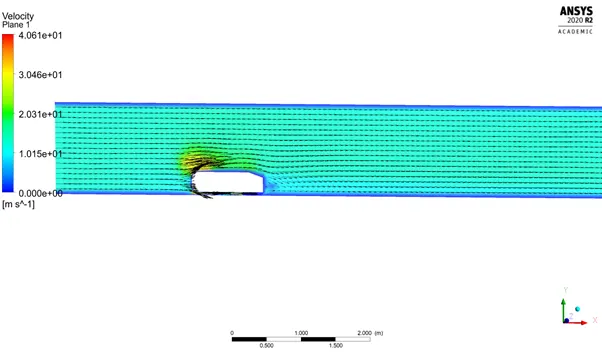
Fig.6.1.3. Velocity Contours with Vectors
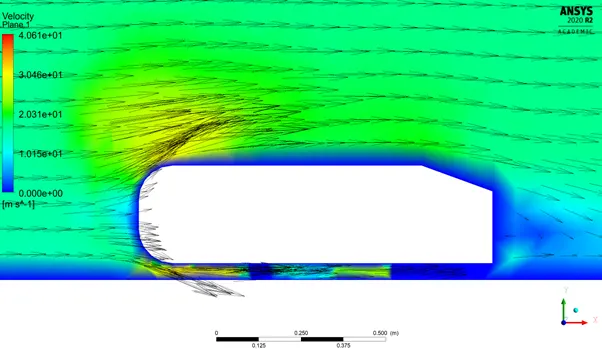
Fig.6.1.4. Velocity Contour with Vector Near Ahmed’s Body
6.2. REFINED ENCLOSURE
6.2.1. REVISION 1
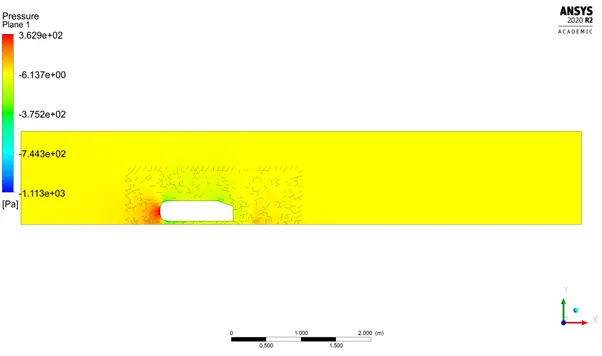
Fig.6.2.1.1. Pressure Contour (Revision 1)
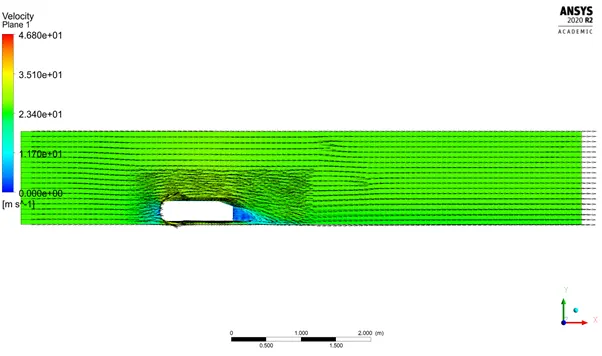
Fig.6.2.1.2. Velocity Contour with Vectors (Revision 1)
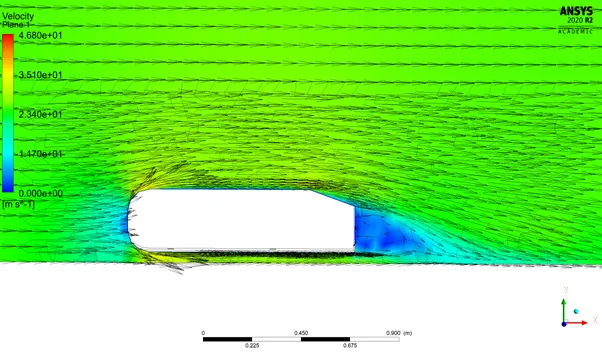
Fig.6.2.1.3. Velocity Contour with Vector Near Ahmed’s Body
6.2.2. REVISION 2
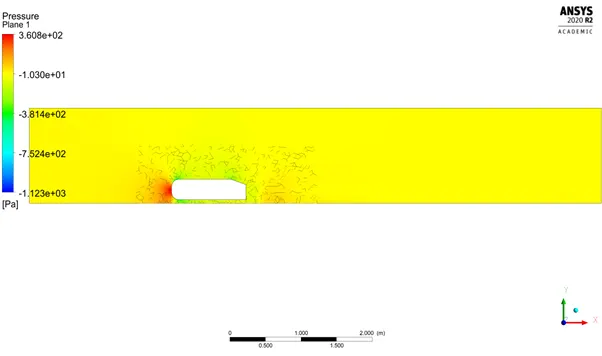
Fig.6.2.2.1. Pressure Contour (Revision 2)
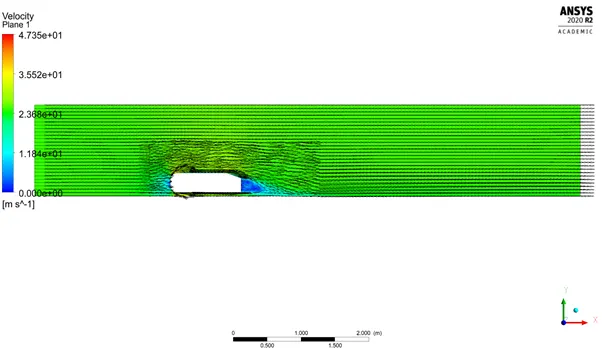
Fig.6.2.2.2. Velocity Contour with Vectors (Revision 2)
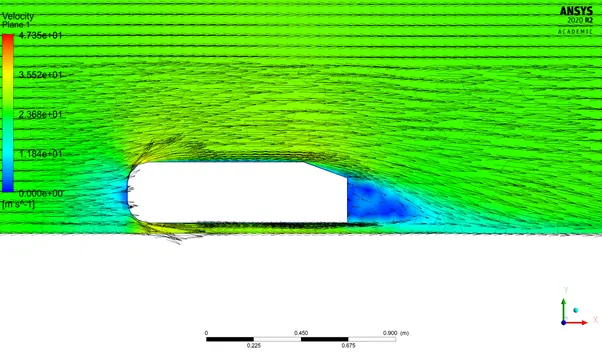
Fig.6.2.2.3. Velocity Contour with Vector Near Ahmed’s Body (Revision 2)
6.2.3. REVISION 3
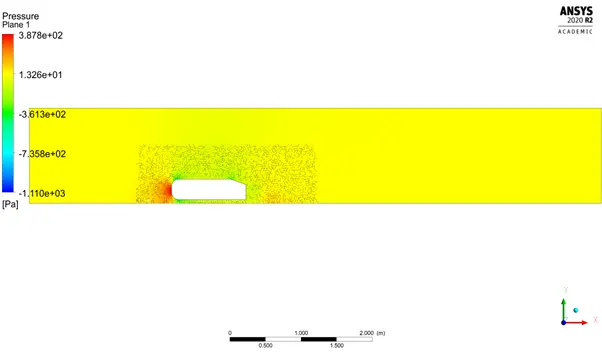
Fig.6.2.3.1. Pressure Contour (Revision 3)
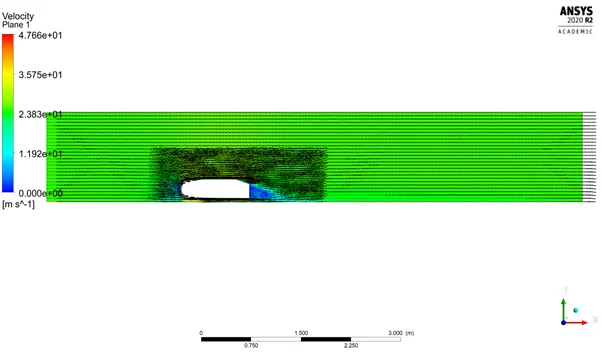
Fig.6.2.3.2. Velocity Contour with Vector (Revision 3)
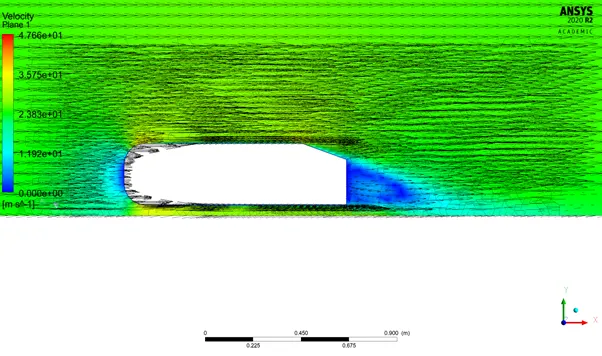
Fig.6.2.3.3. Velocity Contour with Vector Near Ahmed’s Body (Revision 3)
6.2.4. GRID INDEPENDENCE TEST
From the three graphs obtained for the velocities against each line, from the three mesh revisions, we could conclude that the plots of lines 2, 3 and 4 converge at a height of 0.4 m from the base of the Ahmed’s Body. The line 1 from the three graphs plots the same slope but different from other plots because the line is present in the wake region.
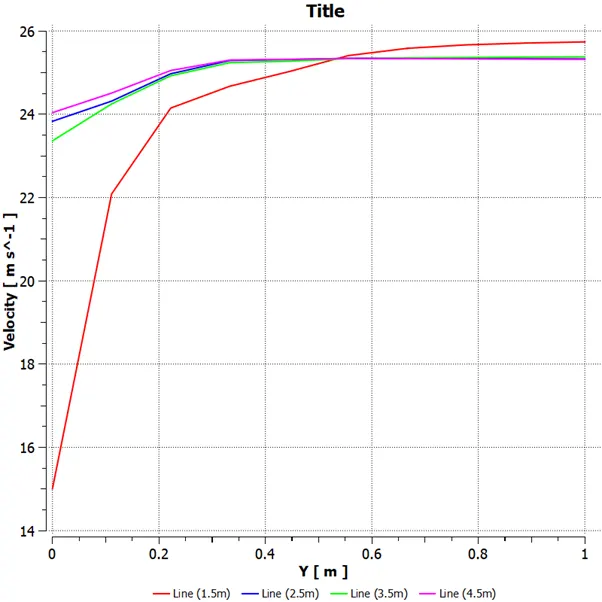
Fig.6.2.4.1. Grid Independence Test (Revision 1)
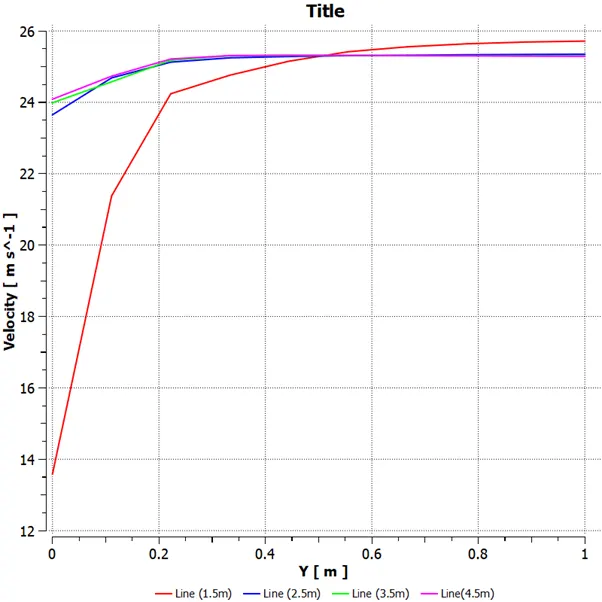
Fig.6.2.4.2. Grid Independence Test (Revision 2)
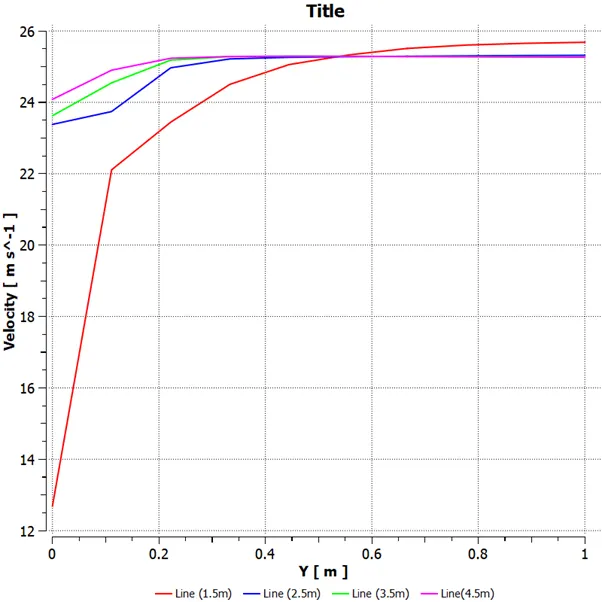
Fig.6.2.4.3. Grid Independence Test (Revision 3)
6.2.5. LIFT
The lift graph was plotted around the Ahmed’s Body under steady-state problem, resulting in approximately 6 N. The coefficient of lift obtained was approximately 9.5
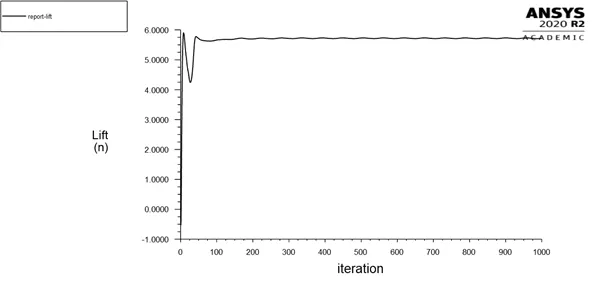
Fig.6.2.5.1. Lift – Revision 1
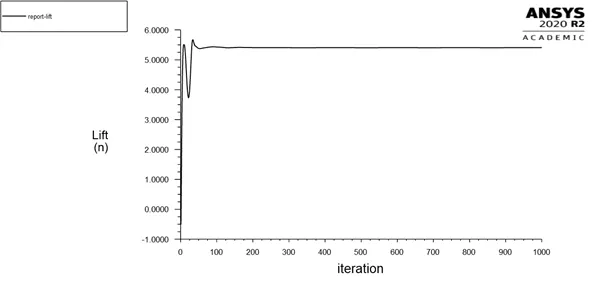
Fig.6.2.5.2. Lift – Revision 2
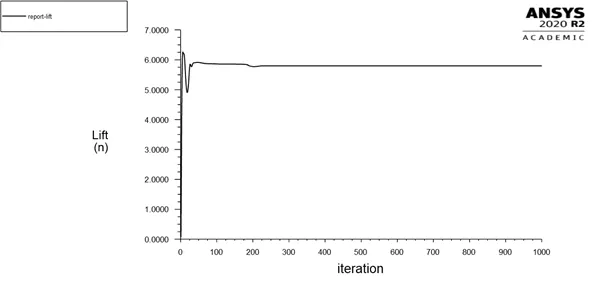
Fig.6.2.5.3. Lift – Revision 3
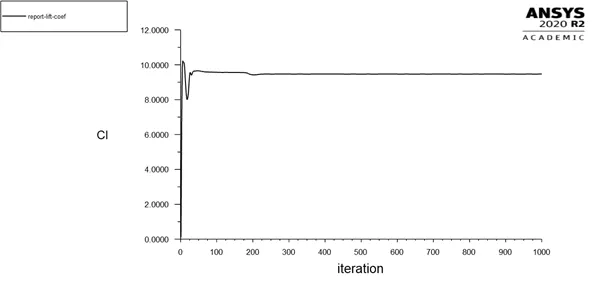
Fig.6.2.5.4. Coefficient of Lift (Revision 3)
6.2.6. DRAG
The drag graph was plotted around the Ahmed’s Body under steady-state problem, resulting in approximately 8 N. The coefficient of drag obtained was approximately 13.
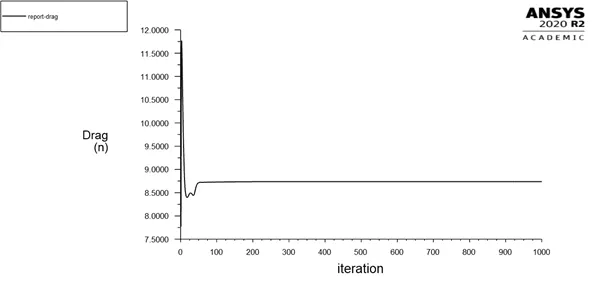
Fig.6.2.6.1. Drag – Revision 1
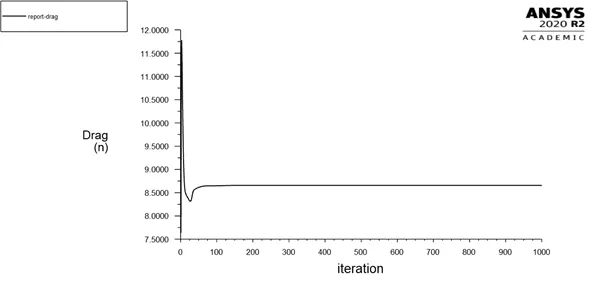
Fig.6.2.6.2. Drag – Revision 2
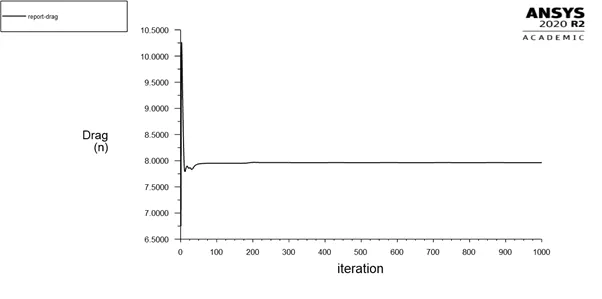
Fig.6.2.6.3. Drag – Revision 3
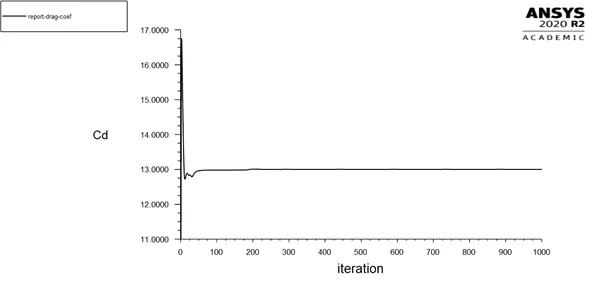
Fig.6.2.6.4. Coefficient of Drag (Revision 3)
7. CONCLUSION
The wake region produces local boundary layer region which produces laminar flow of the fluid around the body.
High velocities are observed at the interference of Ahmed’s body due to the sudden change in direction.
The velocities at various points and heights being plotted by using lines depicts the grid independent nature.
The negative pressure is obtained in the legends due to the usage of gauge pressure, which acts as a reference value for pressure in the fluid region.