Wide-Open Throttle Condition II
1) What is the difference between mapped and dynamic model of engine, motor and generator? How can you change model type?
Mapped (example): Dynamic (example):
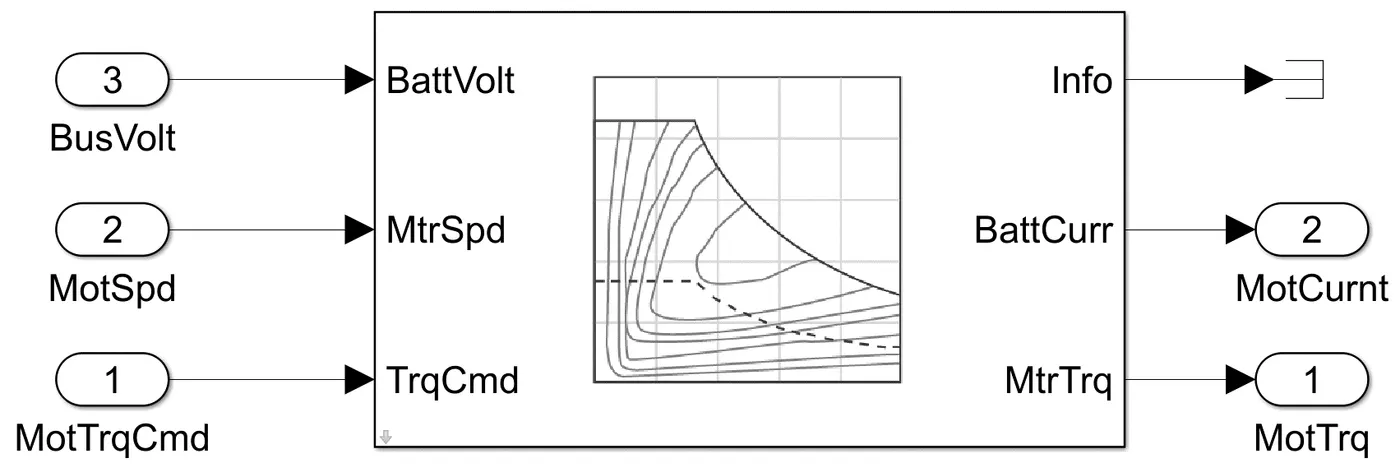
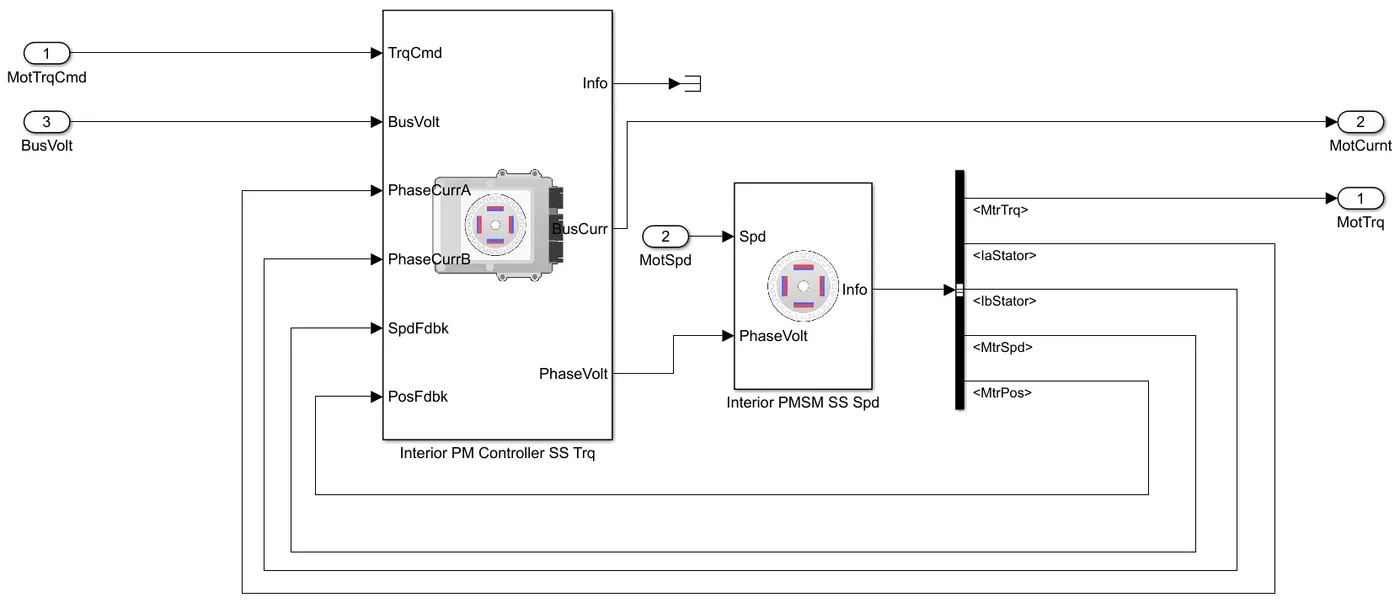
| Mapped | Dynamic |
| - Uses lookup tables to characterize component performance: the tables provide characteristics like fuel flow rate, rated torque and power, exhaust emissions, etc | - Decomposition of component behaviour into component characteristics that are separated into subsystems |
| - Used to study the effect of a factor on the entire simulation: for instance, impact of valve timing on the engine output | - Used to study the impact of individual components on the overall system performance |
| - To be done when engine data is available and for quasi steady-state simulations | - To be done when component level data is available |
| - Not run by real-time parameters as everything is stored in advance, so simulation time is low but so is accuracy | - Run by real outputs from all subsystems, so simulation will take a long time to finish since many individual processes are running within the entire system, but accuracy will also be high |
Changing model type:
HEV/EV Reference application > Passenger car > Electric plant > Generator/Motor > Right click > Variant > Override using > GenDynamic/GenMapped/MotDynamic/MotMapped
2) How does the model calculate miles per gallon? Which factors are considered to model fuel flow?
The three factors considered to model fuel flow are:
- Vehicle speed
- Fuel flow (only for HEV)
- Battery power
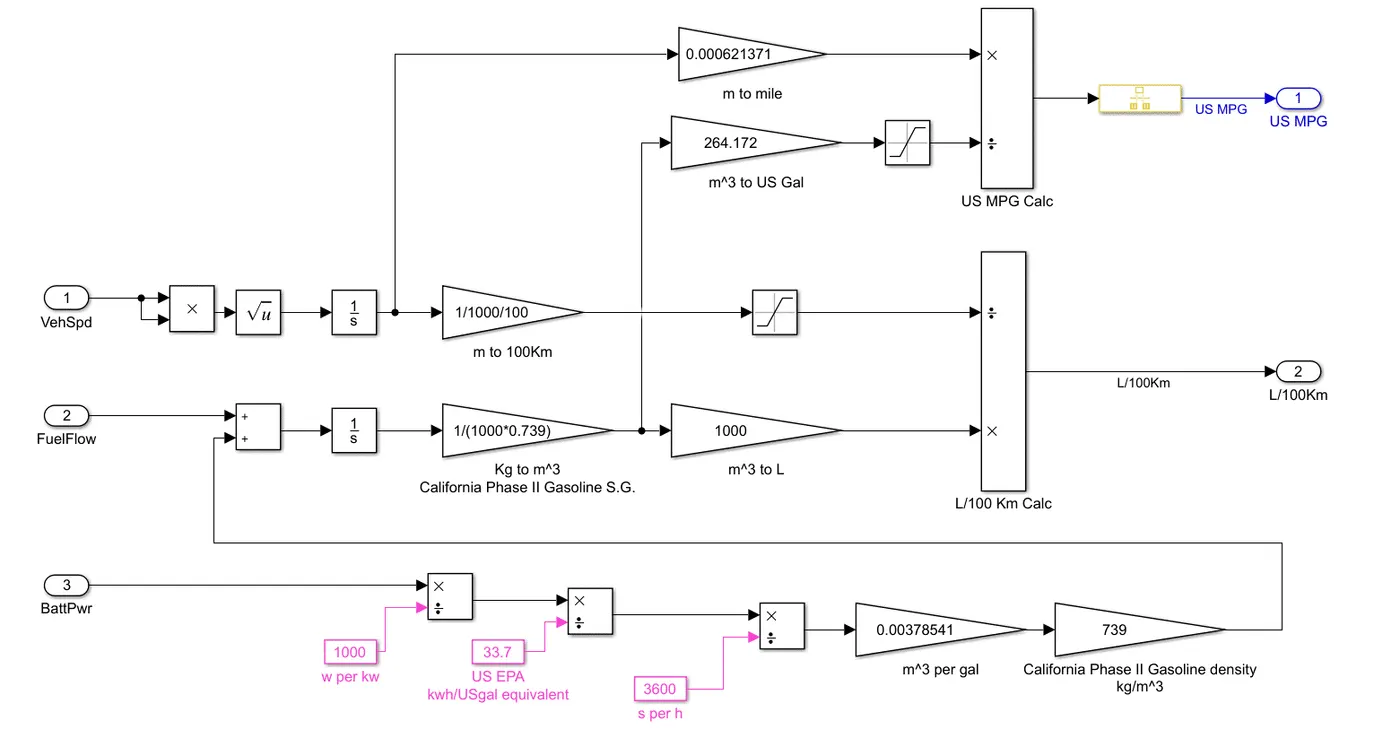
- Vehicle speed: the velocity of the vehicle is integrated to obtain total distance, and then converted to miles
- Battery power: given in Watt-hour, converted to kWh > divided by 33.7 since 1USG = 33.7kWh > USG > divided by 3600 to get USG/sec > multiplied with m3/USG to get m3/sec (volume flow rate) > multiplied with density to get mass flow rate (kg/sec) > merged with fuel flow calculations
- Fuel flow: given in mass flow rate (kg/sec) is integrated to obtain how much fuel is used in kg, and then converted to US gal
- Division of distance travelled (from vehicle speed) and volume of fuel (from fuel flow and battery power) leads to Miles per Gallon (MPG)
3) Run the HEV Reference Application with WOT drive cycle. Change the grade and wind velocity in the environment block. Comment on the results.
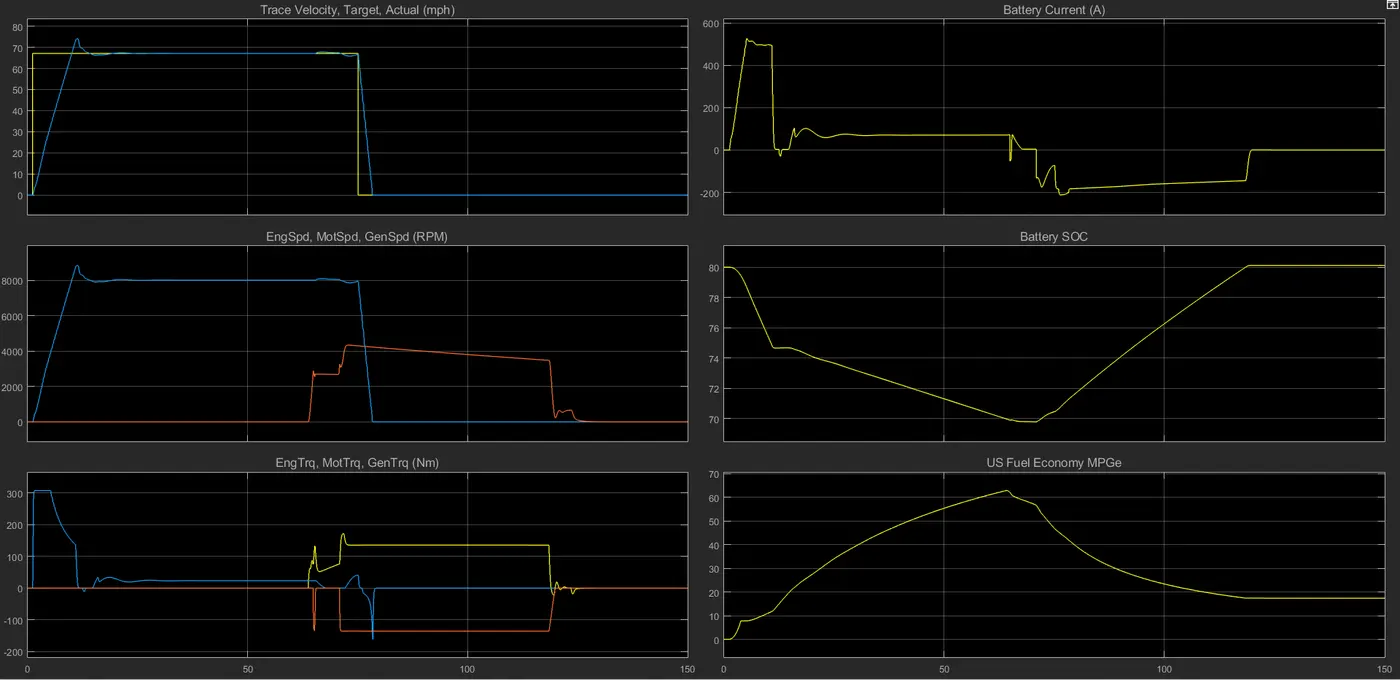
Model 1: HEV Reference Application with WOT drive cycle:
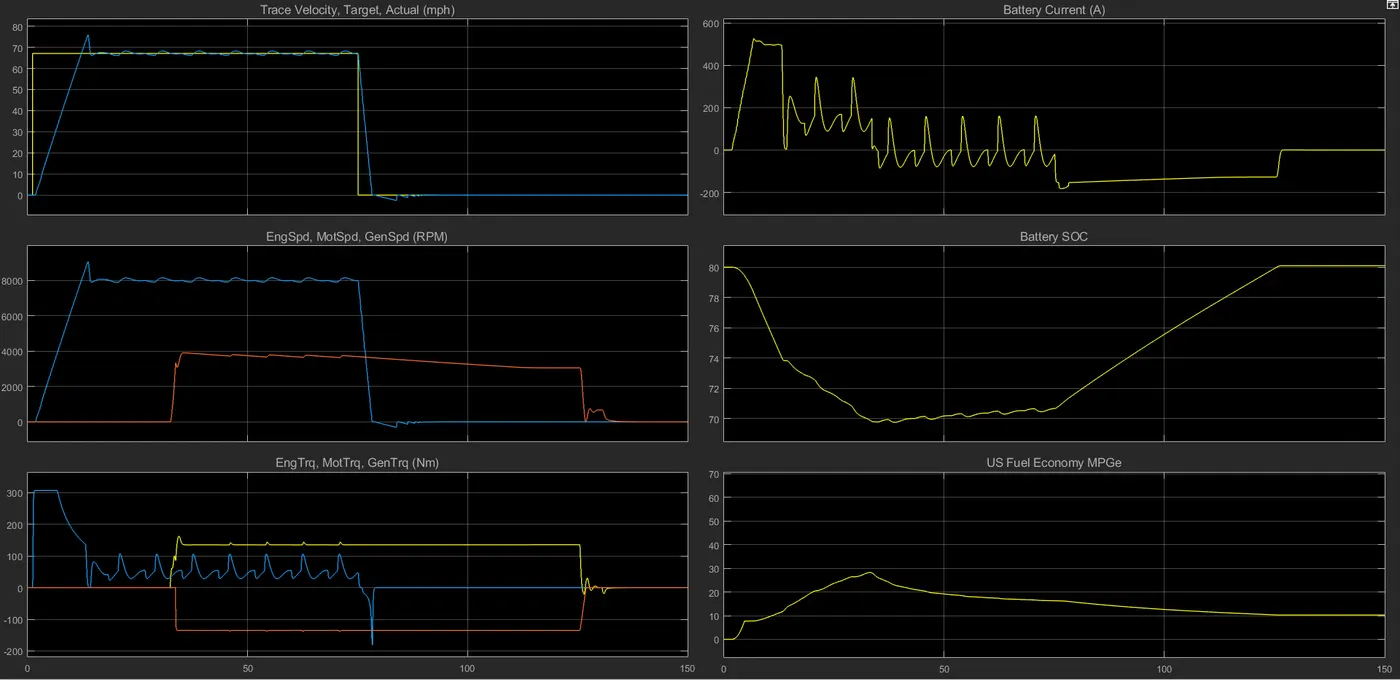
Model 2: HEV Reference Application with WOT drive cycle - gradeability of 2%, wind velocity of 5m/s incorporated:
| Parameters | Comparison of WOT Performance (with and without grade and wind resistance) |
| Velocity |
The difference in peak velocity is minimal, however, this should not be the case. The more the gradient slope and wind resistance, the lower the peak velocity the HEV is able to attain. Unfortunately the model does not run when the gradeability is more than 2%, so the effect of grade on peak velocity cannot be presented with the results. Time to reach peak velocity is 11 seconds in Model 1 and 14 seconds in Model 2 due to the added resistance the HEV needs to overcome. Deceleration starts halfway through the entire drive cycle at 75 seconds. |
| Speed of engine/motor/generator | The graphs of engine and motor are essentially the same for both models. The difference between the generator graphs is that the generator is activated at about 35 seconds as opposed to at 60 seconds, and that is due to the fact that the battery of the second model is depleted much more quickly, so the generator is required to come into use to charge the battery. |
| Torque of engine/motor/generator |
The difference is really between the motor torque of the two models. This makes sense because Model 1 is on a flat surface while Model 2 is running on a slope, thus needing constant torque input to keep the vehicle moving at constant speed, and hence the fluctuation in Model 2. The generator torque is negative due to the negative torque demand from the wheels that results from braking when the car is slowing down. |
| Battery SoC |
The initial 10% discharge from 80 to 70 takes about 70 seconds without grade and wind resistance, as opposed to about 35 seconds with grade and wind resistance. Climbing a slope and countering air drag will require greater energy from the engine and also the battery, hence using up battery power faster. In Model 1, once the battery power is depleted to 70%, it starts receiving charge immediately from the generator. In Model 2, however, once the battery is depleted to 70% at about 35 seconds, the battery is still fluctuating between charging and discharging until about 75 seconds. From speculation, this seems to be because the engine is not powerful enough to continue to keep the vehicle running at about 70m/s on a slope with wind resistance, which is why it does not let the battery recharge completely and continues to use battery power in bits and pieces. |
| Battery current |
Peak battery current at about 500A. The fluctuation in Model 2 comes from the fact that the control system constantly tries to draw in more power from the battery, since running at a slope trying to counter wind cannot be done by the engine alone. This is further explanation to why the battery SoC is depleted to 70% within 35 seconds only. In Model 1, the battery current hits its peak when the car needs to start and get going, and then is constant as it only needs to provide constant power from the battery to keep the vehicle running. A negative battery current implies that the battery is being charged as the motor starts to act like a generator. Instead of current flowing out of the positive terminal of the battery to the motor, the current flows into the positive terminal from the motor-turned-generator. |
| Fuel economy (MPG) | MPG is increasing in Model 1 up until about 60 seconds, because more battery power and less fuel is being used until the battery SoC is above 70%. Beyond this point, until about 120 seconds, the MPG is decreasing sharply, since the engine fuel is in use while the battery is being charged. Beyond 120 seconds, the MPG will steadily increase again as the battery can be the primary driver again, salvaging fuel MPG in Model 2 is increasing up until about 35 seconds, before the engine has to kick in and be the primary driver of the vehicle, since the battery has now depleted to 70%. |
4) Keeping all other parameters same, compare the simulated results of hybrid and pure electric powertrains.
HEV Reference Application with WOT drive cycle - gradeability of 2%, wind velocity of 5m/s:
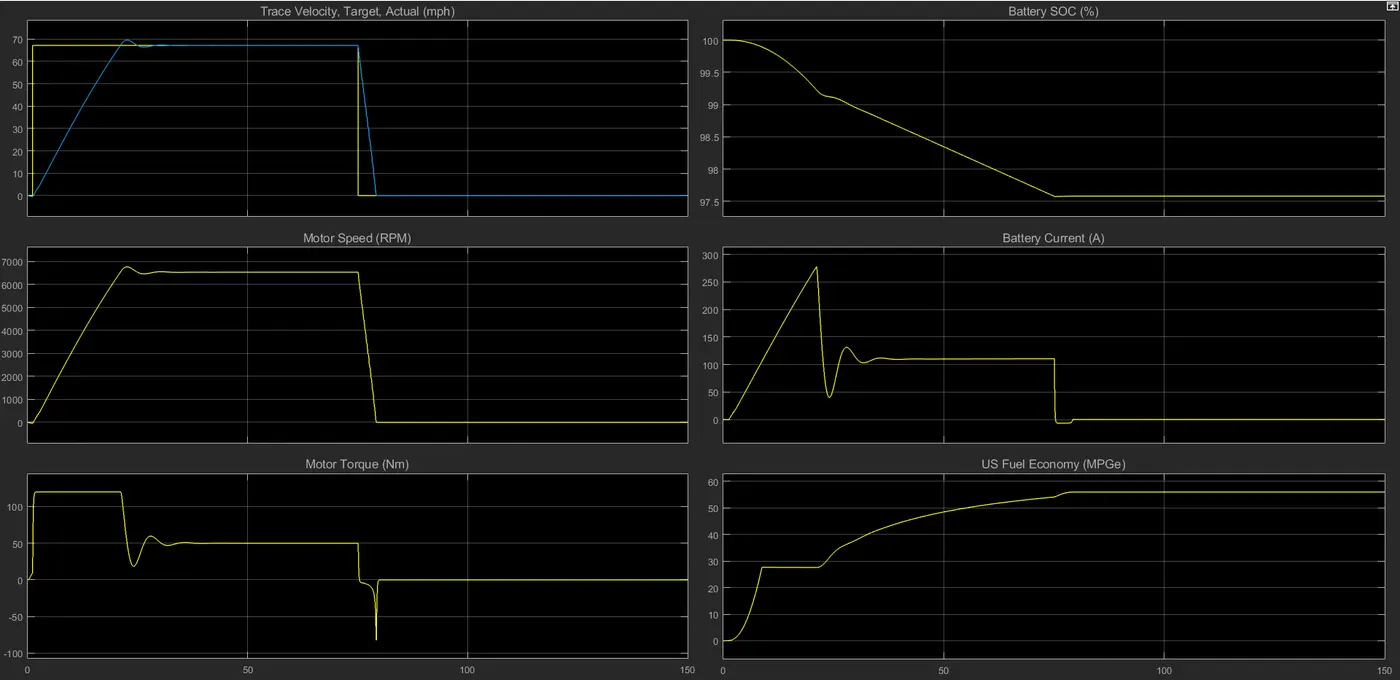
EV Reference Application with WOT drive cycle - gradeability of 2%, wind velocity of 5m/s:
| Parameters | Comparison of WOT Performance in HEV and EV (with grade and wind resistance) |
| Velocity | At full throttle, the HEV is able to reach a higher peak velocity than the EV. This has also to do with the discharge rate of the HEV battery, which is much faster than the EV battery, and that leads to higher top speed. |
| Speed of engine/motor/generator | Peak motor speed of HEV is almost 2000RPM higher than of EV, because the motor is powered by both battery and engine. |
| Torque of engine/motor/generator | Motor torque generated also much higher for HEV than for EV. This is not just because the torque generated in a HEV comes from both battery and engine, but also because of the battery's fast discharge rate, which allows the motor to produce high amount of torque instantly. |
| Battery SoC |
The battery capacity is almost 5 times as much for EV as it is for HEV, and that makes sense because the EV only runs on battery power while the HEV has engine for supplementation too. Although the same type of battery (Li-ion) is used for both models, the rate of discharge for the HEV is far greater than of the EV despite the same external conditions too. This is because the battery discharge transfer function is different for both of them, which is why we see a sharp reduction in the SoC of the HEV while the EV battery only discharges by 2.5% by the end of the simulation. |
| Battery current |
The peak current of the HEV battery is close to double the peak current of the EV battery, and this once again has to do with the fast discharge of the HEV battery. |
| Fuel economy (MPG) | Although no fuel is used for an EV, it estimates its fuel economy based on how much power it uses from the battery, which would be equivalent for an engine powered vehicle. The EV is more efficient and economical than the HEV as can be seen |