Week 9 - Senstivity Analysis Assignment
AIM
To write a code that takes all the reactions from the GRI mechanism and calculates 10 most sensitive reactions
Introduction
Sensitivity, can be computed by evaluating the normalized change in the ith dependent variable due to a normalized perturbation in the jth reaction rate, or more specifically the pre-exponential factor A. Therefore, sensitivity analysis can determine the influence of each reaction rate on a measurable quantity. Sensitivity analysis is often used to improve mechanisms and influence experimental and theoretical efforts
Theory
Sensitivity analysis
In combustion chemistry experiments, reaction rates are often extracted from complex experiments using detailed models. To aid in this process, experiments are performed such that measurable quantities, such as species concentrations, flame speed, and ignition delay, are sensitive to reaction rates of interest. In this work, a systematic method for determining such sensitized experimental conditions is demonstrated. An open-source python script was created using the Cantera module to simulate thousands of 0D and hundreds of 1D combustion chemistry experiments in parallel across a broad, user-defined range of mixture conditions. The results of the simulation are post-processed to normalize and compare sensitivity values among reactions and across initial conditions for time-varying and steady-state simulations, in order to determine the “most useful” experimental conditions.
Applications
The key application of sensitivity analysis is to indicate the sensitivity of simulation to uncertainties in the input values of the model. And also helps in identifying how dependent the output is on a particular input value. Analyses if the dependency in turn helps in assessing the risk associated.
Code explanation
The required modules were imported first
Secondly a Gas object is created which is an instance of the Solution class from GRI mech file
Then the initial condtions of the temperature, pressure and concentration is provided
Following it a IdealGAsConstantReactor is created and assigned to r
Since this is a iterative technique tolerances are set
Then the ReactorNet is created for progressing through the next time steps using the advance command
Following it the sensitivty command is used to find the sensitivity and the required top 10 reactions are found out using a for loop and if command
Finally the plots are plotted.
Program
import cantera as ct
import numpy as np
import matplotlib.pyplot as plt

gas =ct.Solution('gri30.cti')
temp=1500
pres=ct.one_atm
gas.TPX= temp,pres,{'CH4':1,'O2':2,'N2':7.52}
r=ct.IdealGasConstPressureReactor(gas)
sim=ct.ReactorNet([r])

reactions =gas.reaction_equations()
n_reac = gas.n_reactions

max_sens=[0]*n_reac

for i in range(n_reac):
	r.add_sensitivity_reaction(i)

sim.rtol=1e-6
sim.atol=1e-15

sim.rtol_sensitivity=1e-6
sim.atol_sensitivity=1e-6

states=ct.SolutionArray(gas,extra=['t'])
for t in np.arange(0,2e-3,5e-6):
	sim.advance(t)
	states.append(r.thermo.state,t=1000*t)
	for i in range(n_reac):
		s = sim.sensitivity('temperature',i)
		if np.abs(s)>=np.abs(max_sens[i]):
			max_sens[i]=s

top_n=10
max_abs_sens=np.abs(max_sens)
sens_maximum=sorted(max_abs_sens,reverse=True)
num_sensitivity=sens_maximum[0:top_n]
final_sensitivity=[]
index_r=[]
c=[]
for j in range(top_n):
	for k in range(n_reac):
		if np.abs(max_sens[k])==num_sensitivity[j]:
			final_sensitivity.append(max_sens[k])
			index_r.append(k)
			c+=gas.reaction_equations([k])
print(num_sensitivity)
print(final_sensitivity)
print(index_r)
print(c)

plt.figure(1)
plt.barh(c,final_sensitivity)
plt.yticks(fontsize=7)
plt.gca().invert_yaxis()
plt.xlabel('sensitivity')
plt.title('10 most temperature sensitive reaction in methane combustion')
plt.tight_layout()

plt.figure(2)
plt.subplot(2,2,1)
plt.plot(states.t,states.T)
plt.xlabel('time in ms)')
plt.ylabel('Temperature')
plt.title('temp vs time')
plt.subplot(2,2,2)
plt.plot(states.t,states('H').X)
plt.xlabel('time in ms')
plt.ylabel('[H]')
plt.title('H vs time')
plt.subplot(2,2,3)
plt.plot(states.t,states('OH').X)
plt.xlabel('time in ms')
plt.ylabel('[OH]')
plt.title('OH vs time')
plt.subplot(2,2,4)
plt.plot(states.t,states('CH4').X)
plt.xlabel('time in ms')
plt.ylabel('[CH4]')
plt.title('CH4 vs time')
plt.tight_layout()
plt.show()
Plots
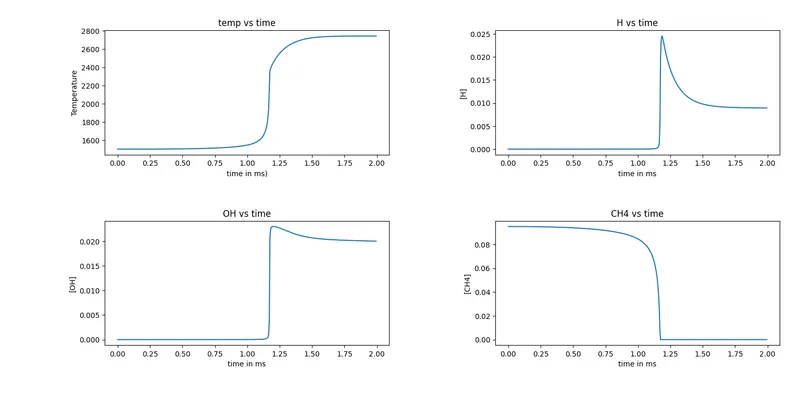
It can be seen that the OH's and H's mole fractions increase after the autoigntion while the CH4 mole fraction decreases.
Results
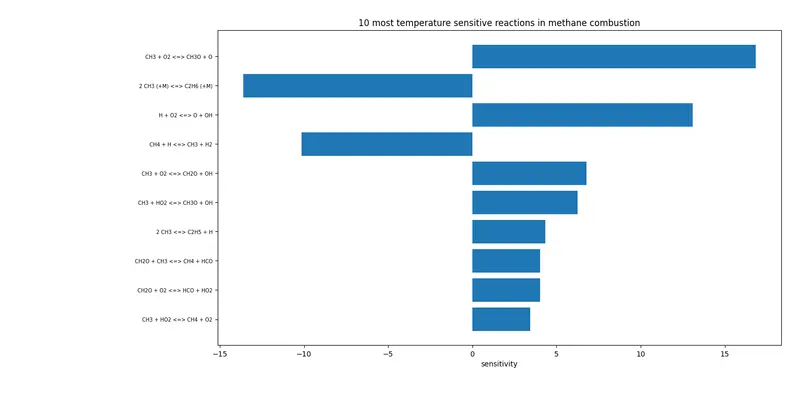
Sensitivity = [16.834746271574396, 13.607978099710168, 13.093666699161126, 10.149531587393733, 6.774794920779617, 6.2657321900135114, 4.341987098116956, 4.025933998424138, 4.023221297827201, 3.434430436084732]
[16.834746271574396, -13.607978099710168, 13.093666699161126, -10.149531587393733, 6.774794920779617, 6.2657321900135114, 4.341987098116956, 4.025933998424138, 4.023221297827201, 3.434430436084732]
Reactions ID= [154, 157, 37, 52, 155, 118, 158, 160, 31, 117]
Sensitivity = ['CH3 + O2 <=> CH3O + O', '2 CH3 (+M) <=> C2H6 (+M)', 'H + O2 <=> O + OH', 'CH4 + H <=> CH3 + H2', 'CH3 + O2 <=> CH2O + OH', 'CH3 + HO2 <=> CH3O + OH', '2 CH3 <=> C2H5 + H', 'CH2O + CH3 <=> CH4 + HCO', 'CH2O + O2 <=> HCO + HO2', 'CH3 + HO2 <=> CH4 + O2']
Positive sensitivity indicates that ignition delay is less and negative sensitivity indicates ignition delay is more.
Conclusion
Thus the code that takes all the reactions from the GRI mechanism and calculates 10 most sensitive reactions has been coded and explained.