Week 9 - Senstivity Analysis Assignment
Senstivity Analysis Assignment
Sensitivity analysis is defined as the process of making a relationship between the parameters and the output of the model.
The simple ODE for the effect of the reaction rate on temperature or species concentration is:
`(dZ)/(dt) = F(Z,t,a)`
`Z = (T, Y1, Y2, ....Yk)^T`
where, Z is a species and temperature vector.
The first order sensitivity is given as,
`W_(i,j)=(delZ_j)/(dela_i)`
where i is the reaction, a is the reaction rate multiplier & j is the independent variable.
Coding Methodology:
- The gas reaction is initialized from the gri30.xml mechanism file and initial temperature and pressure are given as 1500 k and one atm.
- The ideal gas constant pressure reactor 'r' is initialized and by using 'sim' command reactor network is made.
- Both absolute and relative tolerance sensitivities are given for making the solution converge.
- Array initialization for storing the thermodynamic properties of each reaction
- Updating the Solution marix.
- The sensitivity of each reaction are evaluated and maximum absolute values are stored.
- Sorting and figure display of top 10 sensitive reactions is done.
"""
Constant pressure, adiabatic simulation with sensitivity analysis
"""

import sys
import numpy as np
import cantera as ct
import matplotlib.pyplot as plt

gas = ct.Solution('gri30.xml')
temp = 1500
pres = ct.one_atm

gas.TPX  = temp, pres, 'CH4:1, O2:2, N2:7.52'
r= ct.IdealGasConstPressureReactor(gas, name= 'R1')
sim = ct.ReactorNet([r])

#enable sensitivity woth respect to the rates of first 10
# reactions (reaction 0 thru 9)

for i in range(325):
	r.add_sensitivity_reaction(i)
number_reaction = gas.n_reactions
reactions_equations = gas.reaction_equations()
reactions_num = np.arange(1,number_reaction+1)
#set tolerence for solution and sensitivity coefficients
sim.rtol = 1e-6 #relative change in solution should be less than this number
sim.atol = 1e-15 #absolute change in solution should be less than this number

sim.rtol_sensitivity = 1e-6 #relative change in sensitivity should be less than this number
sim.atol_sensitivity = 1e-6 #absolute change in sensitivity should be less than this number

states  = ct.SolutionArray(gas, extra = ['t'])
sensitivity_temp = [0]*number_reaction

for t in np.arange(0,2e-3, 5e-6):
	sim.advance(t)
	for j in range(number_reaction):
		gradient = sim.sensitivity('temperature', j)
		if abs(gradient) >= abs(sensitivity_temp[j]):
			sensitivity_temp[j] = gradient

	states.append(r.thermo.state, t=1000*t)


zipped_pair = sorted(zip(np.abs(sensitivity_temp), reactions_equations, reactions_num, sensitivity_temp), reverse= True)

max_sensitivity, max_reactions, max_reaction_number, actual_sensitivity_temp = zip(*zipped_pair)

rplot = max_reactions[0:10]
rid_plot = max_reaction_number[0:10]
splot = actual_sensitivity_temp[0:10]

print('The top 10 temperature sensitive reactions are:')
print('Reaction ID','|', 'Reaction','|', 'Sensitivity')
for i in range(10):
	print(rid_plot[i],'|', rplot[i],'|', splot[i])

plt.subplot(2,2,1)
plt.plot(states.t, states.T)
plt.xlabel('Time (ms)')
plt.ylabel('Temperature (K)')

plt.subplot(2,2,2)
plt.plot(states.t, states('OH').X)
plt.xlabel('Time (ms)')
plt.ylabel('OH Mole Fraction')

plt.subplot(2,2,3)
plt.plot(states.t, states('H').X)
plt.xlabel('Time (ms)')
plt.ylabel('H Mole Fraction')

plt.subplot(2,2,4)
plt.plot(states.t, states('CH4').X)
plt.xlabel('Time (ms)')
plt.ylabel('CH4 Mole Fraction')
plt.show()


plt.figure(2)
plt.barh(rplot, splot, 0.5, align='center', color='black')
plt.gca().invert_yaxis()
plt.xlabel('Sensitivity')
plt.ylabel('Reactions')
plt.title('Top 10 temperature sensitive reactions of grimech3.0')
plt.grid()
plt.tight_layout()
plt.show()
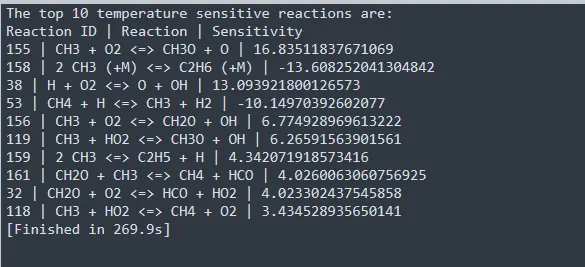
The Output showing values of top 10 sensitive reactions is:
Bar Graph:
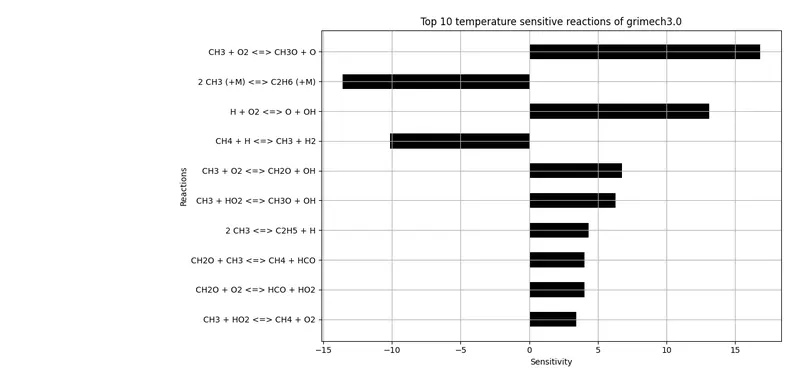
From the bar graph, positive as well as negative sensitivity can be seen. positive sensitivity shows that with the rise in temperature of the reaction, reaction rate increases and faster combustion is supported. It leads to decrease in Ignition delay time.
As the reaction sensitivity is negative, their reaction rate decreases with an increase in temperature and thus Ignition delay increases.
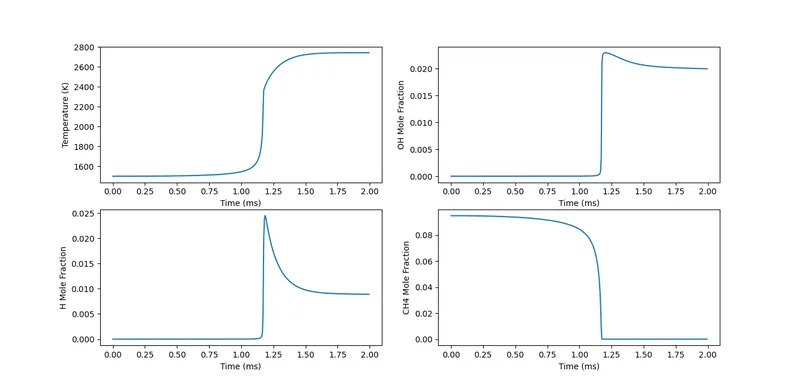
The above image shows the variation of the temperature and molar concentrations of OH, H, CH4 wit respect to increase in time.