Week 9 - Senstivity Analysis Assignment
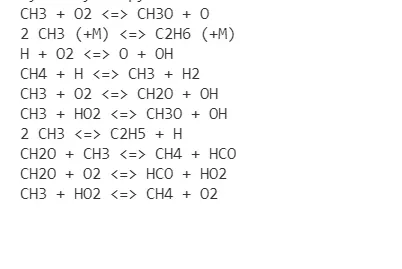
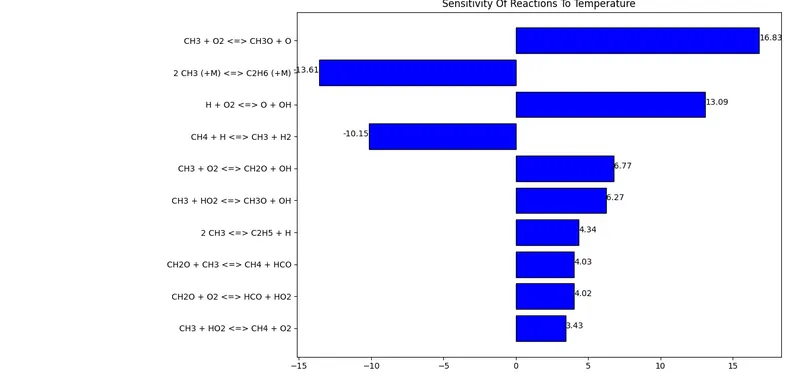
Aim: To write a code that takes all the reactions from the gri30 mechanism file and gives top 10 most sensitive reaction with respect to temperature.
PYTHON PROGRAMME
import matplotlib.pyplot as plt
import numpy as np
import cantera as ct

gas = ct.Solution('gri30.yaml')
Temp=1500
pre=ct.one_atm

gas.TPX=Temp,pre,{'CH4':1,'O2':2 ,'N2':7.52}
r=ct.IdealGasConstPressureReactor(gas,name='R1')
sim=ct.ReactorNet([r])

# it gives the list of all the reactions
reaction_eqn=gas.reaction_equations()

# we need number of reactions
# here we can specify how many reaction we want for the sensitivity analysis
no_reaction=gas.n_reactions


#  enable the senstivity for all the reactions

for i in range(no_reaction):
    r.add_sensitivity_reaction(i)


# there are two ode systems one is for the species ode and other is for the sensitivity ode

# set the tolerence for the solution and for the sensitivity coefficient
# tolerence for the species ode

sim.rtol=1e-6  #relative change in solution should be less than this number
sim.atol=1e-15  #absolute change is solution should be less than this number

# tolerance for the sensitivity ode
sim.rtol_sensitivity=1e-6   # relative change of sensitivity should be less than this number
sim.atol_sensitivity=1e-6   # absolute change of sensitivity should be less than this number

states=ct.SolutionArray(gas,extra=['t'])

# for appending the sensitivity values for all the reaction at the end
sensitivity_temp=[0]*no_reaction

# integrating for 2 milisecond steps of 5e-6
for t in np.arange(0,2e-3,5e-6):
    sim.advance(t)
    for j in range(no_reaction):
        gradient=sim.sensitivity("temperature",j)
        if abs(gradient)>=abs(sensitivity_temp[j]):
            sensitivity_temp[j]=gradient

    states.append(r.thermo.state , t=1000*t )

#giving the number to reactions from 1 to END

reaction_num=np.arange(1,no_reaction+1)
abs_sens=np.abs(sensitivity_temp)
v=sorted(zip(abs_sens, reaction_eqn, reaction_num, sensitivity_temp ),reverse=True)
sort_sensitivity, sort_reactions, sort_num, sort_act_sensi=zip(*v)
# print list in one column
print(*sort_reactions[0:10],sep="\n")

plt.figure(2)

plt.barh(sort_reactions[0:10],sort_act_sensi[0:10],fc="blue",ec="black")
plt.gca().invert_yaxis()
plt.tight_layout()
for i in range(10):
    if sort_act_sensi[i]>0:
        plt.text(sort_act_sensi[i],sort_reactions[i],str(round(sort_act_sensi[i],2)),ha="left")
    else:
        plt.text(sort_act_sensi[i],sort_reactions[i],str(round(sort_act_sensi[i],2)),ha="right")

plt.title("Sensitivity Of Reactions To Temperature")
plt.show()
OUTPUT