Project 1 - Parsing NASA thermodynamic data
AIM: "To parse NASA thermodynamic data from the text file using matlab code"
Objective: To write a code in Matlab that can extract the 14 coefficient from the text file and calculate enthalpy, entropy, specific heat for all the species in the text file.
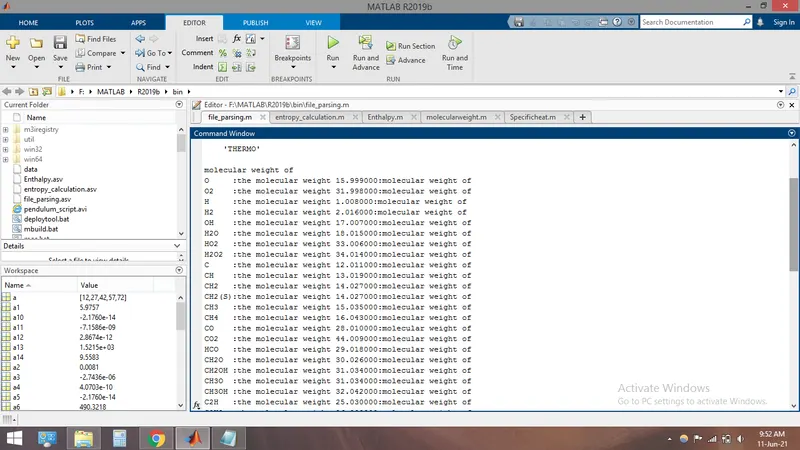
To display the molecular weight in command window
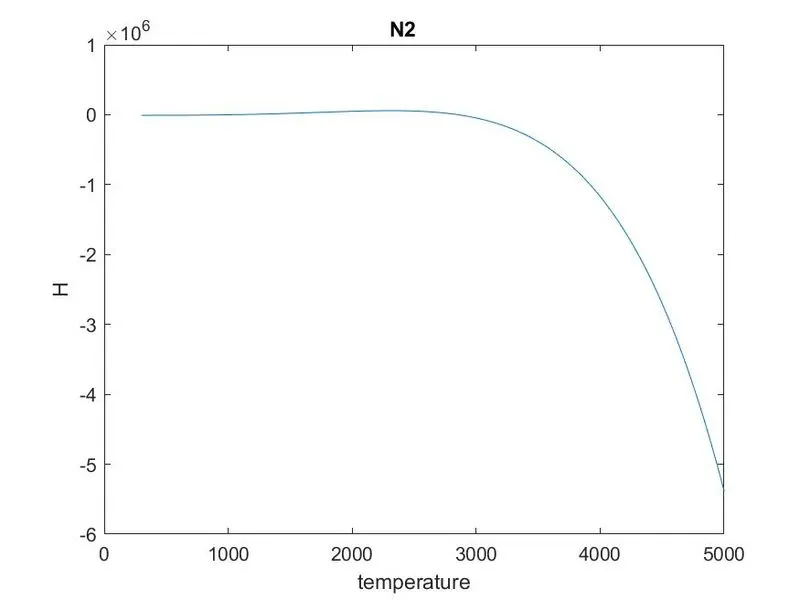
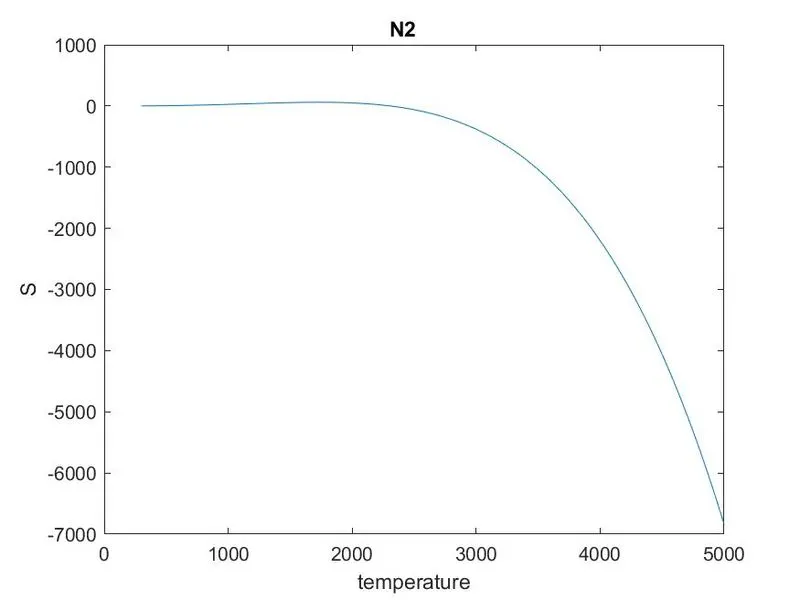
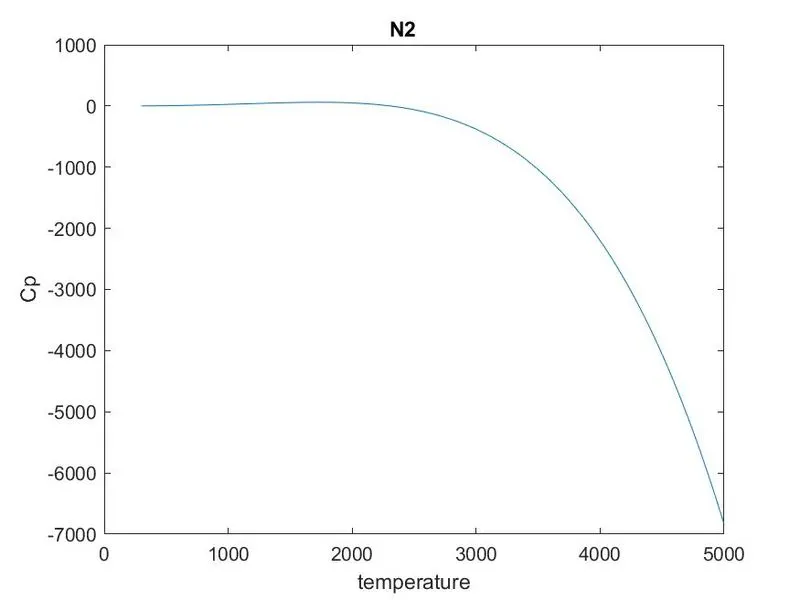
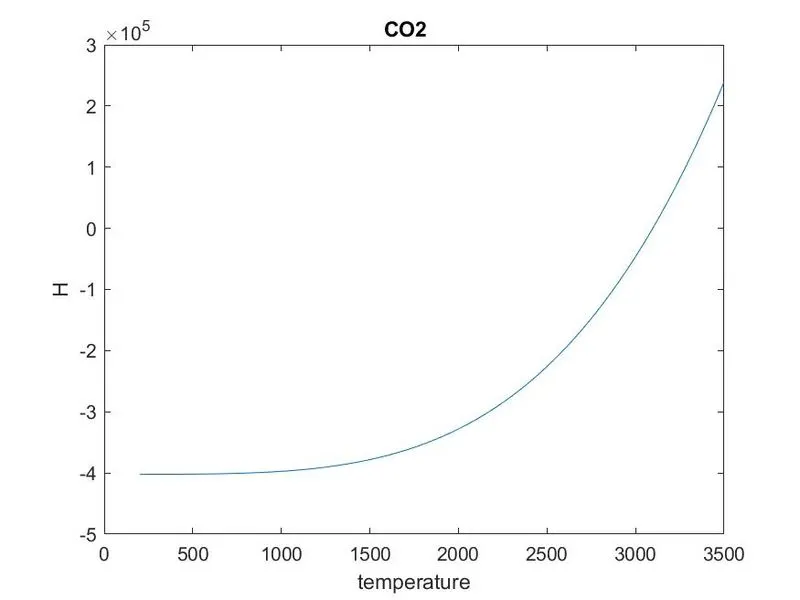
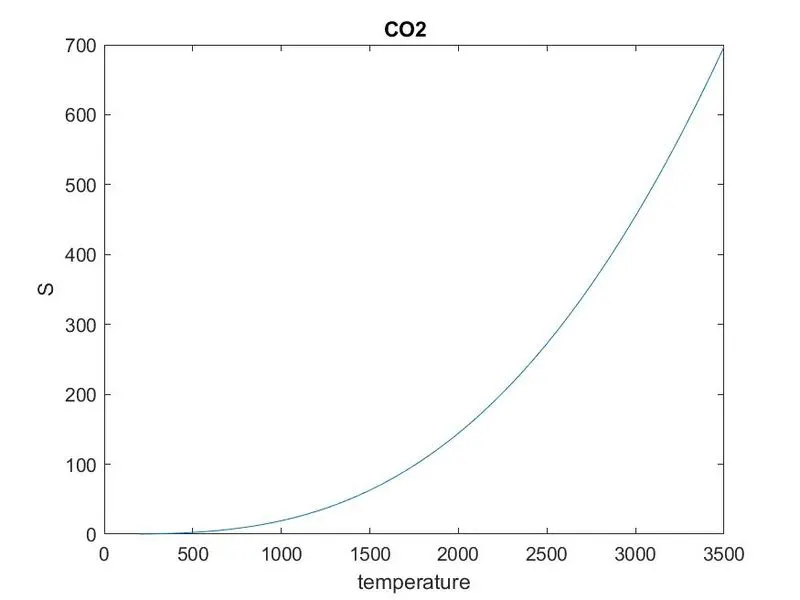
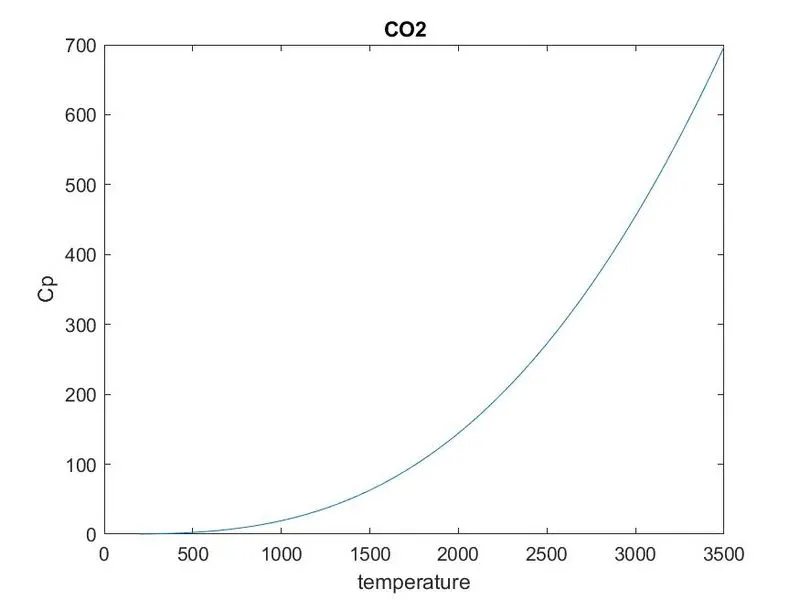
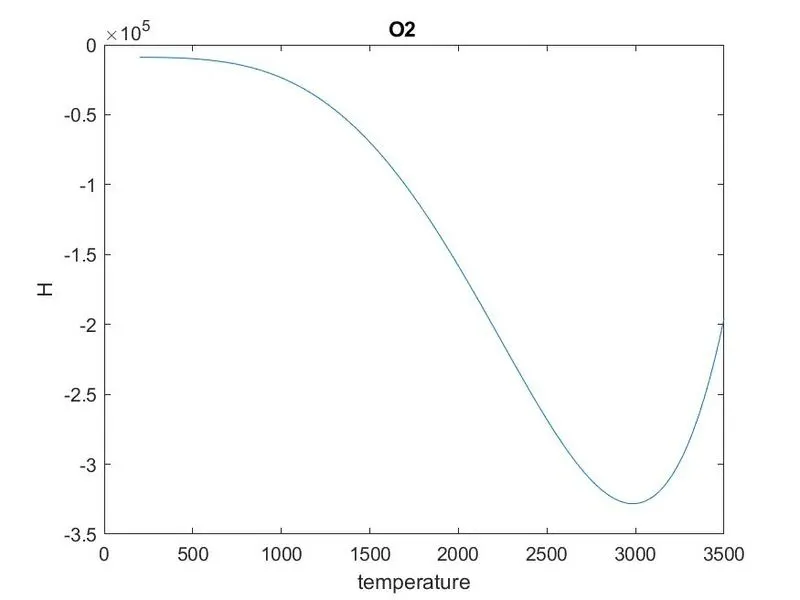
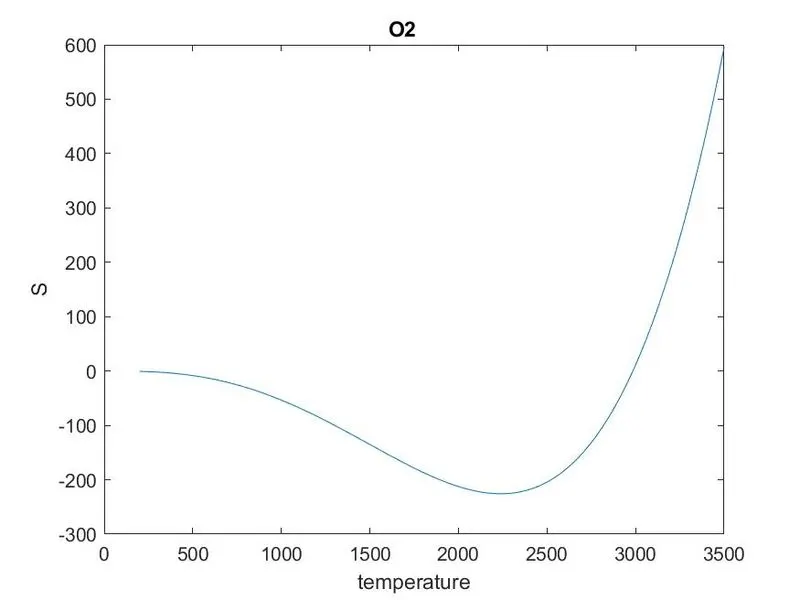
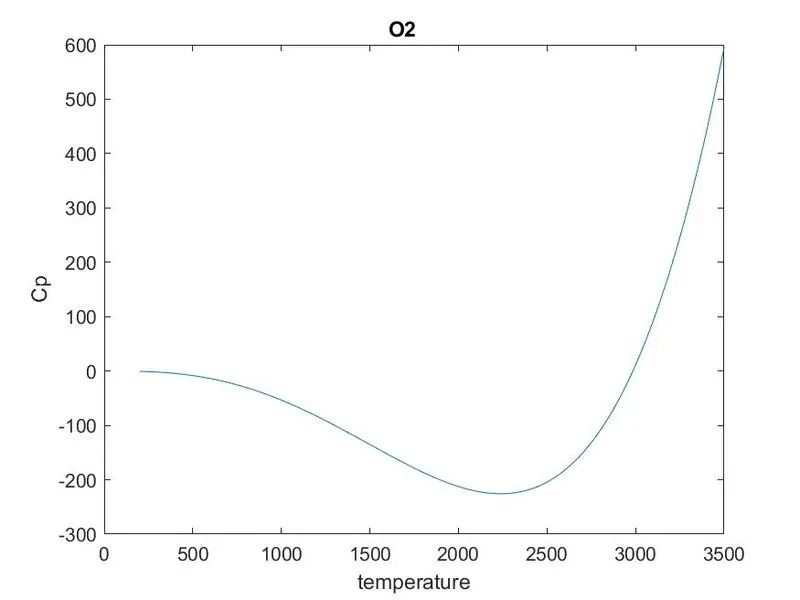
To plot the graph for the enthalpy,entropy and specific heat vs temperature for CO2,O2 and N2
The polynomials for calculating the quantities are given as
Cp/R =a1 + a2 T + a3 T^2 + a4 T^3 + a5 T^4
H /RT= a1 + a2 T/2 + a3 T^2/3 + a4 T^3/4 + a5 T^4/5 +a6/T
S/R=a1 lnT + a2 T + a3 T^2 /2+ a4 T^3/3 + a5 T^4/4+a7
R=universal gas constant
T=temperature
There are 14 coefficient in which first 7 coefficient are of the high temperature coefficient for temperature above 1000K and the second 7 coefficient are of the low temperature for temperature below 1000K
function for extracting the data specific heat
function Cp=Specificheat(a1,a2,a3,a4,a5,a8,a9,a10,a11,a12,temperature,R,Tm1)

if temperature<=Tm1

    Cp=R*(a8+a9.*temperature+a10.*temperature.^2+a11.*temperature.^3+a12.*temperature.^4);

else

    Cp=R*(a1+a2.*temperature+a3.*temperature.^2+a4.*temperature.^3+a5.*temperature.^4);
end
function for extracting the data enthalpy
function H=Enthalpy(a1,a2,a3,a4,a5,a6,a8,a9,a10,a11,a12,a13,temperature,R,Tm1)

if temperature<=Tm1

    H=R.*temperature.*(a8+(a9.*temperature)./2+(a10.*temperature.^2)./3+(a11.*temperature.^3)./4+(a12.*temperature.^4)/5+(a13./temperature));

else

    H=R.*temperature.*(a1+(a2.*temperature)./2+(a3.*temperature.^2)./3+(a4.*temperature.^3)./4+(a5.*temperature.^4)/5+(a6./temperature));

end
function for extracting the data entropy
function S=entropy_calculation(a1,a2,a3,a4,a5,a6,a7,a8,a9,a10,a11,a12,a14,temperature,R,Tm1)


 if temperature<=Tm1

      S=R*((a8.*log(temperature)+(a9.*(temperature))+(a10.*temperature.^2)./2+(a11.*temperature.^3 )./3+(a12.*temperature.^4)./4)+a14);
 else
     S=R*(a1.*log(temperature)+(a2.*(temperature))+(a3.*temperature.^2)./2+(a4.*temperature.^3 )./3+(a5.*temperature.^4)./4+a7);
 end
function for extracting the data molecular weight
function Molecular_weight=molecularweight(species)

   atom_name=['H' 'C' 'O' 'N' 'A'];

    fprintf('molecular weight of n');
    fprintf (species);
    fprintf(':');

   atomic_weight=[1.008 12.011 15.999 14.007 39.948];

   Molecular_weight=0;

   for i=1:length(species)

            for j=1:length(atom_name)


                if strcmpi(species(i),atom_name(j));

                    Molecular_weight=Molecular_weight+atomic_weight(j);

                    position=j;

                end

            end

            n=str2num(species(i));

            if n>1

                Molecular_weight=Molecular_weight+atomic_weight(position)*(n-1);
            end
   end


   fprintf('the molecular weight %f:',Molecular_weight);
end
main code
clear all
close all
clc


f1=fopen('THERMO.dat','r')     %opening the data file
gt=fgetl(f1)                    %getting the first line


global_temp=fgetl(f1);     %getting the second line

  t=strsplit(global_temp);   %for splitting the values
 R=8.314;

%for skipping the three lines
for i=1:3

    gt=fgetl(f1);

end

for j=1:53
%extracting the temperatures
species=fgetl(f1);
p=strfind(species,'.');

T1=species(p(1)-3:p(1)+3);
Tl1=str2num(T1);

T2=species(p(2)-4:p(2)+3);
Th1=str2num(T2);

T3=species(p(3)-4:p(3)+3);
Tm1=str2num(T3);

species=species(1:6);

%creating the array of temperature
temperature=linspace(Tl1,Th1,1000);

%extractin the coefficients
     line_1=fgetl(f1);
     a=strfind(line_1,'E');

     a1=line_1(1:a(1)+3);
     a1=str2num(a1);

     a2=line_1(a(1)+4:a(2)+3);
     a2=str2num(a2);

     a3=line_1(a(2)+4:a(3)+3);
     a3=str2num(a3);

     a4=line_1(a(3)+4:a(4)+3);
     a4=str2num(a4);

     a5=line_1(a(4)+4:a(5)+3);
     a5=str2num(a5);


     line_2=fgetl(f1);
     b=strfind(line_1,'E');
     a6=line_2(1:a(1)+3);
     a6=str2num(a6);
     a7=line_2(a(1)+4:b(2)+3);
     a7=str2num(a7);


     a8=line_1(b(2)+4:b(3)+3);
     a8=str2num(a8);
     a9=line_1(b(3)+4:b(4)+3);
     a9=str2num(a9);
     a10=line_1(b(4)+4:b(5)+3);
     a10=str2num(a10);


     line_3=fgetl(f1);
     c=strfind(line_1,'E');

     a11=line_3(1:c(1)+3);
     a11=str2num(a11);
     a12=line_3(c(1)+4:c(2)+3);
     a12=str2num(a12);
     a13=line_3(c(2)+4:c(3)+3);
     a13=str2num(a13);
     a14=line_3(c(3)+4:c(4)+3);
     a14=str2num(a14);

       Cp=Specificheat(a1,a2,a3,a4,a5,a8,a9,a10,a11,a12,temperature,R,Th1);

       H=Enthalpy(a1,a2,a3,a4,a5,a6,a8,a9,a10,a11,a12,a13,temperature,R,Th1);

       S=entropy_calculation(a1,a2,a3,a4,a5,a6,a7,a8,a9,a10,a11,a12,a14,temperature,R,Th1);


      mkdir('I:skill lync',species)

      figure(1);
      plot(temperature,Cp)
      xlabel('temperature')
      ylabel('Cp')
      title(species)

              figure(2);
              plot(temperature,H)
              xlabel('temperature')
              ylabel('H')
              title(species)

                      figure(3);
                      plot(temperature,Cp)
                      xlabel('temperature')
                      ylabel('S')
                      title(species)
                      program=(['I:skill lync',species]);
                       cd(program)

      saveas(1,'specific_heat','jpg')
      saveas(2,'enthalpy','jpg')
      saveas(3,'entropy','jpg')
         cd('F:MATLABR2019bbin')
      Molecular_weight(j)=molecularweight(species);


end
fclose(f1)
stepwise explanation of the main code
1)open the file name as thermo.dat with fopen.
2)read the line with the help of fgetl command .
3)for skipping the three lines which are comments "for" loop is used.
4)for getting the coefficient and the name of the species we use for loop for the 4 lines that means that for the four lines this loop will give the coefficient for the one species than for the second four lines the gives the coefficient for second species.
5)than the function of the specific heat ,enthalpy ,entropy and the molecular weight are called and the values of that quantities are calculated.
6)making the directory for each species with help of the mkdir command.
7)for each species the graph of Cp,H,S are plotted with respect to temperature.
8)plots are saved using the saveas command.
output
screenshot of directory where all files are saved

molecular weight on command line
plots of co2
plots of O2
plots of N2