Week 9 - Senstivity Analysis Assignment
Aim --> Sensitivity Analysis of Methane Combustion reactions in GRI 3.0 Mechanism.
objective -->
- Write a code that takes all the reactions from the GRI mechanism and calculates the 10 most sensitive reactions.
- The sensitivity parameter should be with respect to the Temperature (It should find the sensitivity with respect to the temperature)
- Consider the initial conditions. The program should be parametric, It is should be intuitive and easy to obtain the 'n' number of sensitive reactions with respect to the asked parameter, by simply changing a number.
Theory -->
Sensitivity is the process of finding the relationship between some parameters and the output of a model. In this project, we want to figure out the sensitivity of a reaction mechanism (CH4 methane combustion reaction model) containing 325 intermediate reactions, relative to the Temperature change. Thus, we want to find out 10 chemical reactions that are most sensitive to Temperature change. Sensitivity Analysis also helps us to study ignition delay, it gives us the sensitivity of a chemical reaction on Ignition delay. This is one reason why we use Temperature as a parameter for Sensitivity Analysis. At the end of this process, we know which chemical reactions are most sensitive to operating conditions like Temperature, Pressure, species concentration etc. and which relations are least sensitive. Thus, tuning a reaction mechanism becomes easy for a chemist.
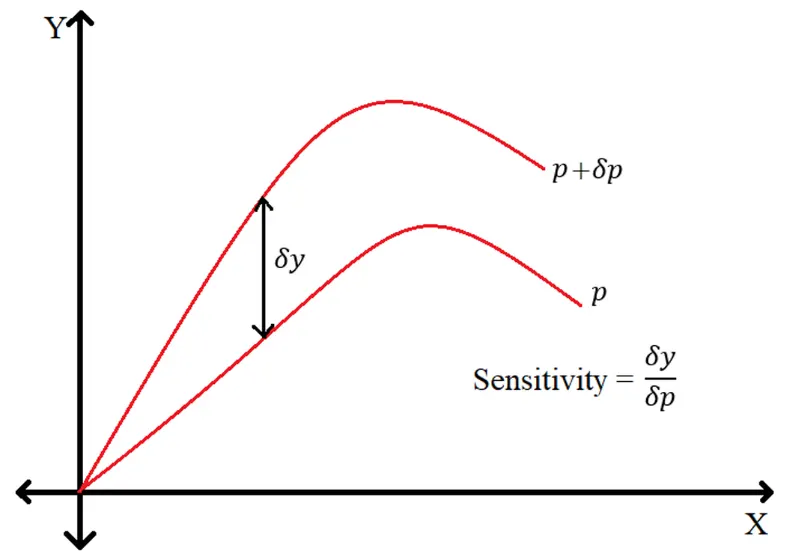
The above figure represents a function Y(X,p) where X is the independent variable and p is the parameter. When p --> p+δp we get δ(y) as the variation in Y. Then sensitivity is defined as δ(y)/δ(p). Similarly, sensitivity w.r.t other parameters can also be found and we can control or tune the reaction mechanism by varying these parameters, to get the desired output.
# Constant pressure adiabatic chemical kinetics with sensitivity analysis

import cantera as ct
import matplotlib.pyplot as plt
import numpy as np

# defining the gas
gas = ct.Solution('gri30.xml')
T=1500
P=ct.one_atm
gas.TPX = T, P, {'CH4':1,'O2':2,'N2':7.52}
N=10
r=ct.IdealGasConstPressureReactor(gas, name='R1')
sim=ct.ReactorNet([r])
rxn = gas.reaction_equations()
n = gas.n_reactions
rxn_id = np.linspace(1,n,n)
#help(gas.n_reactions)
#print(n)
for i in range(n):
	r.add_sensitivity_reaction(i)

#Seting the tolerance for the solutions and sensitivity coefficient
sim.rtol = 1e-6 # Relative change in solution should be lower than this number
sim.atol = 1e-15# Absolute change in solution should be lower than this number

sim.rtol_sensitivity = 1e-6# Relative change in Sensitivity Coefficient should be lower than this number
sim.atol_sensitivity = 1e-6# Absolute change in Sensitivity Coefficient should be lower than this number

ST_max = [0]*n
states = ct.SolutionArray(gas, extra=['t'])
for t in np.arange(0,2e-3,5e-6):
	sim.advance(t)
	states.append(r.thermo.state, t=1000*t)
	for j in range(n):
		ST=sim.sensitivity('temperature',j)
		if np.abs(ST) >= np.abs(ST_max[j]):
			ST_max[j] = ST

# Sorting the reaction and sensitivity
rxn_sensitivity = [a for b, a in sorted(zip(np.abs(ST_max),rxn), reverse=True)]
rxn_id_sensitivity = [a for b, a in sorted(zip(np.abs(ST_max),rxn_id), reverse=True)]
ST_max_sensitivity = [a for b, a in sorted(zip(np.abs(ST_max),ST_max), reverse=True)]

r_ST_max = ST_max_sensitivity[0:N]
r_rxn = rxn_sensitivity[0:N]
r_rnx_id = rxn_id_sensitivity[0:N]

# Extracting the concentration of OH H H2O
OH=states.X[:, states.species_index('OH')]
H=states.X[:, states.species_index('H')]
CH4=states.X[:, states.species_index('CH4')]

# plotting the values
print('Top 10 Temperature sensitivity reactions are as follows:')
print('----------------------------------------------------------')
print('%s %1s %16s %16s %s' % ('Reaction ID','|','Reaction','|','Sensitivity'))
print('----------------------------------------------------------')
for i in range(N):
	print('%d %9s %25s %7s %s' % (r_rnx_id[i],'|',r_rxn[i],'|',r_ST_max[i]))
print('----------------------------------------------------------')
# Ploting the results
plt.figure(1)
plt.subplot(2,2,1)
plt.plot(states.t, states.T)
plt.xlabel('time')
plt.ylabel('temperature variation and ignition delay')
plt.grid('on')
plt.subplot(2,2,2)
plt.plot(states.t, states('OH').X)
plt.xlabel('time')
plt.ylabel('Concentration of OH')
plt.grid('on')
plt.subplot(2,2,3)
plt.plot(states.t, states('H').X)
plt.xlabel('time')
plt.ylabel('Concentration of H')
plt.grid('on')
plt.subplot(2,2,4)
plt.plot(states.t, states('CH4').X)
plt.xlabel('time')
plt.ylabel('Concentration of CH4')
plt.grid('on')
# Ploting the results
plt.figure(2)
plt.barh(r_rxn,r_ST_max,0.5,align='center',color='black')
plt.grid('on')
plt.xlabel('Temperature sensitivity',fontsize=10,fontweight='bold')
plt.ylabel('chemical reactions',fontsize=10,fontweight='bold')
plt.title('10 most temperature sensitive reactions in GRI 3.0 for CH4 Combustion',fontsize=10,fontweight='bold')
plt.show()
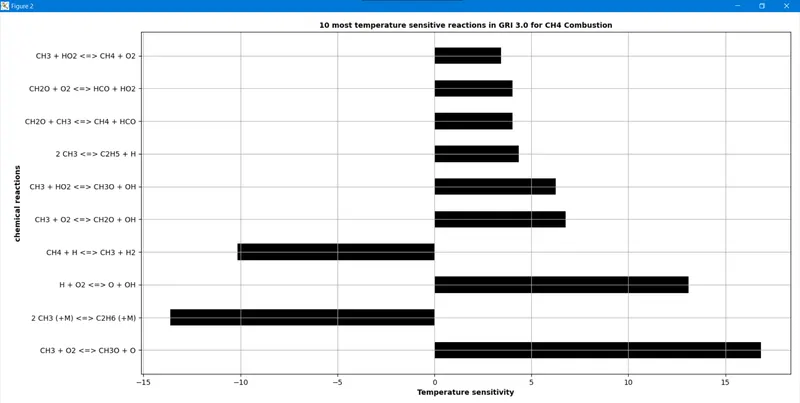
--> The list of top 10 most sensitive chemical reactions in GRI 3.0 Mechanism for CH4 combustion w.r.t Temperature (parameter) are as follows.
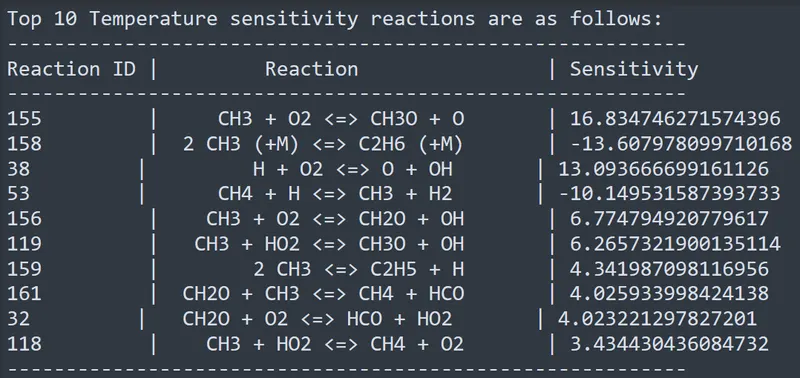
--> Following bar graph shows sensitivity values for 10 reactions. A positive sensitivity value indicates an increase in the rate of the chemical reaction and a negative value indicated a decrease in the rate of that particular reaction. So, with a change in temperature, we have a change in the rate of reactions.
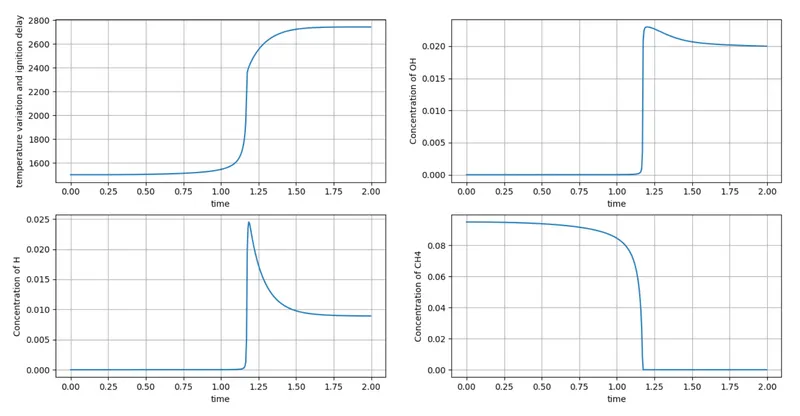
--> The following plot shows variations in Temperature, [H, OH, CH4] mole fraction concentration as the mechanism progresses in time. We can see a sudden jump in the parameters, this signifies the Ignition delay or auto-ignition.