Week 9 - Senstivity Analysis Assignment
SENSITIVITY ANALYSIS ASSIGNMENT
AIM: to write a code that takes all the reactions from the GRI mechanism and calculates the 10 most sensitive reactions.
OBJECTIVE:
- Write a code that takes all the reactions from the GRI mechanism and calculates the 10 most sensitive reactions.
- The sensitivity parameter should be with respect to the Temperature (It should find the sensitivity with respect to the temperature not 'OH' as shown in the video).
- Consider the initial conditions as shown in the video.
- Your program should show the reaction strings in the order of greatest sensitivity to the least sensitivity.
THEORY:
Sensitivity analysis: Parameters in the heat conduction equation are frequently modeled as temperature-dependent. Thermal conductivity, volumetric heat capacity, convection coefficient, emissivity, and volumetric source terms are parameters that may depend on temperature. Many applications, such as parameter estimations, optical experimental design, optimization, and uncertainty analysis, require sensitivity to the parameters describing temperature-dependent properties. A general procedure to compute the sensitivity of the temperature field to model parameters for nonlinear heat conduction is studied. Parameters are modeled as an arbitrary function of temperature. Sensitivity equations are implemented in an unstructured grid, element-based numerical solver. The objectives of this study are to describe the methodology to derive a sensitivity equation for the temperature-dependent parameters and present demonstration calculations. In addition to a verification problem, the design of an experiment to estimate temperature variable thermal properties is discussed.
Sensitivity analysis is a method for predicting the outcome of a decision if a situation turns out tobe different compared to the key predictions. It helps in assessing the riskiness of a strategy. Helps in identifying how dependent the output is on a particular input value.
CODE AND SOLUTION:
The python code for sensitivity analysis:
import numpy as np
import cantera as ct
import matplotlib.pyplot as plt


gas= ct.Solution("gri30.xml")
Temp=1500
Pressure=ct.one_atm
gas.TPX = Temp,Pressure,{'CH4':1,'O2':2,'N2':7.52}
r = ct.IdealGasConstPressureReactor(gas, name='R1')

# Reactor Network
sim = ct.ReactorNet([r])
n = gas.n_reactions


for i in range(n):
	r.add_sensitivity_reaction(i)


# Relative and absolute tolerances for solution and sensitivity analysis
sim.rtol = 1e-06
sim.atol = 1e-15

sim.rtol_sensitivity= 1e-06
sim.atol_sensitivity= 1e-06

states = ct.SolutionArray(gas, extra =['t'])

maxi = [0]*n

for t in np.arange(0,2e-3,5e-6):
	sim.advance(t)
	for i in range(n):
		s = sim.sensitivity('temperature',i)
		if(abs(s)>abs(maxi[i])):
			maxi[i] = s
	states.append(r.thermo.state, t=1000*t)

#sorting top 10 sensitive reactions

N=10

sensitivity = [0]*n
sensitive = [0]*N
reaction_num= [0]*N

for i in range(N):
	for j in range(n):
			if(abs(np.min(maxi))>np.max(maxi)):
				sensitive[i] = np.min(maxi)
			else:
				sensitive[i] = np.max(maxi)
			reaction_num[i] = maxi.index(sensitive[i])
	maxi.remove(sensitive[i])

sReaction = [0]*N

print('Top 10  sensitive reactions')
for i in range(N):
	sReaction[i]= sim.sensitivity_parameter_name(reaction_num[i])
	print('s=',sensitive[i],'for reaction',sReaction[i])

plt.figure(1)
plt.barh(sReaction,sensitive, color = ["yellow","brown"], height = 0.5)
plt.xlabel('Sensitivity')
plt.title('Top 10  sensitive reactions')
plt.figure(figsize = (20, 5))
plt.yticks(fontsize = 6)

plt.figure(2)
plt.subplot(2,2,1)
plt.plot(states.t,states.T)
plt.xlabel('Time (in ms)')
plt.ylabel('Temperature (in K)')

plt.subplot(2,2,2)
plt.plot(states.t,states('CH4').X)
plt.xlabel('Time (in ms)')
plt.ylabel('Mole fraction of CH4')


plt.subplot(2,2,3)
plt.plot(states.t,states('H').X)
plt.xlabel('Time (in ms)')
plt.ylabel('Mole fraction of H')


plt.subplot(2,2,4)
plt.plot(states.t,states('OH').X)
plt.xlabel('Time (in ms)')
plt.ylabel('Mole fraction of OH')
plt.show()
RESULT
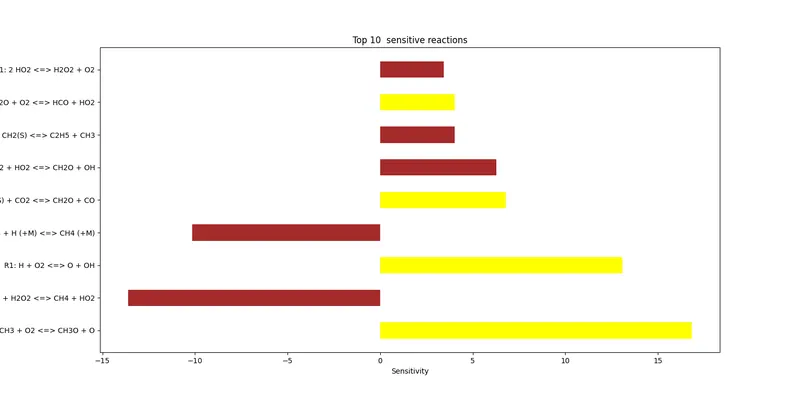
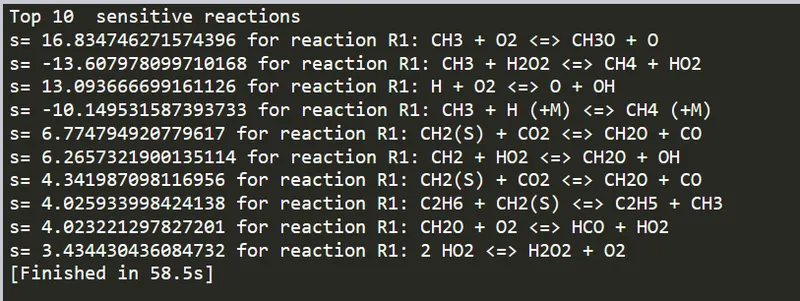
We see in the above fig that the most sensitive reaction is CH3 + O2 ó CH3O + O with a sensitivity coefficient of 16.84. Another observation is the presence of positive and negative values of sensitivity coefficients. The positive coefficient of sensitivity indicates that with the rise in the reaction parameter- temperature, the rate of the reaction will increase and contribute to a faster net combustion reaction. This will result in a decrease in the ignition delay. Whereas a negative sensitivity coefficient indicates slower sensitivity to temperature rise and will result in an increase of ignition delay.
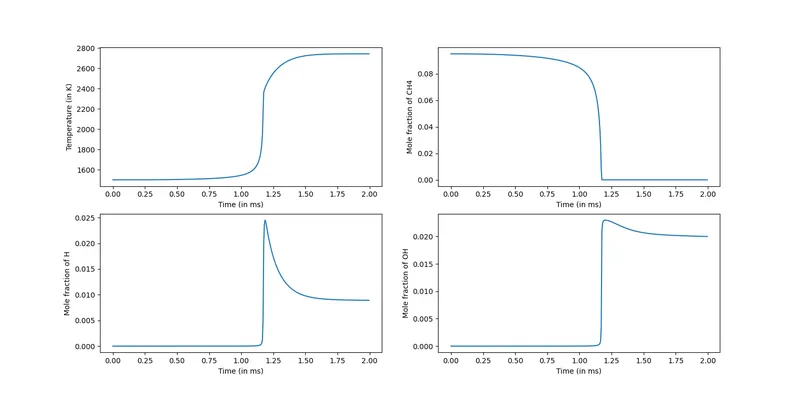
The ignition delay can be determined by plotting the reaction parameter variation with respect to the time advancement. The above figure shows the variation of temperature and molar concentrations of CH4, OH, and H species with respect to time. It can be concluded that the ignition delay for the given reaction parameters is 1 ms.
The output of the program shows the sensitivity coefficient for the ten most sensitive intermediary reactions.