Project 1 - Parsing NASA thermodynamic data
PARSING NASA THERMODYNAMIC DATA
AIM: Parsing the NASA thermodynamic data given and calculate molecular data.
OBJECTIVE:
1. To read and extract 14 coefficients for each element from the NASA thermodynamic data file and calculates the enthalpy, entropy, and
specific heats for all the species in the data file.
2. To calculate the molecular weight of each species and display it in the command window
3. Plot the Cp, Enthalpy, and Entropy for the local temperature range (low temperature: high temperature) specific for each species.
4. Save the plots as images with appropriate names and dump them in separate folders for each species with a suitable name. All these be generated automatically.
THEORY: Parsing in computer languages refers to the syntactic analysis of the input data normally from a file into its components parts in order to facilitate the writing of compilers and interpreters. It can be used to describe split or separation
Parsing a file means reading in a data stream of some sort and building an in-memory model of the semantic content of that data. This aims at facilitating performing some kind of transformation on the data.
EXPLANATION OF THE CODE:
- We start by going through the data given. Then start our program with the inputs needed.
- First, open a file that is given and start reading the data from the header.
- We read it by the function fget and split the temperature from the temperature file to get it into a single array converting them into numbers using strnum function.
- Assigning temperature ranges and we run a loop to skip the lines and the data file.
- Running the same loop as above to find the rest 53 elements in the data.
- Getting to the next line, we find the E string to find the number of coefficients and the rest of the 14 coefficients left.
- In which the first 7 coefficients are for higher temperature and the rest to the lower.
- Now we start creating the function for the Specific heat, Enthalpy, and Entropy, based on the given formulas.
- And creating another function for Molecular weight.
-
function cp = specific_heat(p1,p2,p3,p4,p5,p6,p7,p8,p9,p10,p11,p12,p13,p14,t1,t2,t3,temp,R) if (temp <= t2) cp = R*(p1 + (p2.*temp) + (p3.*(temp).^2) + (p4.*(temp).^3) + (p5.*(temp).^4)); else cp = R*(p8 + (p9*temp) + (p10*(temp).^2) + (p11*(temp).^3) + (p12*(temp).^4)); end -
function S = entropy(p1,p2,p3,p4,p5,p6,p7,p8,p9,p10,p11,p12,p13,p14,t1,t2,t3,temp,R) if (temp <= t2) S = R*(p1.*log(temp) + (p2.*temp) + ((p3.*(temp).*2)/2) + ((p4.*(temp).^3)/3) + ((p5.*(temp).^4)/4) + p7); else S = R*(p8.*log(temp) + (p9.*temp) + ((p10.*(temp).*2)/2) + ((p11.*(temp).^3)/3) + ((p12.*(temp).^4)/4) + p14); end -
function H = enthalpy(p1,p2,p3,p4,p5,p6,p7,p8,p9,p10,p11,p12,p13,p14,t1,t2,t3,temp,R) if (temp <= t2) H = R*temp.*(p1 + ((p2.*temp)/2) + ((p3.*(temp).^2)/3) + ((p4.*(temp).^3)/4) + ((p5.*(temp).^4)/5) + ((p6./temp))); else H = R*temp.*(p8 + ((p9.*temp)/2) + ((p10.*(temp).^2)/3) + ((p11.*(temp).^3)/4) + ((p12.*(temp).^4)/5) + ((p14./temp))); end -
function m = m_wt(species_name) atomic_name = ['H', 'C', '0', 'N', 'Ar']; atomic_weight = [1.008 12.011 15.999 14.007 39.948]; % Molecular weight starting range m=8; for i = 1:length(species_name) for j = 1:length(atomic_name) if strcmp(species_name(i), atomic_name(j)) m = m + atomic_weight(j); position = j; end end n = str2num(species_name); if n>1 m = m + atomic_weight(position)*(n-1); end end - Then we get to the plotting versus temperature for each Specific heat, Entropy, and Enthalpy.
- Saving them according to the specific names.
- Last defining the molecular weight and displaying it.
-
close all
clear all
clc

% Defining inputs
R = 8.314;

f1 = fopen('THERMO.dat','r');

% Reading header information
fgetl(f1);

% Global Temperature
G_temp = fgetl(f1);

S = strsplit(G_temp,' ');

% global low temperature
T1 = str2double(S{2});
% global mid temperature
T2 = str2double(S{3});
% global high temperature
T3 = str2double(S{4});

% Skipping these lines

fgetl(f1);
fgetl(f1);
fgetl(f1);

% Block line 1

for i = 1:53

G_temp2 = fgetl(f1);
W = strsplit(G_temp2,' ');
species_name = W{1};
A = strfind(G_temp2,'G');
Values = G_temp2(A+4:length(G_temp2));
B = strsplit(Values,' ');

% Local low temp
t1 = str2double(B{1});
% Local mid temp
t2 = str2double(B{2});
% Local high temp
t3 = str2double(B{3});
G_temp = fgetl(f1);
p = strfind(G_temp, 'E');

p1 = G_temp(1:p(1)+3);
p1 = str2double(p1);
p2 = G_temp(p(1)+4:p(2)+3);
p2 = str2double(p2);
p3 = G_temp(p(2)+4:p(3)+3);
p3 = str2double(p3);
p4 = G_temp(p(3)+4:p(4)+3);
p4 = str2double(p4);
p5 = G_temp(p(4)+4:p(5)+3);
p5 = str2double(p5);

l2 = fgetl(f1);

p6 = G_temp(1:p(1)+3);
p6 = str2double(p6);
p7 = G_temp(p(1)+4:p(2)+3);
p7 = str2double(p7);
p8 = G_temp(p(2)+4:p(3)+3);
p8 = str2double(p8);
p9 = G_temp(p(3)+4:p(4)+3);
p9 = str2double(p9);
p10 = G_temp(p(4)+4:p(5)+3);
p10 = str2double(p10);

l3 = fgetl(f1);

p11 = G_temp(1:p(1)+3);
p11 = str2double(p11);
p12 = G_temp(p(1)+4:p(2)+3);
p12 = str2double(p12);
p13 = G_temp(p(2)+4:p(3)+3);
p13 = str2double(p13);
p14 = G_temp(p(3)+4:p(4)+3);
p14 = str2double(p14);

temp = linspace(t1,t2,100);

% Specific heat
cp = specific_heat(p1,p2,p3,p4,p5,p6,p7,p8,p9,p10,p11,p12,p13,p14,t1,t2,t3,temp,R);

% Enthalpy

H = enthalpy(p1,p2,p3, p4, p5, p6, p7, p8, p9, p10, p11,p12,p13, p14,t1, t2,t3,temp,R);

% Entropy

S = entropy(p1,p2,p3, p4, p5, p6, p7, p8, p9, p10, p11,p12,p13, p14,t1, t2,t3,temp,R);

% Creating a folder
mkdir(['C:',species_name])
cd(species_name)

% Plotting t vs cp
figure(1);
plot(temp, cp,'linewidth',3,'color','b')
xlabel('TEMPERATURE in K');
ylabel('SPECIFIC HEAT in KJ');
title('TEMPERATURE VS SPECIFIC HEAT');
grid on
saveas(figure(1),'specific heat.jpg')

% Plotting for t Vs H
figure(2);
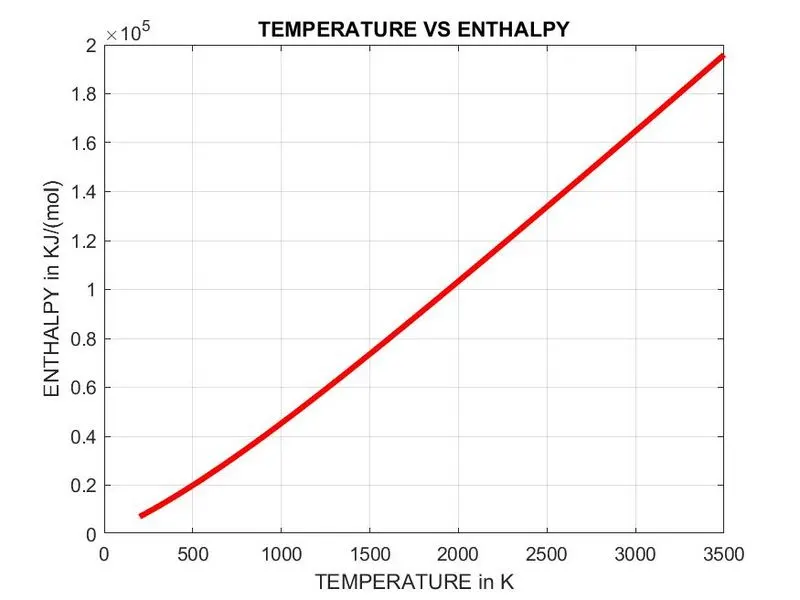
plot(temp,H,'linewidth',3,'color','r');
xlabel('TEMPERATURE in K')
ylabel('ENTHALPY in KJ/(mol)');
title('TEMPERATURE VS ENTHALPY');
grid on
saveas(figure(2),'Enthalpy.jpg')

% Plotting for t vs S
figure(3);
plot(temp,S,'linewidth',3,'color','y');
xlabel('TEMPERATURE in K');
ylabel('ENTROPY in KJ/(mol K)');
title('TEMPERATURE VS ENTROPY');
grid on
saveas(figure(3),'Entropy.jpg')
cd ..

% Molucular mass
m = m_wt(species_name);
q = sprintf('%s m_wt;=%f',species_name,m);
disp(q)
end
ERRORS FACED:
Attached Screenshot(118): Error did by the wrong Syntax.
Attached Screenshot(119): Error, forgetting to define the function itself.
RESULTS:
Attached Screenshot(121): is the file created, to keep all the project data.
The plot of O2 temperature vs Enthalpy, Entropy, Specific temperature.
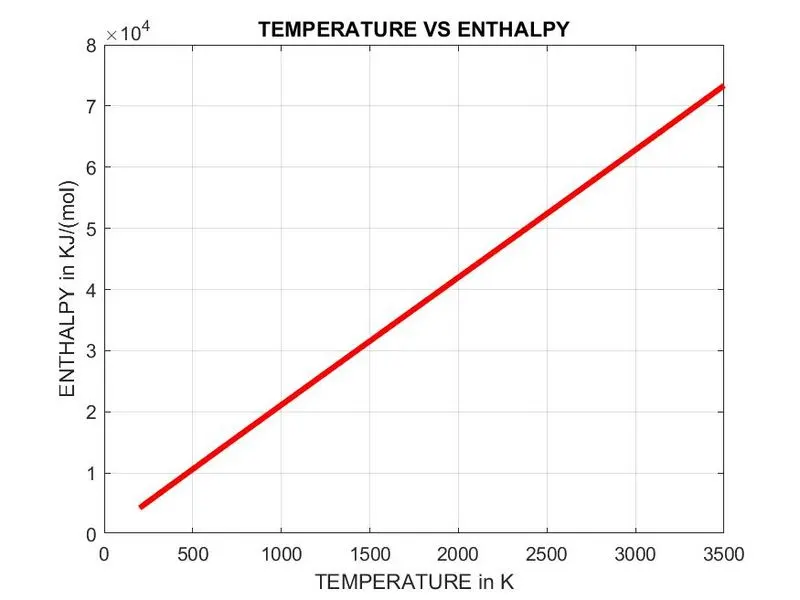
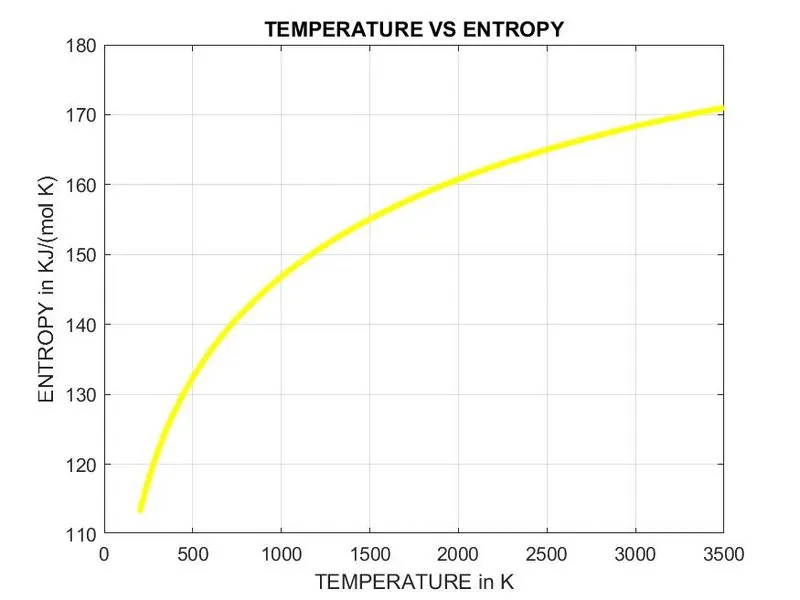
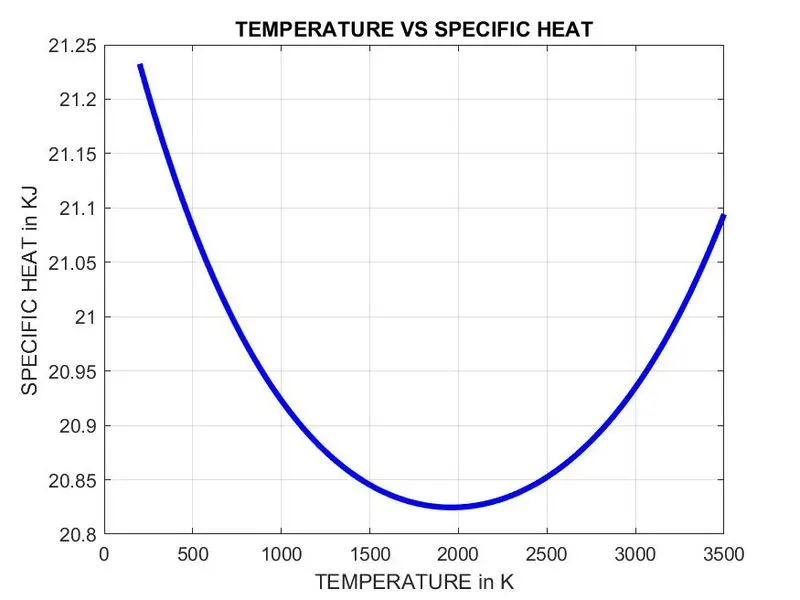
The plot of N2 temperature vs Enthalpy, Entropy, Specific temperature.
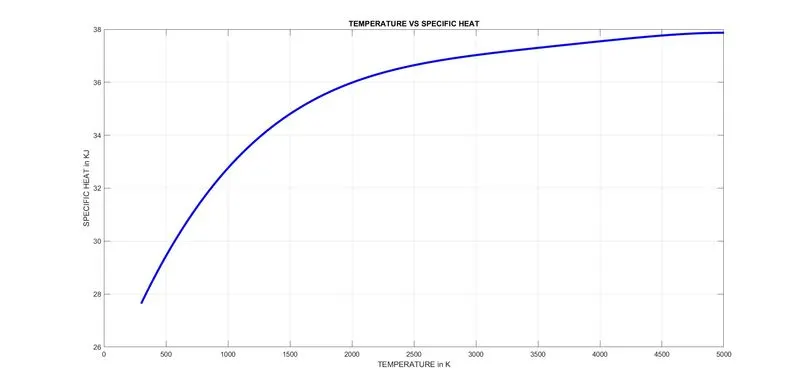
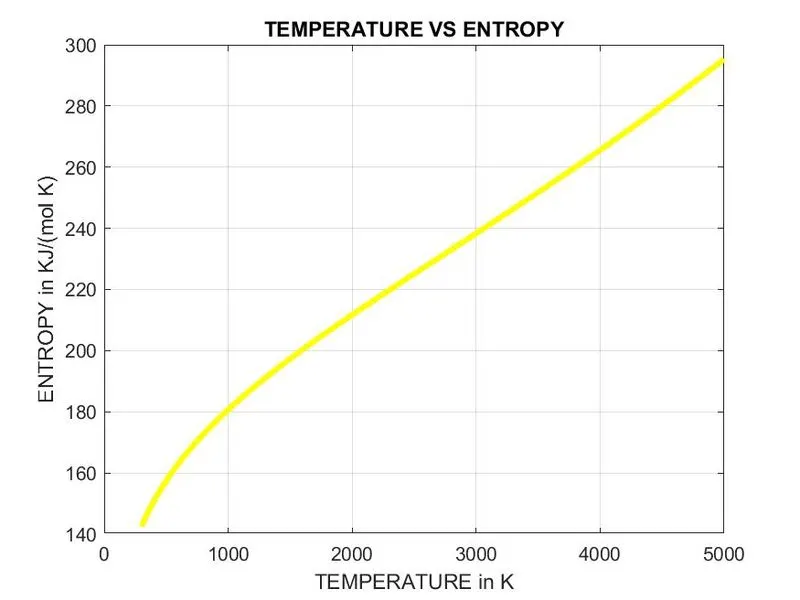
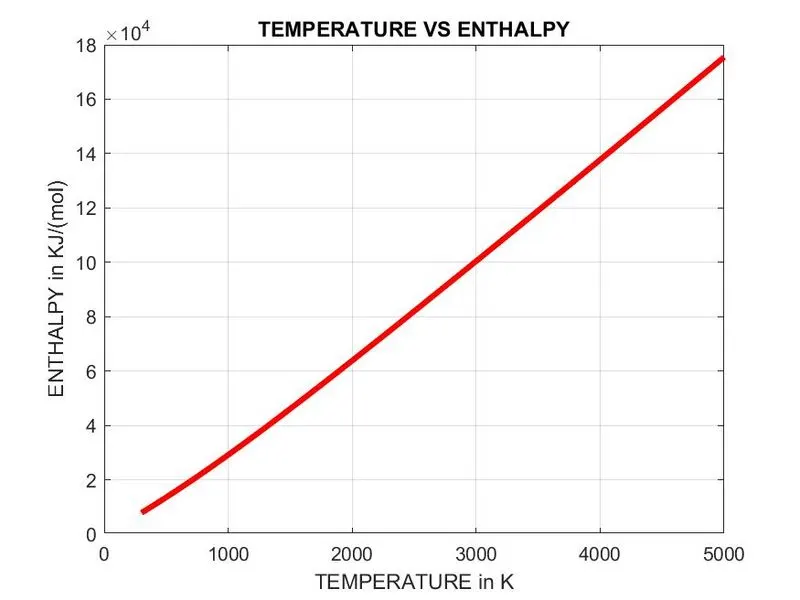
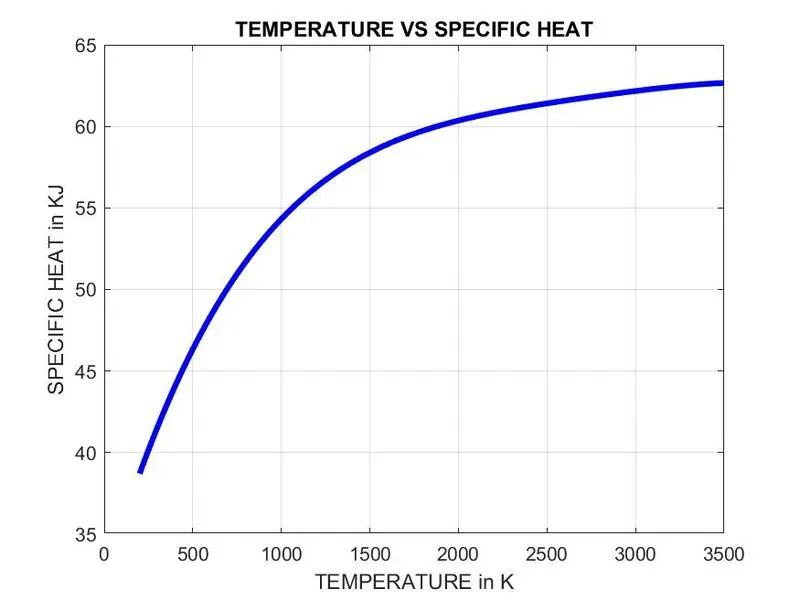
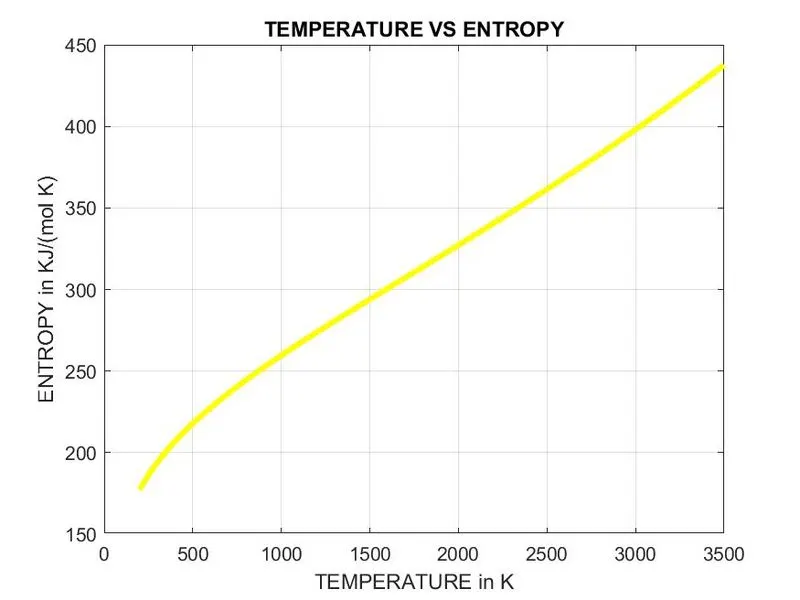
The plot of Co2 temperature vs Enthalpy, Entropy, Specific temperature.
Output data from the window command
Molecular weight of O :-8.000000
Molecular weight of O2 :-8.000000
Molecular weight of H :-9.008000
Molecular weight of H2 :-9.008000
Molecular weight of OH :-9.008000
Molecular weight of H2O :-9.008000
Molecular weight of HO2 :-9.008000
Molecular weight of H2O2 :-9.008000
Molecular weight of C :-20.011000
Molecular weight of CH :-21.019000
Molecular weight of CH2 :-21.019000
Molecular weight of CH2(S) :-21.019000
Molecular weight of CH3 :-21.019000
Molecular weight of CH4 :-21.019000
Molecular weight of CO :-20.011000
Molecular weight of CO2 :-20.011000
Molecular weight of HCO :-21.019000
Molecular weight of CH2O :-21.019000
Molecular weight of CH2OH :-22.027000
Molecular weight of CH3O :-21.019000
Molecular weight of CH3OH :-22.027000
Molecular weight of C2H :-21.019000
Molecular weight of C2H2 :-21.019000
Molecular weight of C2H3 :-21.019000
Molecular weight of C2H4 :-21.019000
Molecular weight of C2H5 :-21.019000
Molecular weight of C2H6 :-21.019000
Molecular weight of CH2CO :-33.030000
Molecular weight of HCCO :-33.030000
Molecular weight of HCCOH :-34.038000
Molecular weight of H2CN :-35.026000
Molecular weight of HCN :-35.026000
Molecular weight of HNO :-23.015000
Molecular weight of N :-22.007000
Molecular weight of NNH :-37.022000
Molecular weight of N2O :-22.007000
Molecular weight of NH :-23.015000
Molecular weight of NH2 :-23.015000
Molecular weight of NH3 :-23.015000
Molecular weight of NO :-22.007000
Molecular weight of NO2 :-22.007000
Molecular weight of HCNO :-35.026000
Molecular weight of HOCN :-35.026000
Molecular weight of HNCO :-35.026000
Molecular weight of NCO :-34.018000
Molecular weight of CN :-34.018000
Molecular weight of HCNN :-49.033000
Molecular weight of N2 :-22.007000
Molecular weight of AR :-47.948000
Molecular weight of C3H8 :-21.019000
Molecular weight of C3H7 :-21.019000
Molecular weight of CH3CHO :-34.038000
Molecular weight of CH2CHO :-34.038000
Attached Screenshot(122), Screenshot(123): are the screenshot of my workspace.