Week 9 - Senstivity Analysis Assignment
Aim : To find 10 most sensitive reactions from the set of reaction for the combustion of fuel.
Objective:
- Write a code which calculate sensitivity of all the reaction and generates 10 most sensitive reactions.
- Plot the reactions with there sensitivity, change the equivalence ratio and discuss the effect of it on sensitivity of reactions.
Introduction:
Sensitivity analysis is a process to get relationship between the parameters and the output of the model, Ex: the effect of reaction 1 rate on the temperature or species concentration.
The general ODE is given as:
dz/dt = F (Z, t;a)
Z = (T ,Y1 ,Y2,….,Yk)
Wj,i = ∂Zj /∂ai
Where,
Z = vector of species
j = the independent variable
i = no of reactions
a = net reaction rate multiplier
Z = (T,Y1,Y2,....Yk)
Z is dependent on temperature and all independent variables.
If we want to check sensitivity of temperature in our parameter matrix we should include temperature + mass fraction of all the species, we can also include pressure and other parameters.
The ignition delay mainly vary due to temperature so we will consider temperature in our simulation.
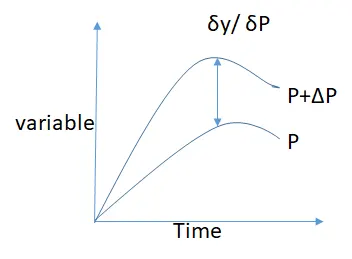
In graph the change in variable with change in parameters is called sensitivity.
Steps/logic :
- Import the required modules for simulation
- Define the value for equivalence ratio
- Create a function which takes the values of equivalence ratio as input and calculate the sensitivity of 10 most sensitive reactions.
Steps/logic to calculate sensitivity:
- The step one is to calculate the mole fraction of each reactants using the equivalence ratio.
- Defining gas object, and providing the initial temperature,and presssure for the simulation.
- Creating the reactor object in which reaction is to be carried on, confining reactor in reactor network for calculation of states at different time steps.
- To calculate the sensitivity of all reactions we should calculate the number of reaction present in the file, and creating a for loop to calculate the sensitivity for all the reactions present.
- Define the absolute and relative tolerances for reactions.
- Creating the loop for time array, and advance the time for every reaction and store the sensitivity in the matrix.
- To calculate the 10 most sensitive reaction we create another for loop for 10 number of iteration in which we calculate the maximum and minimum for all sensitive reaction, and then compare there absolute values which will provide us the most sensitive value from all sensitivities, and store them in another matrix.
- Store the index of 10 most sensitive reactions such that we can regain the string of reactions and plot the reactions vs sensitivity graph.
- To plot the graph for mole fraction of species with respect to time we will use the python code as,
Syntax : states.X[:,gas2.species_index('OH')]
Python code for calculate 10 most sensitive reactions:
import cantera as ct
import numpy as np
import matplotlib.pyplot as plt
from prettytable import PrettyTable

#equivalence ratio
phi = [0.5,1.5]
def equivalence_ratio(phi):
	gas = ct.Solution('gri30.xml') #gas object
	N_total = 1+(2/phi)+(7.52/phi)
	N_CH4  = 1/N_total
	N_O2 = (2/phi)/N_total
	N_N2 = (7.52/phi)/N_total
	T = 1500 #temperature
	P = ct.one_atm #pressure
	gas.TPX = T,P,{'CH4':N_CH4, 'O2':N_O2 , 'N2':N_N2}  #setting the value of temperature,pressure and mole fraction
	r = ct.IdealGasConstPressureReactor(gas)  #using reactor
	sim = ct.ReactorNet([r])   #reactor network

	n= gas.n_reactions #To get no of reaction in gas object

	#loop to calculate sensitivity of all reactions in gas object
	for i in range(n):
		r.add_sensitivity_reaction(i)

	sim.rtol = 1e-6
	sim.atol = 1e-15

	sim.rtol_sensitivity = 1e-6
	sim.atol_sensitivity = 1e-6
	#array for all reactions
	s_max = [0]*n
	s_unchanged = [0]*n #retaining the values in array for further calculations
	#To store solution of all the states
	states = ct.SolutionArray(gas,extra = ['t'])

	#for loop for time step
	for t in np.arange(0,2e-3,5e-6):
		sim.advance(t)
		#loop for sensitivity calculation for all reaction
		for j in range(n):
			s = sim.sensitivity('temperature',j)
			states.append(r.thermo.state,t = 1000*t)
			#Storing the values of sensitivity in s_max  and s_unchanged array for each time step
			if np.abs(s) >= np.abs(s_max[j]):
				s_max[j] = s
				s_unchanged[j] = s

	N = 10 #10 most sensitive cases
	s_new = np.zeros(N) #array for storing 10 most sensitive values

	for i in range(N):
		#Calculating the maximum and minimum values form all sensitivity values
		maximum = max(s_max)
		minimum = min(s_max)
		#comparing if absolute of maximum is greater then or equal to minimum, store that value in s_new and remove from
		#s_max, such that same maximum value does not get stored again in s_new, and then applying else statement.
		if np.abs(maximum)>np.abs(minimum):
			s_new[i] = maximum
			s_max.remove(maximum)
		else:
			s_new[i] = minimum
			s_max.remove(minimum)

	#storing the reactions and index of reactions for 10 most sensitive values
	reactions = []
	s=[]
	for i in s_new:
		index = s_unchanged.index(i)
		reaction = sim.sensitivity_parameter_name(index)
		reactions.append(reaction.replace('IdealGasConstPressureReactor_',''))
		s.append(index)

	#Storing the reverse values of sensitivity
	sensitivity	= s_new[::-1]
	sensitive_reactions = reactions[::-1]
	return(sensitivity,sensitive_reactions,states,gas)

#Calling the function for sensitiviy, sensitive reaction, states, gas
[s1,sr1,states1,gas1] = equivalence_ratio(phi[0])
[s2,sr2,states2,gas2] = equivalence_ratio(phi[1])

#Table to print the values of output
table1 = PrettyTable(['sensitive reactions','sensitivity'])
table2 = PrettyTable(['sensitive reactions','sensitivity'])
for x in range(0,len(s1)):
	table1.add_row([sr1[x],s1[x]])
	table2.add_row([sr2[x],s2[x]])
print(table1)
print(table2)

#plotting
w=0.4
bar1 = np.arange(len(sr1))
bar2 = [i+w for i in bar1]

plt.figure(num=1, figsize=(13,8))
plt.title('Sensitivity of Top 10 reaction for phi = 0.5')
plt.barh(bar1,s1,w,color = 'b',label = r'$\phi=0.5$')
plt.yticks(bar1,sr1,fontsize = '6')
plt.xlabel('sensitivity')
plt.ylabel('Reactions')
plt.grid('on')
plt.legend(loc = 'best')

plt.figure(num=2, figsize=(13,8))
plt.title('Sensitivity of Top 10 reaction for phi = 1.5')
plt.barh(bar2,s2,w,color = 'g',label = r'$\phi=1.5$')
plt.yticks(bar2,sr2,fontsize = '6')
plt.xlabel('sensitivity')
plt.ylabel('Reactions')
plt.grid('on')
plt.legend(loc = 'best')


plt.figure(num=3, figsize=(13,8))
plt.suptitle('Mole fraction and temperature variation with time for phi = 0.5')
plt.subplot(2,2,1)
plt.plot(states1.t,states1.T)
plt.xlabel('time in ms')
plt.ylabel('Temperature in K')
plt.subplot(2,2,2)
plt.plot(states1.t,states1.X[:,gas1.species_index('OH')])
plt.xlabel('time in ms')
plt.ylabel('mole fraction OH')
plt.subplot(2,2,3)
plt.plot(states1.t,states1.X[:,gas1.species_index('H2')])
plt.xlabel('time in ms')
plt.ylabel('mole fraction H2')
plt.subplot(2,2,4)
plt.plot(states1.t,states1.X[:,gas1.species_index('CH4')])
plt.xlabel('time in ms')
plt.ylabel('mole fraction CH4')


plt.figure(num=4, figsize=(13,8))
plt.suptitle('Mole fraction and temperature variation with time for phi = 1.5')
plt.subplot(2,2,1)
plt.plot(states2.t,states2.T)
plt.xlabel('time in ms')
plt.ylabel('Temperature in K')
plt.subplot(2,2,2)
plt.plot(states2.t,states2.X[:,gas2.species_index('OH')])
plt.xlabel('time in ms')
plt.ylabel('mole fraction OH')
plt.subplot(2,2,3)
plt.plot(states2.t,states2.X[:,gas2.species_index('H2')])
plt.xlabel('time in ms')
plt.ylabel('mole fraction H2')
plt.subplot(2,2,4)
plt.plot(states2.t,states2.X[:,gas2.species_index('CH4')])
plt.xlabel('time in ms')
plt.ylabel('mole fraction CH4')

plt.show()
PLOTS:
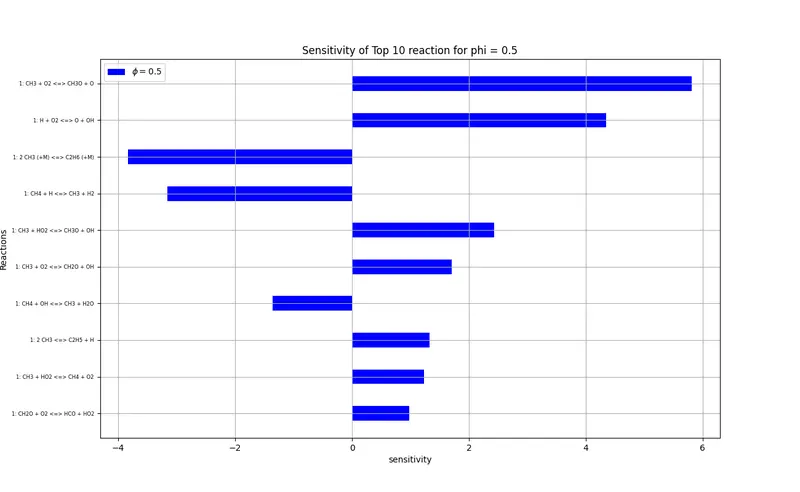
Plot-1:
Plot for top 10 sensitive reaction from greater to smaller value for equivalence ratio of 0.5.
Plot-2:
Plot for top 10 sensitive reaction from greater to smaller value for equivalence ratio of 1.5.
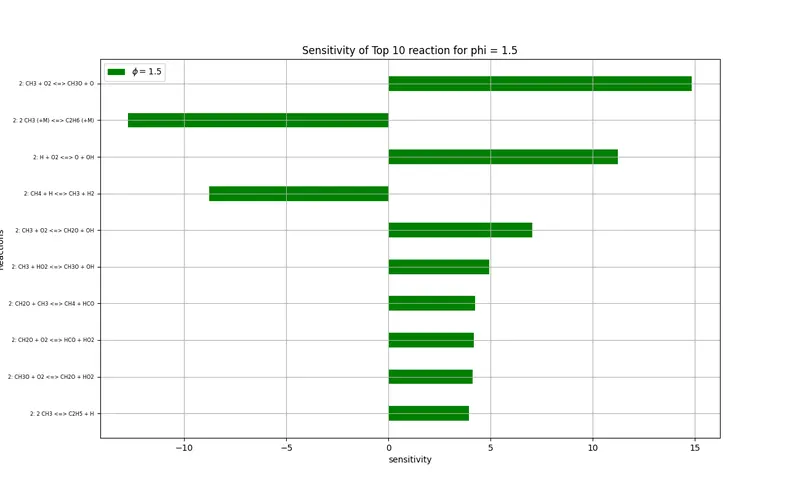
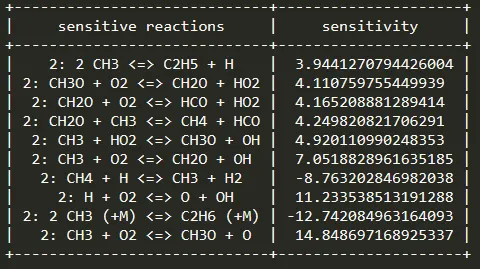
As the equivalence ratio increases the 10 most sensitive reactions changes and also the sensitivity values.
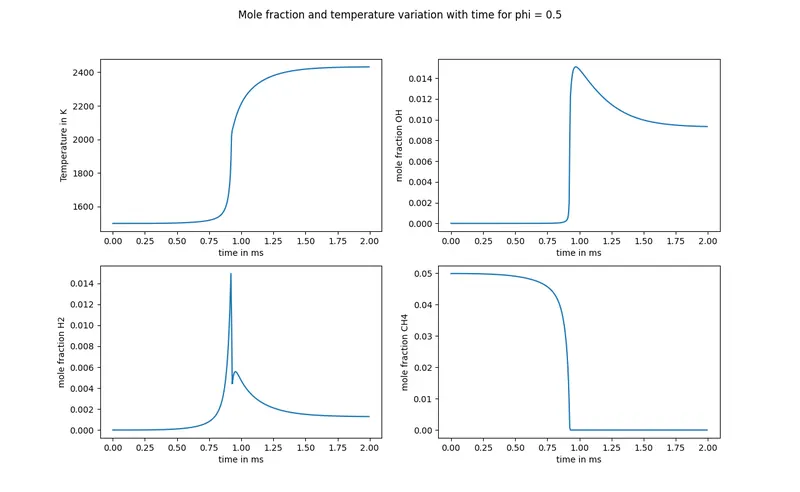
Plot-3:
Variation of temperature, mole fraction of species vs the time in millisecond for equivalence ratio 0.5.
Plot-4:
Variation of temperature, mole fraction of species vs the time in millisecond for equivalence ratio 1.5.
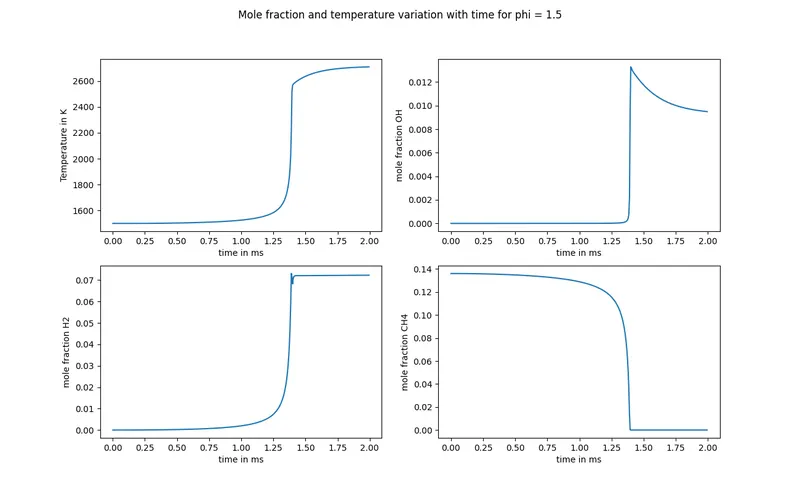
Table-1:
Table for sensitive reactions and sensitivity for equivalence ratio 0.5 .
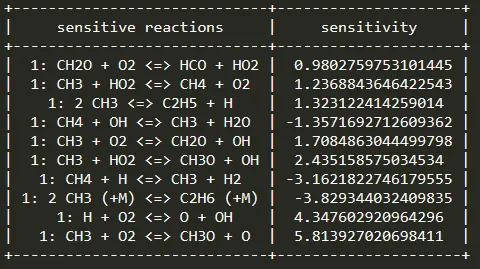
Table-2:
Table for sensitive reactions and sensitivity for equivalence ratio 1.5 .
Conclusion:
We got the 10 most sensitive reaction according to which we can tune the ignition process, and also writing code will increase the flexibility to carry on any changes easily and get the outputs.