Parametric study on Gate valve.
Aim – To perform a parametric study on the gate valve by setting a simulation of varying the opening from 10% to 80% of total depth of opening.
Objective –
- Obtain mass flow rate at outlets for each design opening.
- Calculate the flow coefficient and flow factor for each opening and plot graphs.
- Discuss the results of the mass flow rate and flow coefficient.
Theory –
Introduction:
- Gate value, also known as a sluice valve.
- It works by inserting a rectangular gate or wedge into the path of moving fluid.
- They are operated by a threaded stem which connects the actuator (generally Hand wheel or Motor) to the stem of the gate.
- If the valve has a rising stem its position can be seen just by looking at the position of the stem.
- A gate valve is used to control the fluid flow through lifting and descending the gate.
- A gate distinct feature is to provide an unobstructed pathway, which includes minimal pressure loss over the valve.
- When the gate is fully opened there is no restriction to the flow hence the pressure drop is low comparatively.
- Generally, the gate valve is fully closed or fully open as a partially opened valve may experience vibration which may lead to excessive wear.
- A gate valve's main component is a body, seat, stem, bonnet, and actuator. The primary mechanism is straight forward where the handwheel is rotated to move the gate up and down via threads.
- They require more than a 360-degree turn to fully open the valve.
Construction and Working Principle of Gate Valve –
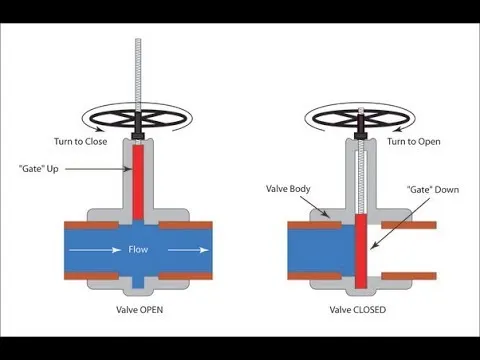
- A gate valve’s main components are the bonnet, disc, seat, sealing arrangement (gland seal, stuffing box etc.), stem, body and actuator.
- Gate valves can be actuated manually (handwheel) or electrically using a high torque motor.
- The disc can be wedge-shaped (tapered) or parallel shaped. Wedge shape designs include solid, flexible and split wedge designs.
- Seat rings are used to make the replacement of a worn/leaking seat easier.
- Seat rings have a screw thread on the reverse side which can be screwed into the main valve body, the flat surface on the opposite side is the seating surface area that presses against the disc.
The main operation mechanism is very simple:
- When the hand-wheel is turned, it rotates the stem, which is translated into the vertical movement of a gate via threads. They are considered multi-turn valves as it takes more than one 360° turn to fully open/close the valve.
- When the gate is lifted from the path of the flow, the valve opens and when it returns to its closed position, it seals the bore resulting in a full closure of the valve.
Gate Valve Closing Member Design –
There are usually two types of gate valve closing which are:
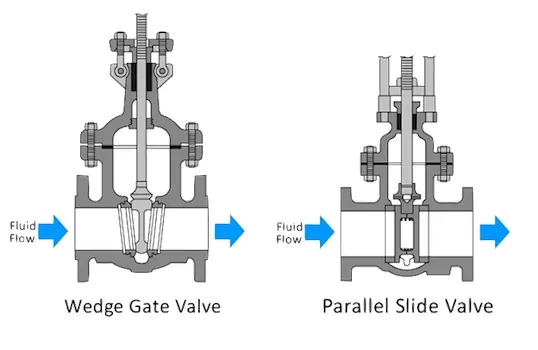
- Parallel Gate Valve – Use a flat valve gate between two parallel seats
- Wedge Gate Valve – Use a slightly mismatched inclined gate between inclined seats.
Gate Valve Stem Design –
The stem, which connects the hand-wheel and disk with each other, is responsible for the proper positioning of the disk. Stems are usually forged, and connected to the disk by threaded or other techniques.
Gate valves are characterized as having either a rising or a non-rising stem:
Rising Stem Gate Valve –
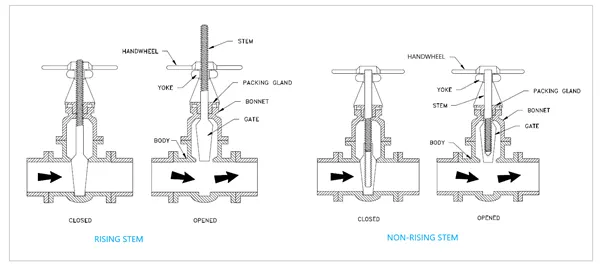
- Rising stems are fixed to the gate and they rise and lower together as the valve is operated, providing a visual indication of the valve position and making it possible to grease the stem.
- A nut rotates around the threaded stem and moves it.
- This type of valve has an inside screwed stem and the packing is subjected to wear because of the up and down movement and turning motion of the stem.
- It is only suitable for above-ground installation.
Non - Rising Stem Gate Valve –
- Non-rising stems are threaded into the gate and rotate with the wedge rising and lowering inside the valve.
- Rotation of the wheel operates the valve, but the stem does not come out of the housing.
- Stem takes up less vertical space since the stem is kept within the valve body.
- Non-rising valves are almost always fitted with a local visual pointer which indicates the position of the valve.
- It is suitable for both above-ground and underground installations.
Flow Coefficient –
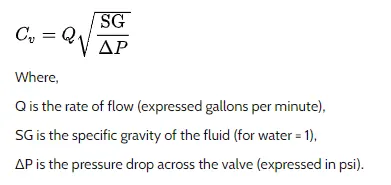
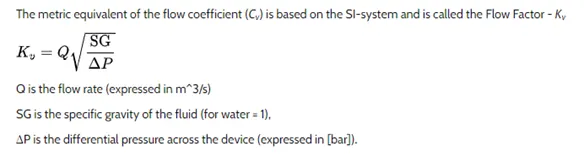
- A Flow Coefficient (Cv) is a relative measure of the fluid flow efficiency that is a designing factor that relates head drop (Δh) or pressure drop (ΔP) across the valve with the flow rate (Q).
- The Cv is the number of gallons of water per minute (gpm) that will flow through a valve or any other restricting device at a temperature of 60ºF with a pressure drop across the valve of 1 psi.
- The definition of Cv is based on water, which has a G (specific gravity) = 1.0. Fluids with other gravities will flow at different rates.
- Each valve has its own flow coefficient.
- This depends on how the valve has been designed to let the flow going through the valve.
- Therefore, the main differences between different flow coefficients come from the type of valve, and of course the opening position of the valve.
- Flow coefficient is important in order to select the best valve for a specific application.
- If the valve is going to be most of the time opened, probably there should be selected a valve with low head loss in order to save energy.
- If it is needed a control valve, the range of coefficients for the different opening positions of the valve should fit the requirements of the application.
- At the same flow rate, a higher flow coefficient means lower drop pressure across the valve.
The coefficient can be non-dimensional or with units if parameters such as diameter or density are considered inside the coefficient or just in the equation.
Flow factor –
Procedure –
Problem Setup –
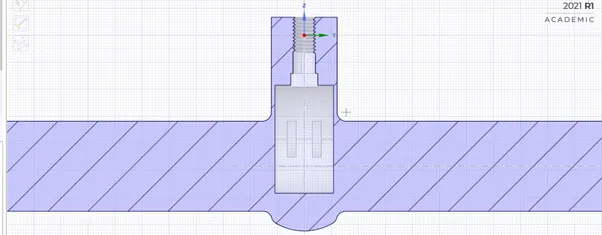
- (1) Geometry
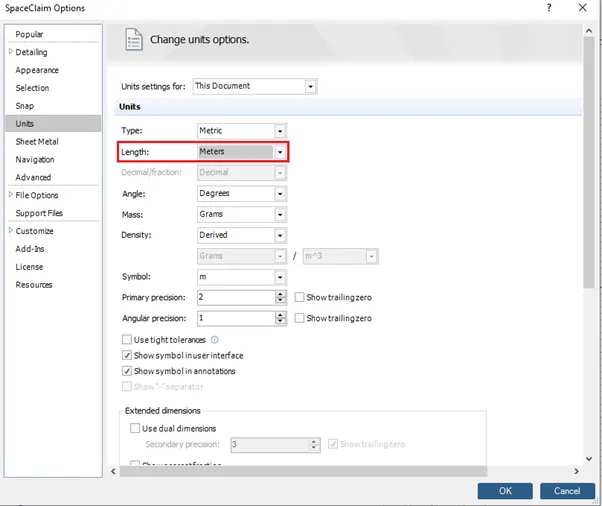
Files → Space Claim Options → Units
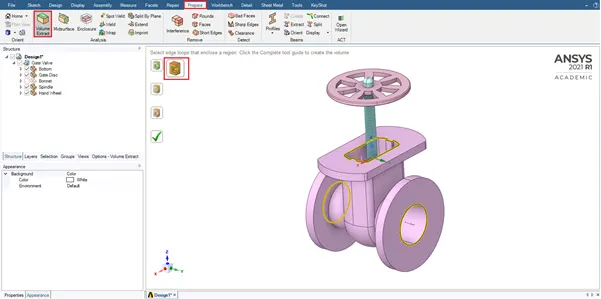
Geometry Clean-up and Fluid Extraction –
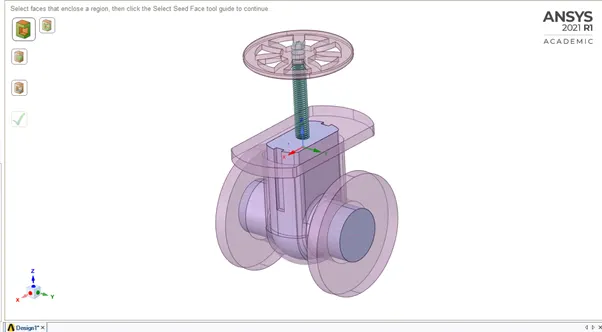
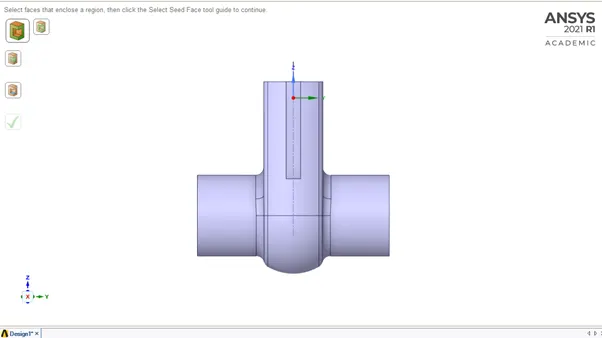
Extracted Volume –
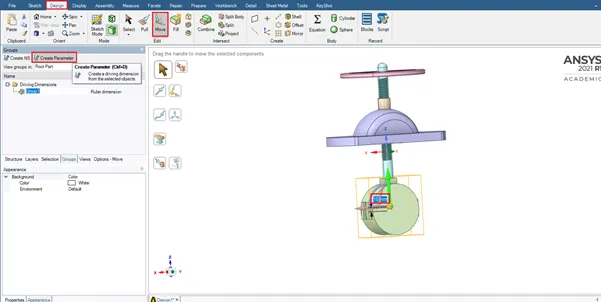
Parametric Setup –
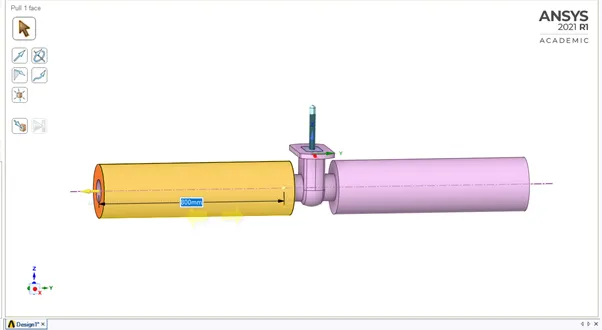
Updating the Fluid Volume to Current Geometry –
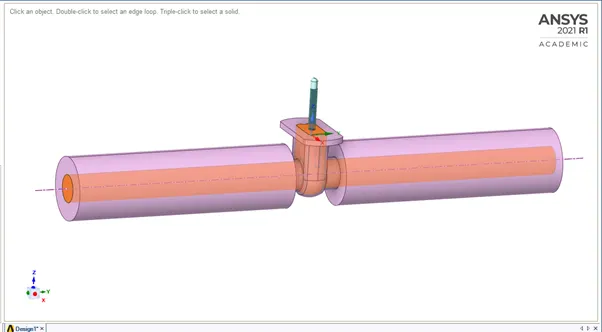
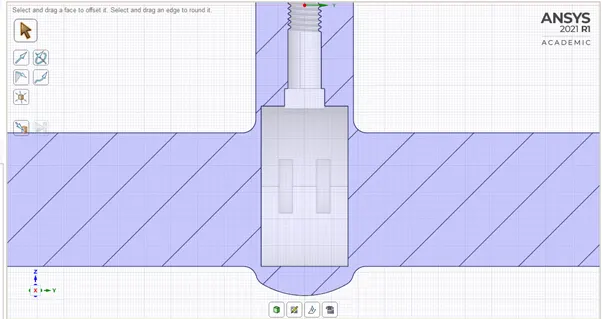
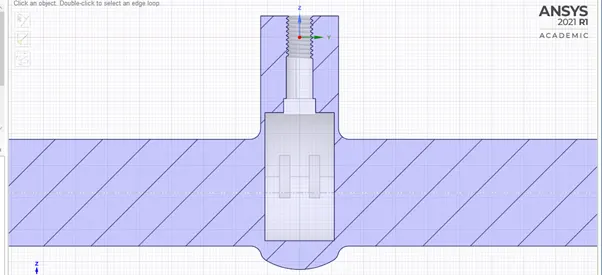
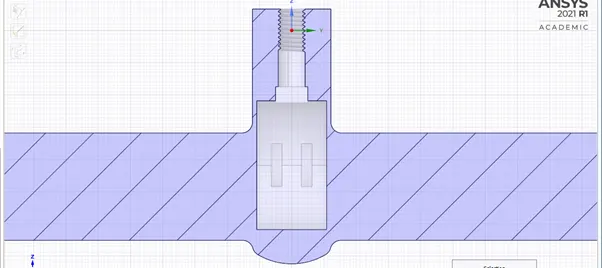
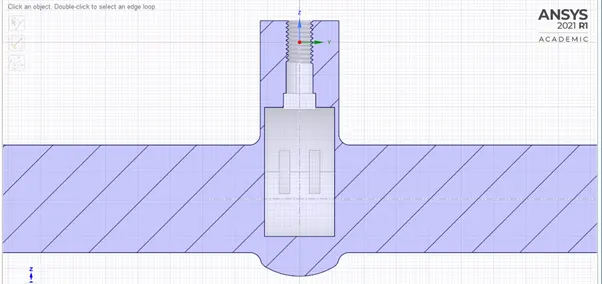
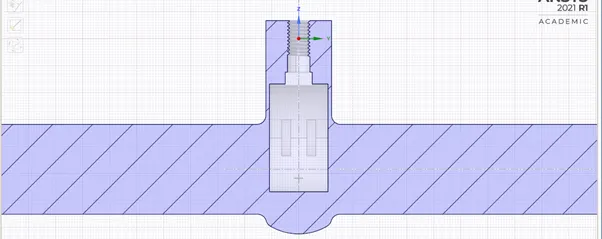
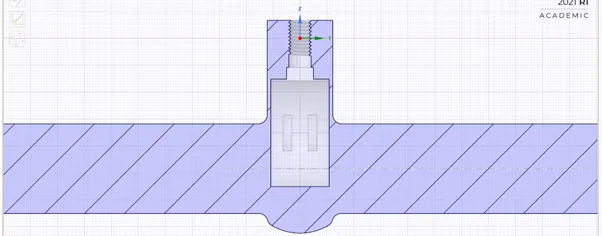
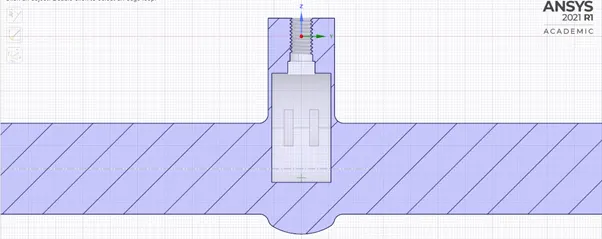
Simulation Geometry –
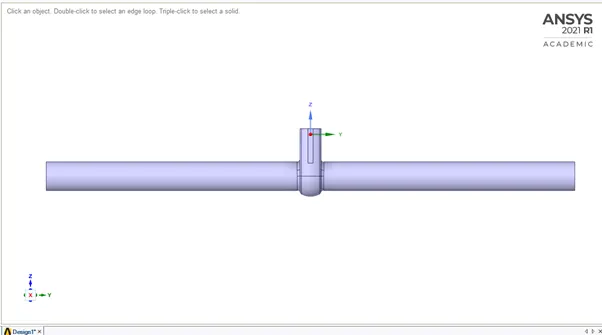
Mesh Generation –
Right Click → Insert → Named Selection, As follows
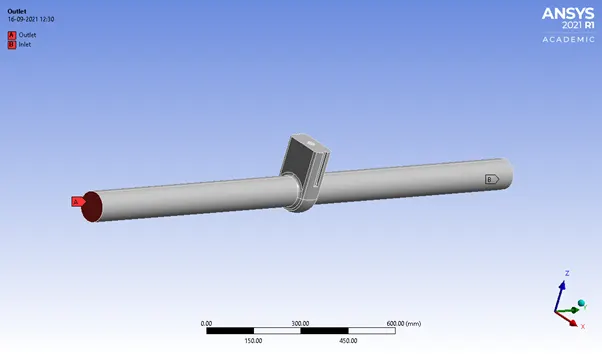
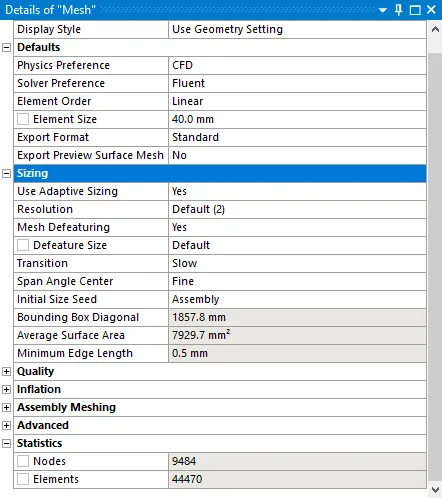
Mesh Details –
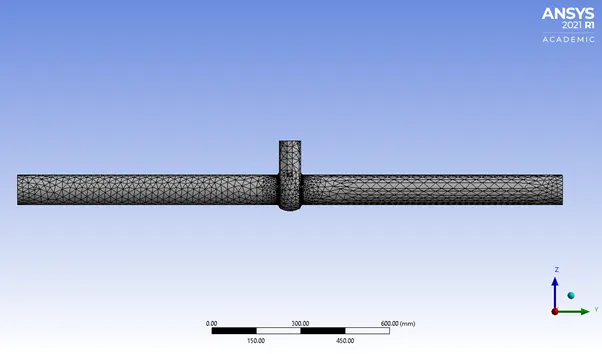
Mesh Generated –
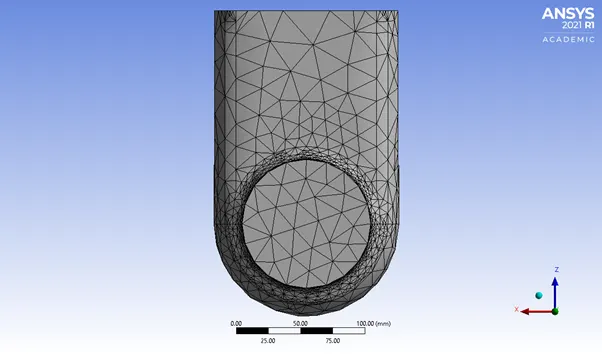
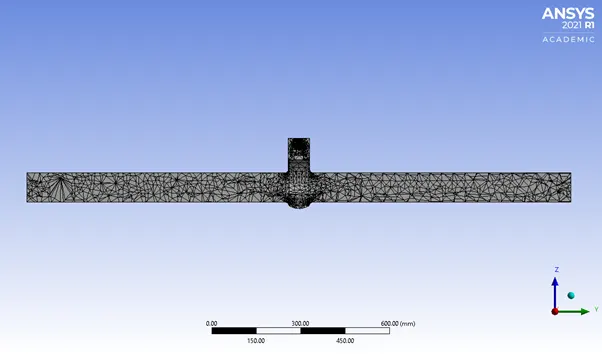
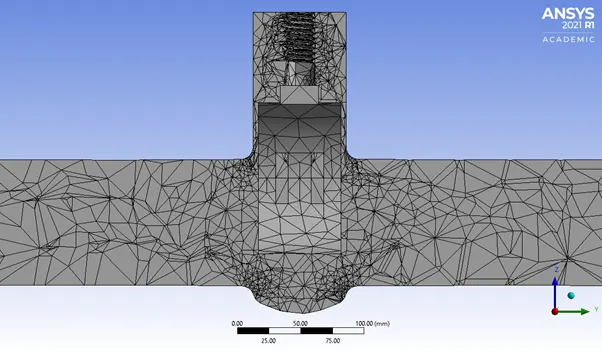
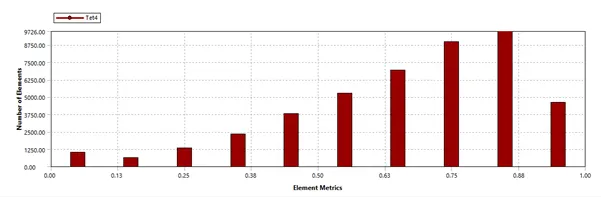
Mesh Quality –
Element Quality:
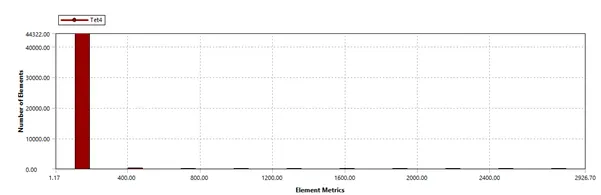
Aspect Ratio:
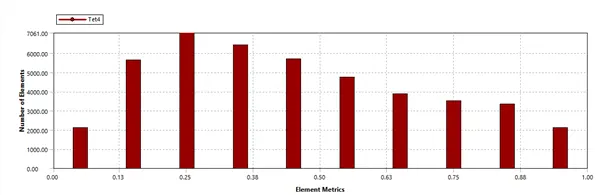
Skewness:
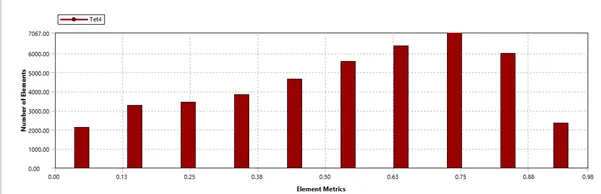
Orthogonal Quality:
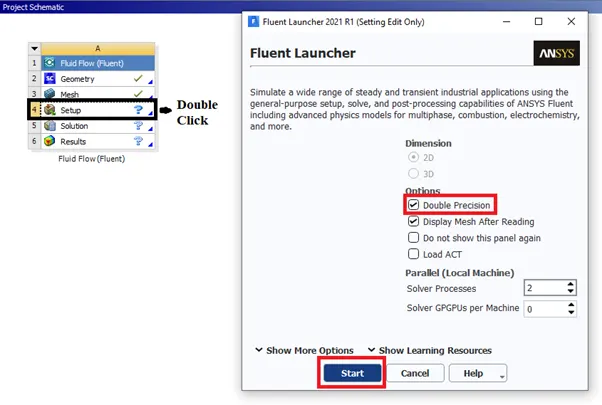
Fluent Setup –
Solution Setup -
- General → Solver → Pressure-based → Time→ Steady State → Gravity → -9.81(Z-axis)
- Models → Viscous → K-epsilon → Realizable → Scalable Wall Function
Energy → Energy Equation → On
- Material → Fluid → Water-Liquid →
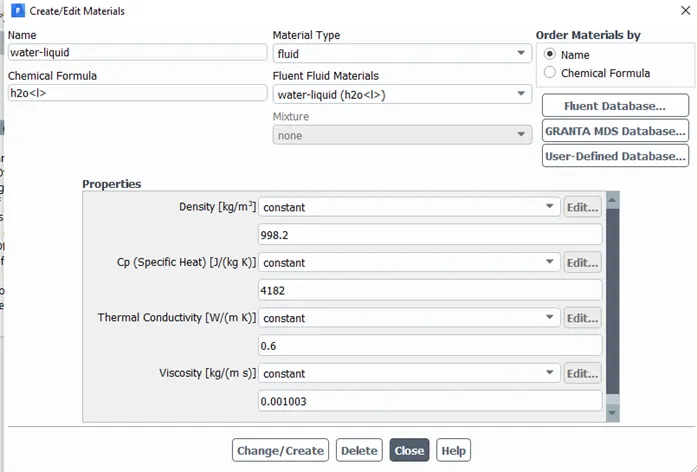
- Cell Zone Conditions → Volume_volume → Fluid → Water-liquid
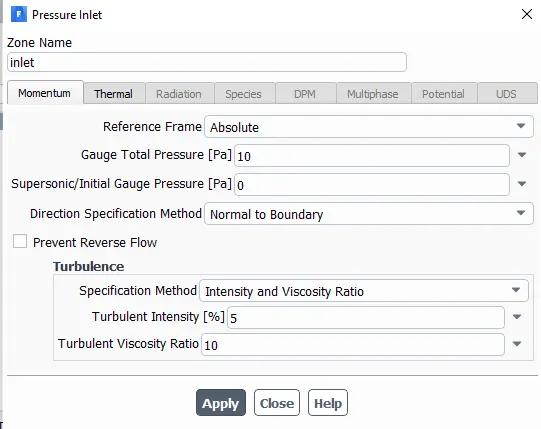
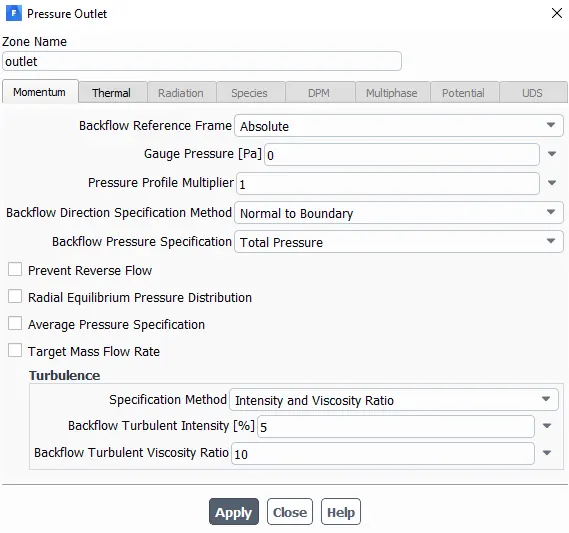
- Boundary Conditions
- Intel
- Outlet
- Wall-Volume_volume → Wall Motion → Stationary → Shear Condition → No Slip
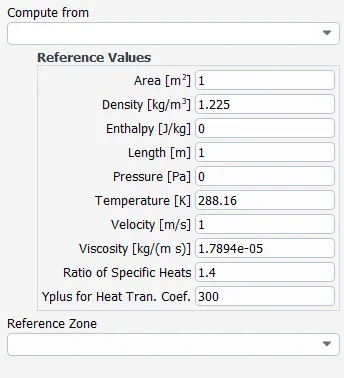
- Reference Values →
- Method → Scheme →
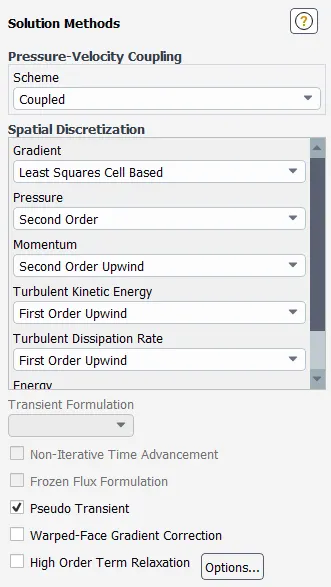
- Solution → Definition →
- Flux Report → Mass Flow Rate → Field Variable = Outlet
- Initialize Solution → Hybrid
- Results →
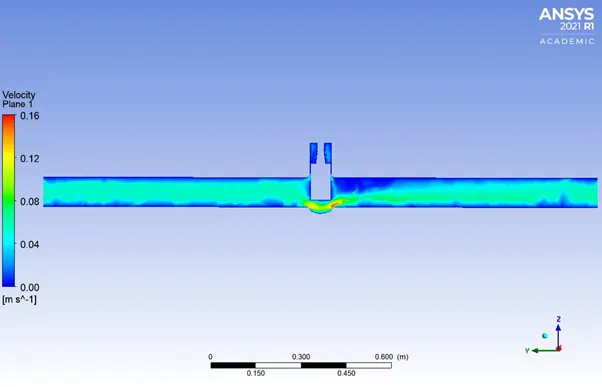
- Create Contour → Velocity → Field Variable = Plane-YZ
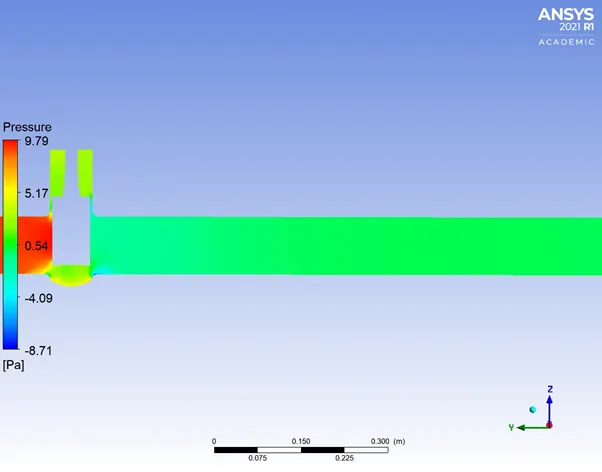
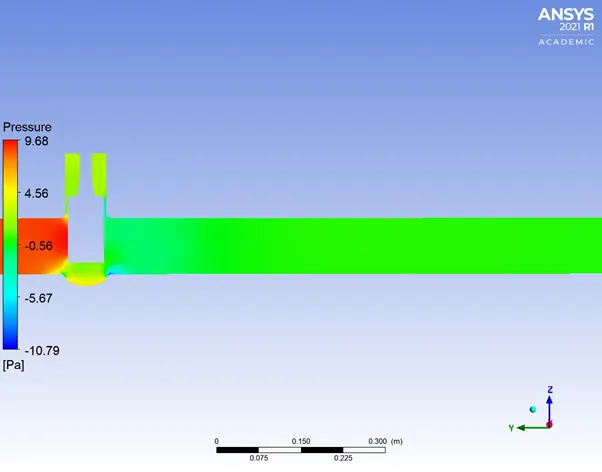
- Create Contour → Pressure → Field Variable = Plane-YZ
- Activities → Create Animation → Solution Animation → Velocity Contour
Results –
10% Lift – 10 mm opening

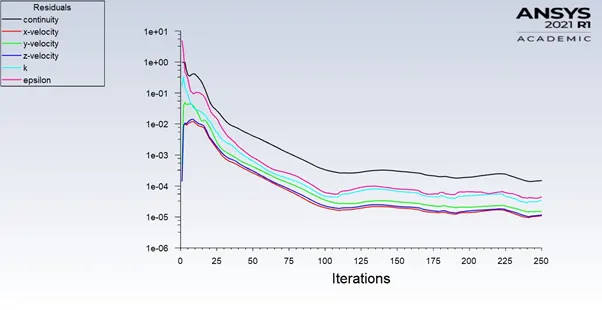
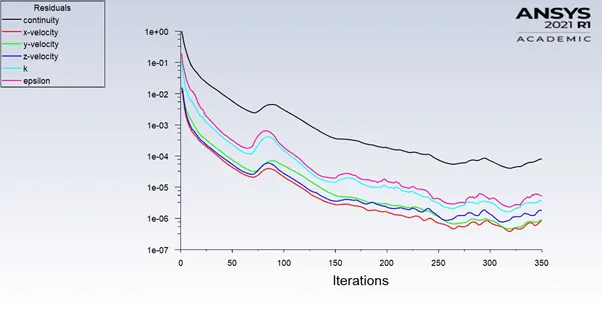
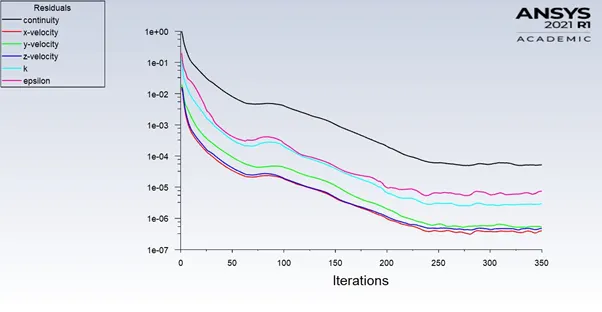
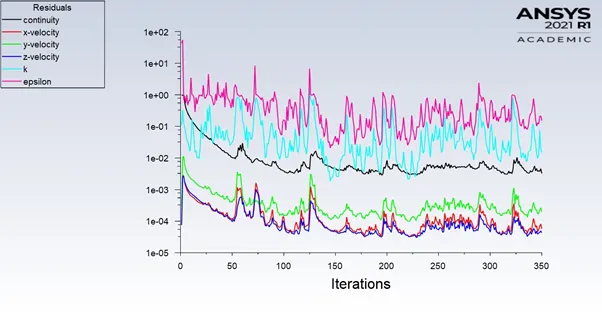
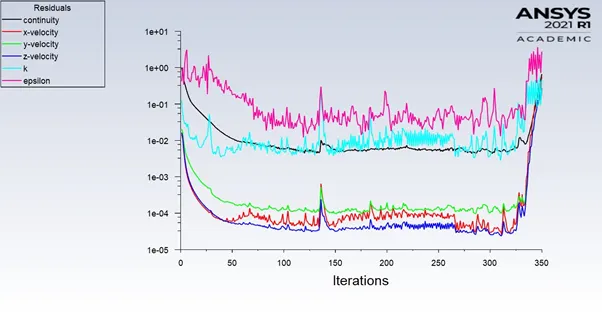
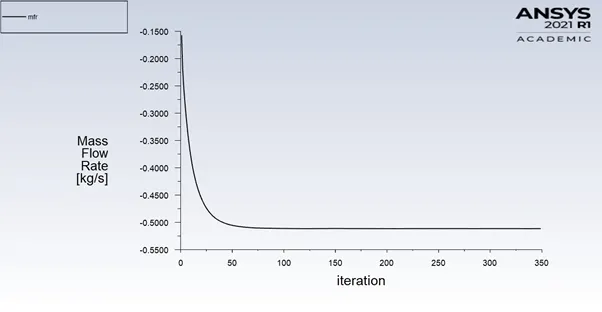
Residual Plot –
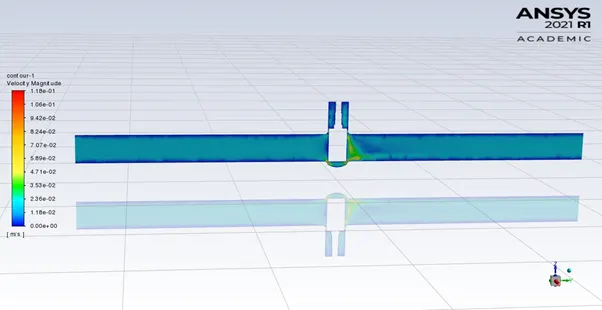
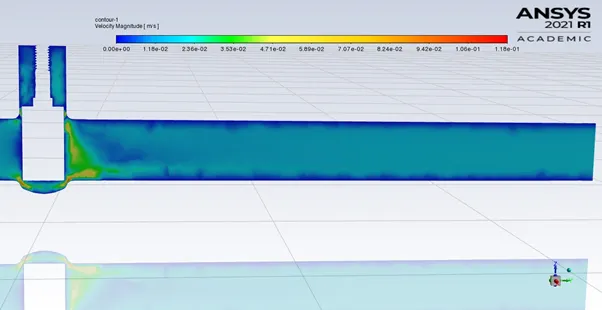
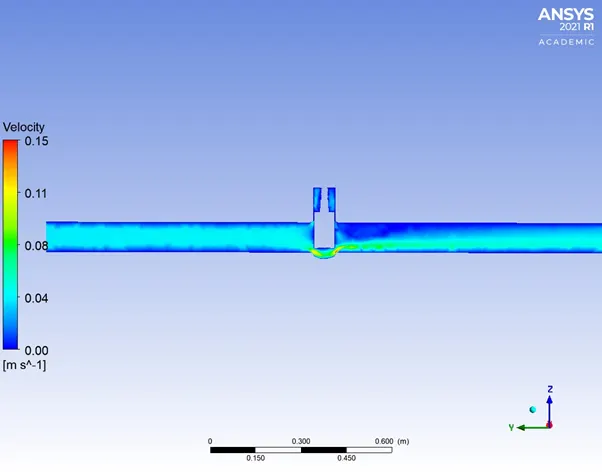
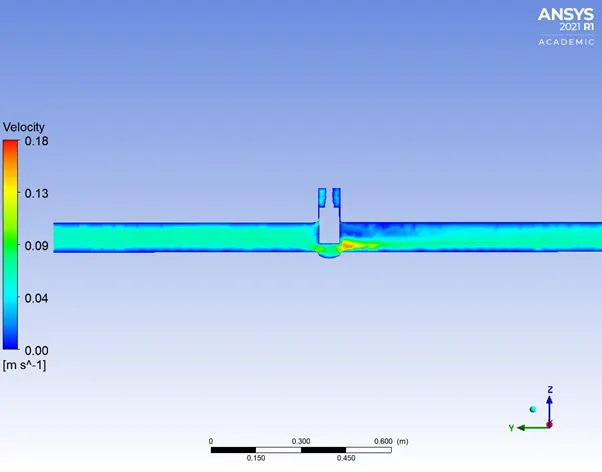
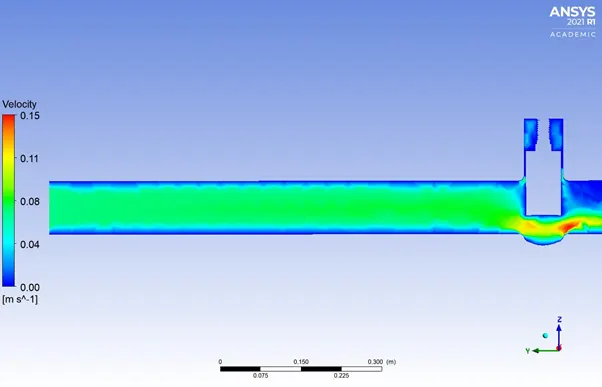
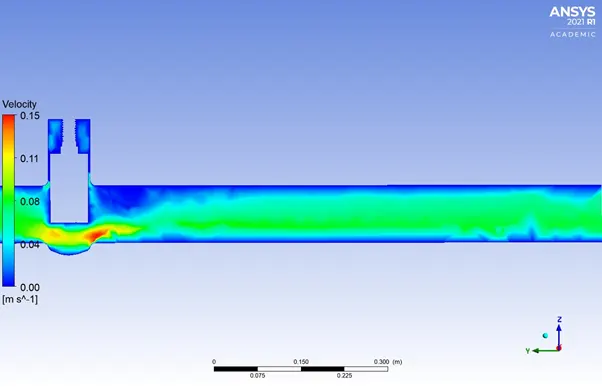
Velocity Contour –
Before valve:
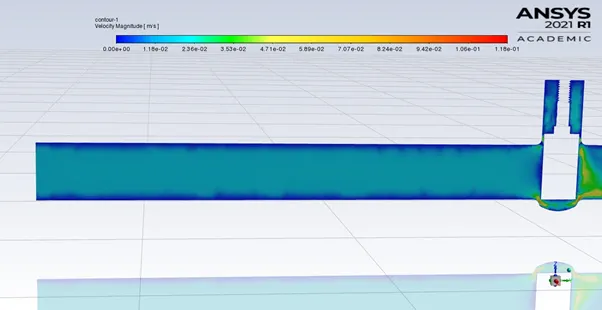
After valve:
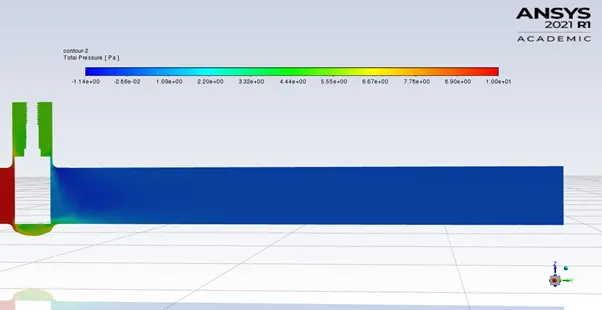
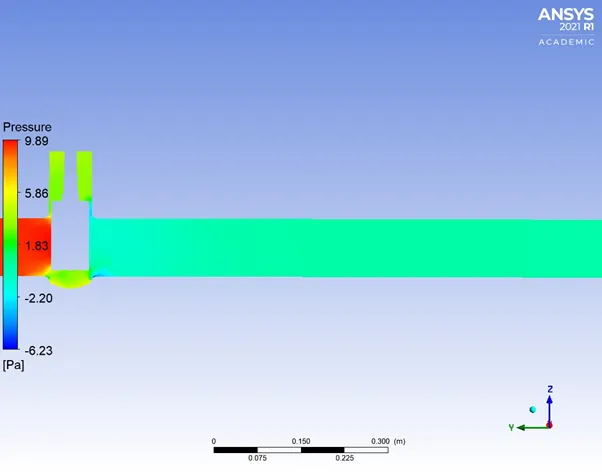
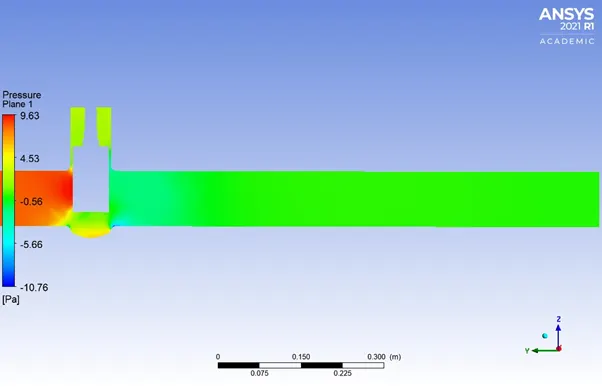
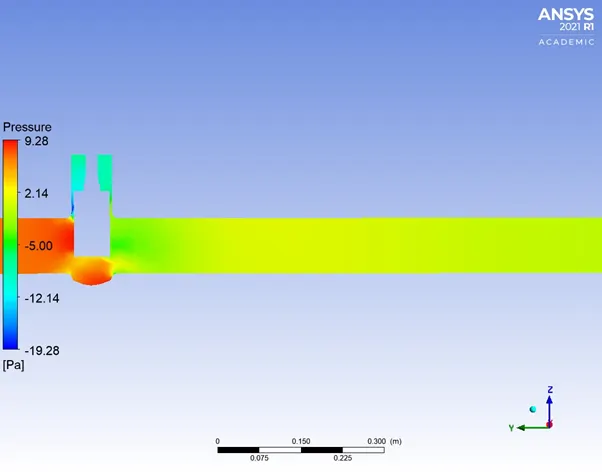
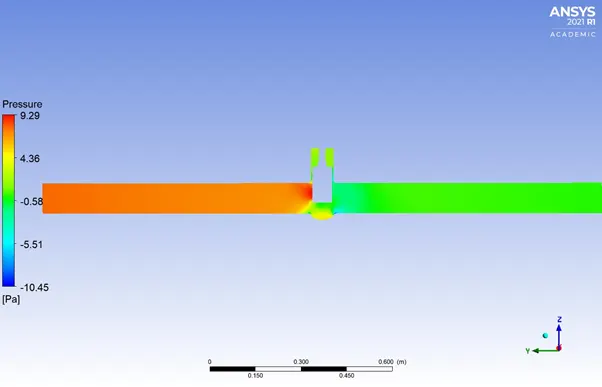
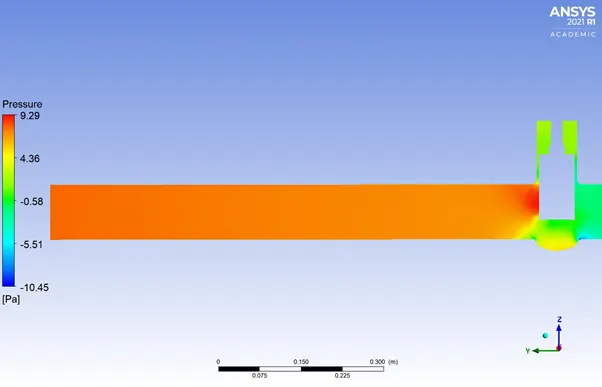
Pressure Contour –
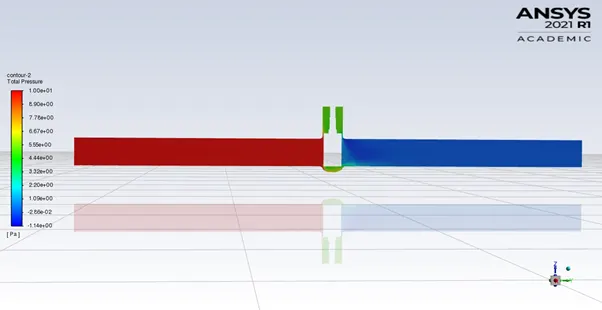
Before valve:
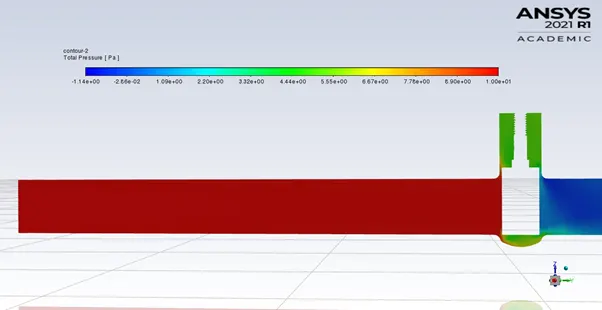
After Valve:
------------------------------------------------------------------------------------------------------------------------------
20% Lift – 15 mm opening

Residual Plot:
Velocity Contour –
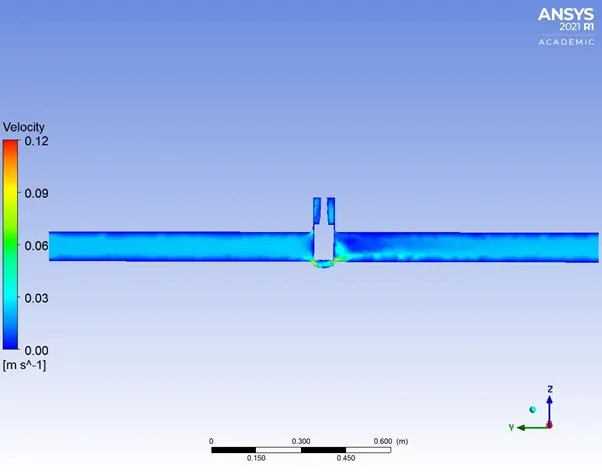
Before valve:
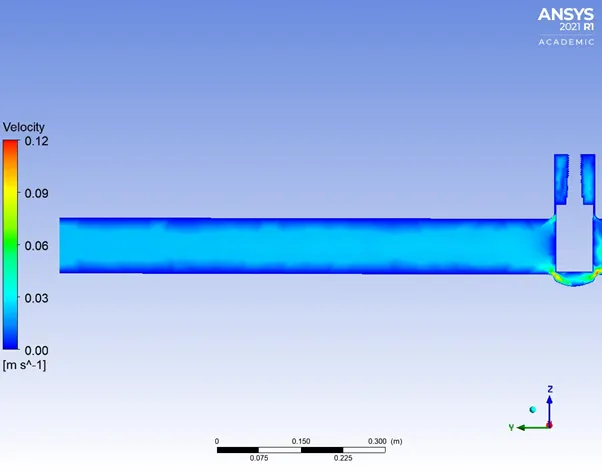
After Valve:
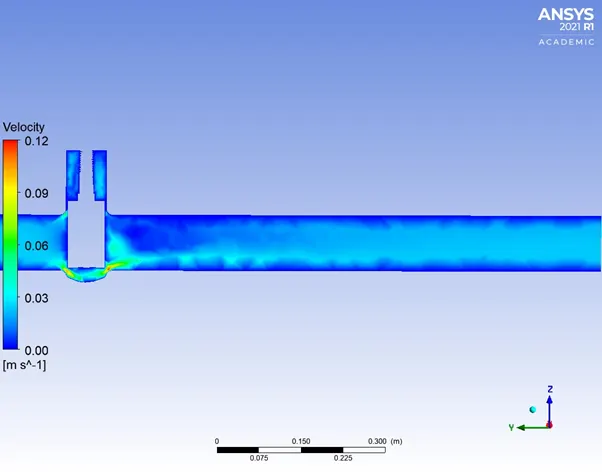
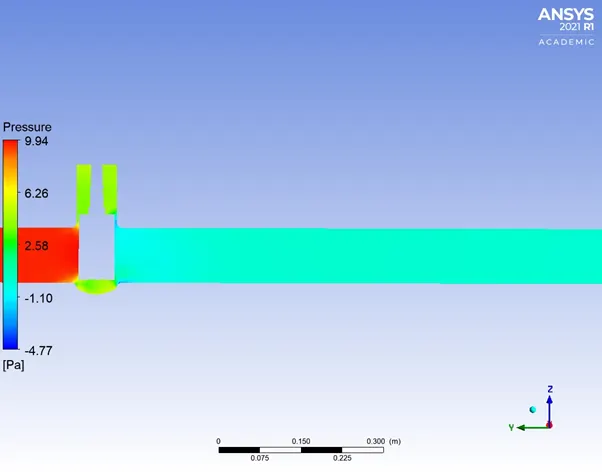
Pressure Contour –
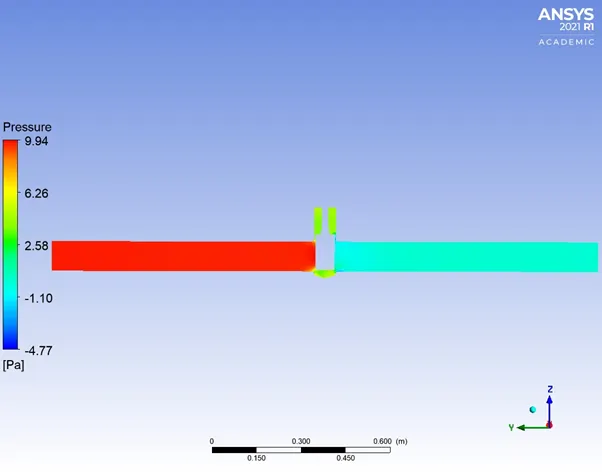
Before valve:
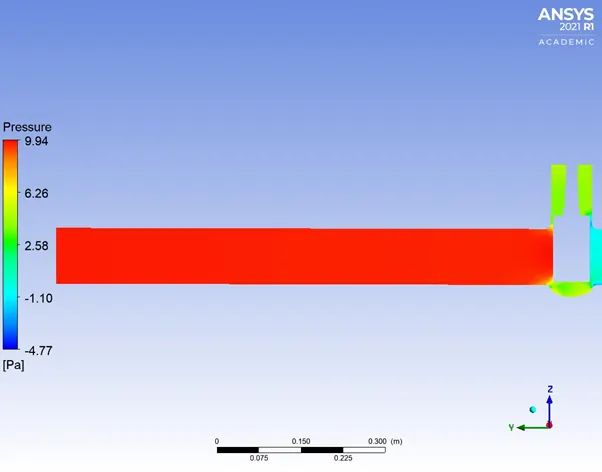
After Valve:
---------------------------------------------------------------------------------------------------------------------------------
30% Lift – 20 mm opening

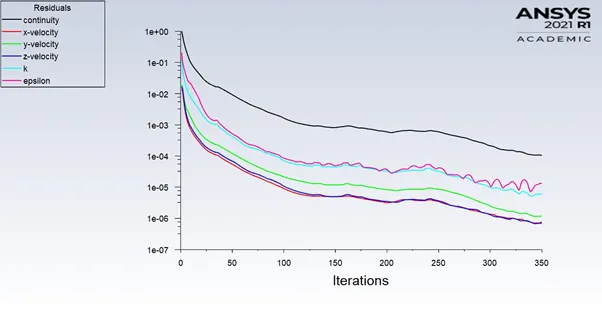
Residual Plot:
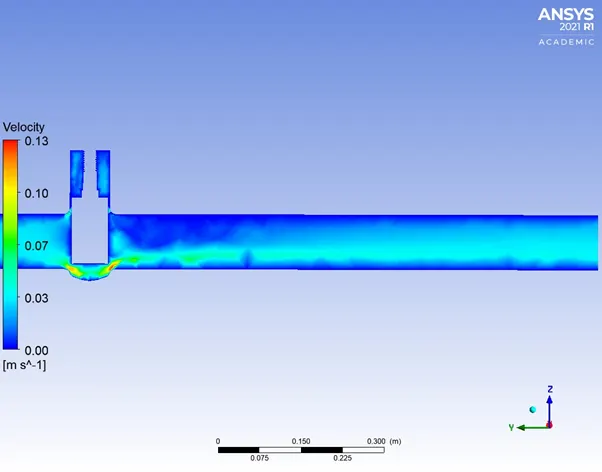
Velocity Contour –
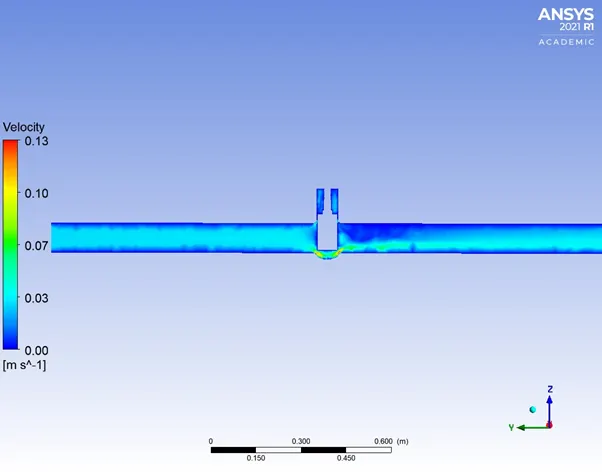
Before valve:
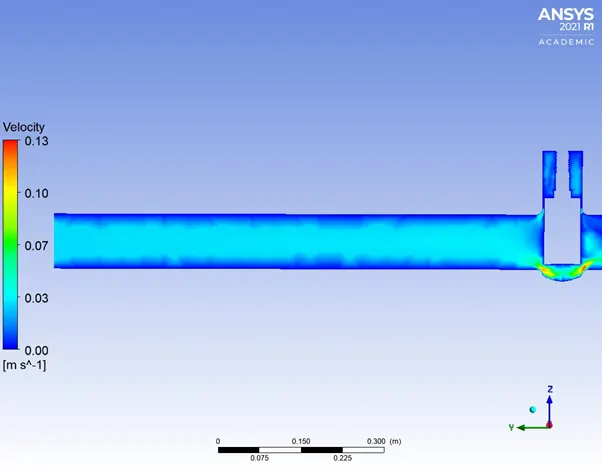
After Valve:
Pressure Contour –
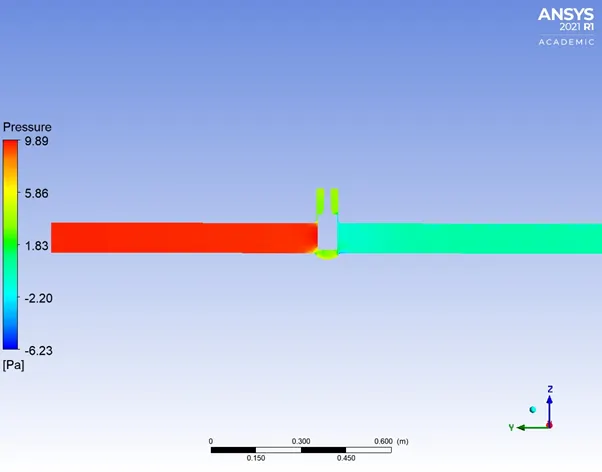
Before valve:
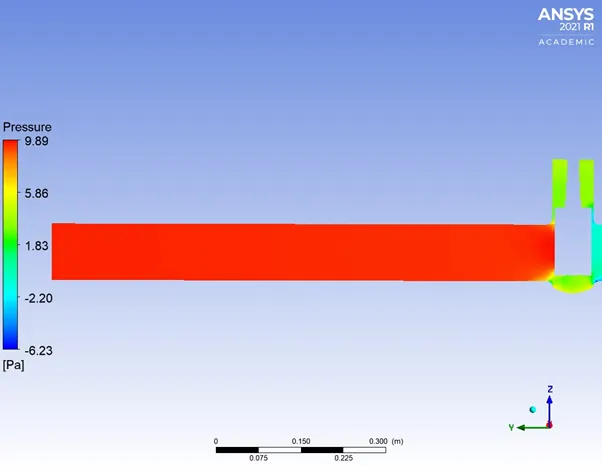
After Valve:
--------------------------------------------------------------------------------------------------------------------------------------
40% Lift – 25 mm opening

Residual Plot:
Velocity Contour –
Before valve:
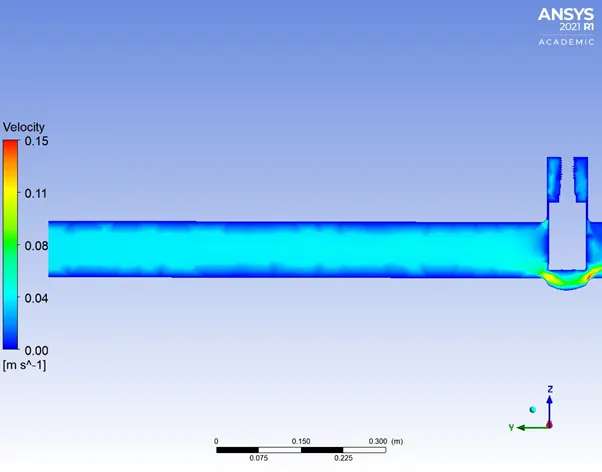
After Valve:
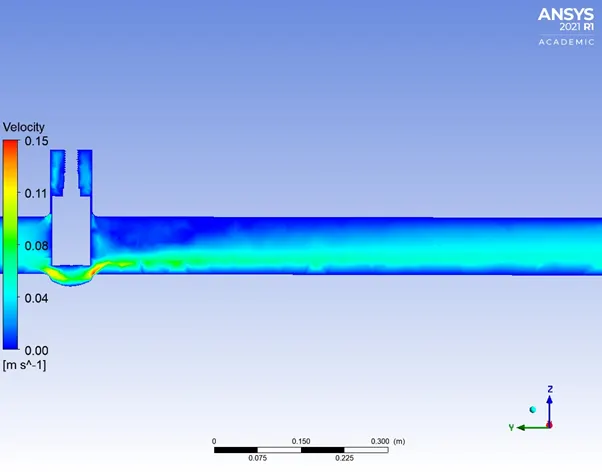
Pressure Contour –
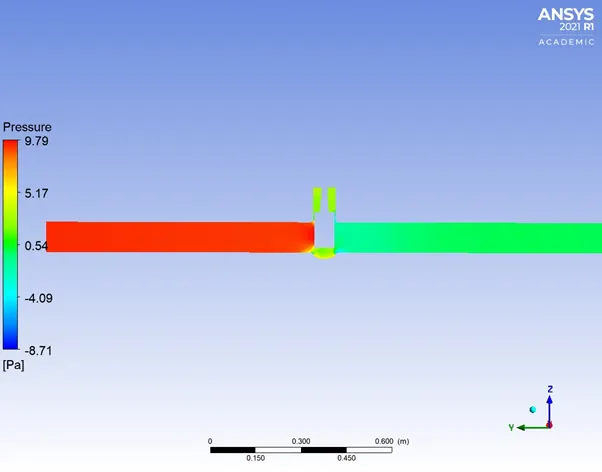
Before valve:
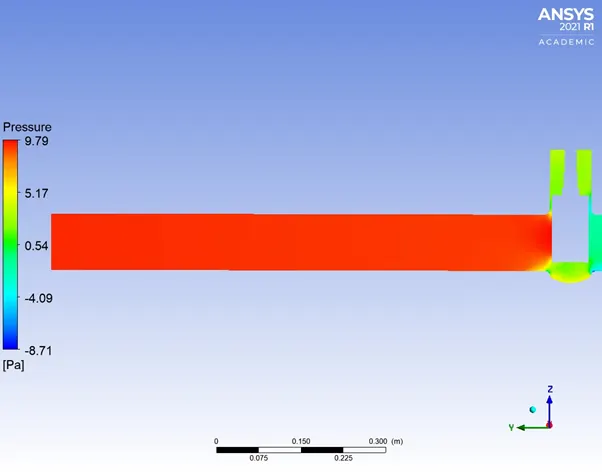
After Valve:
------------------------------------------------------------------------------------------------------------------------------
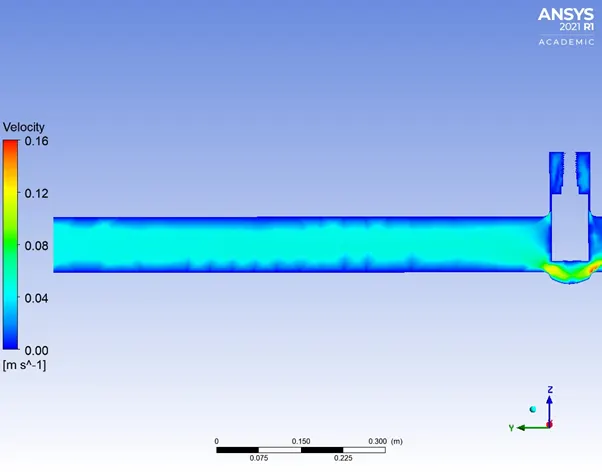
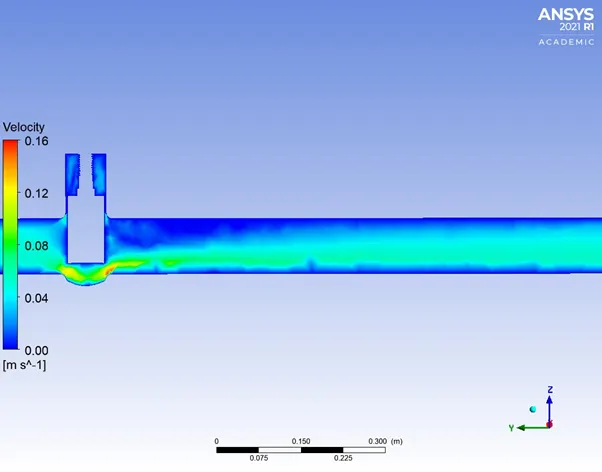
50% Lift – 30 mm opening

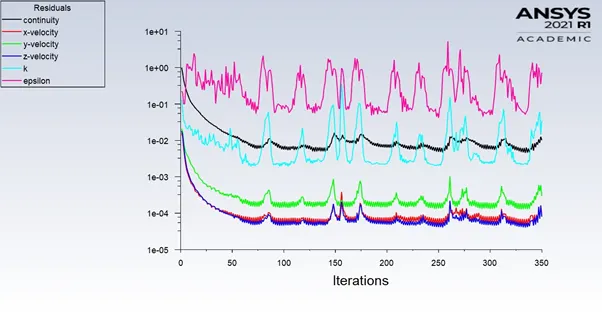
Residual Plot:
Velocity Contour –
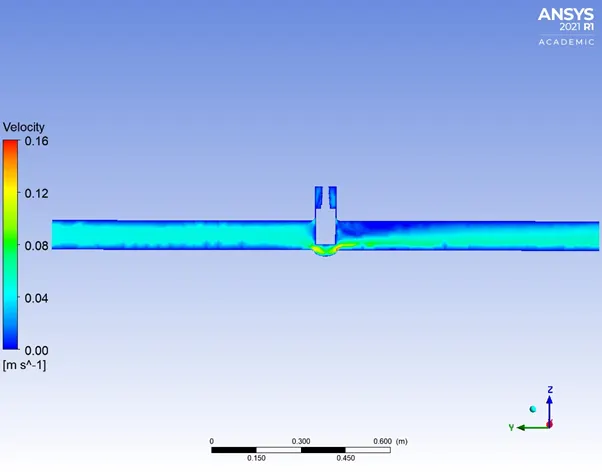
Before valve:
After Valve:
Pressure Contour –
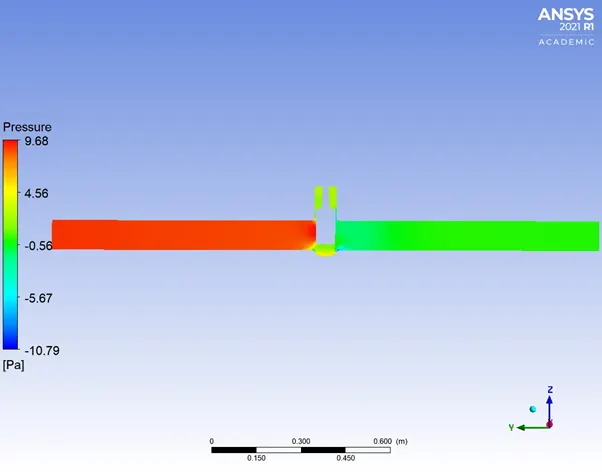
Before valve:
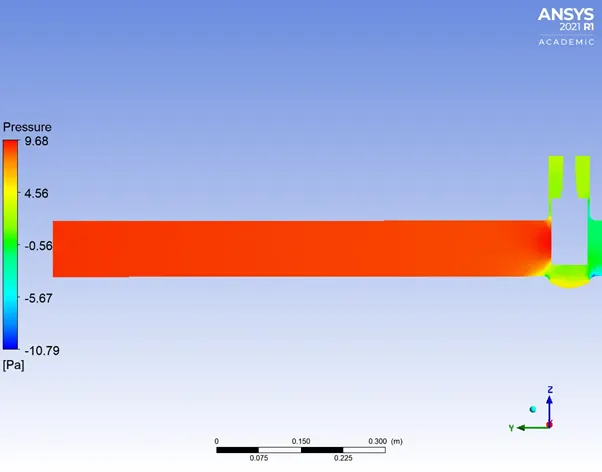
After Valve:
--------------------------------------------------------------------------------------------------------------------------------
60% Lift – 35 mm opening

Residual Plot:
Velocity Contour –
Before valve:
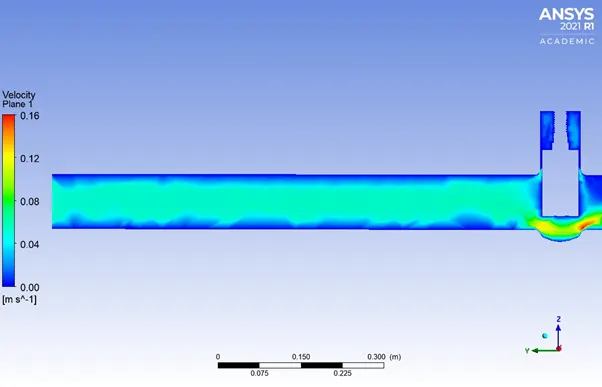
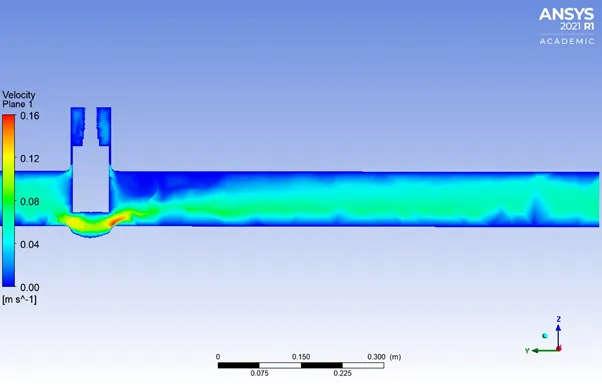
After Valve:
Pressure Contour –
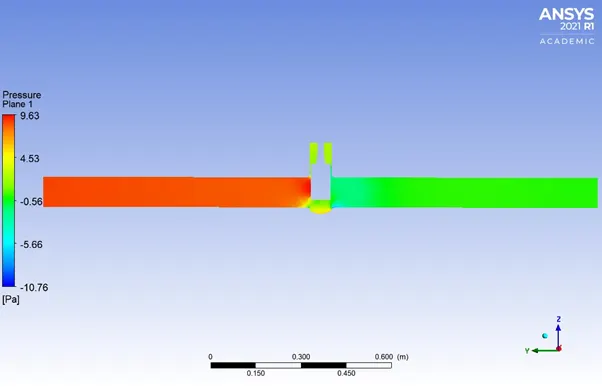
Before valve:
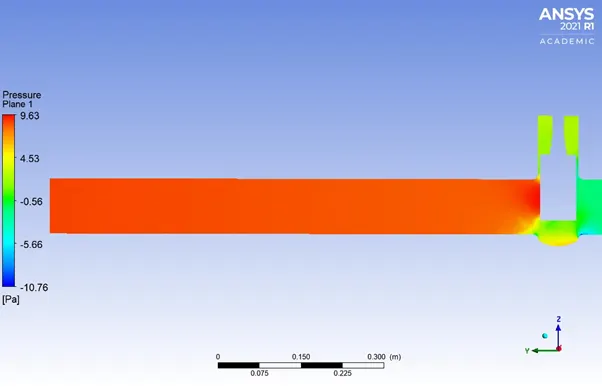
After Valve:
-----------------------------------------------------------------------------------------------------------------------------------
70% Lift – 40 mm opening

Residual Plot:
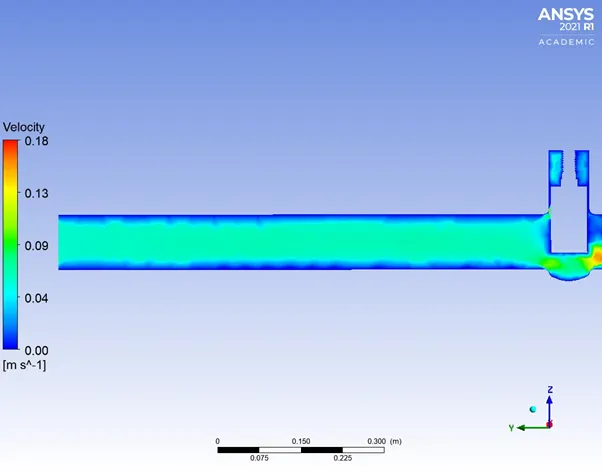
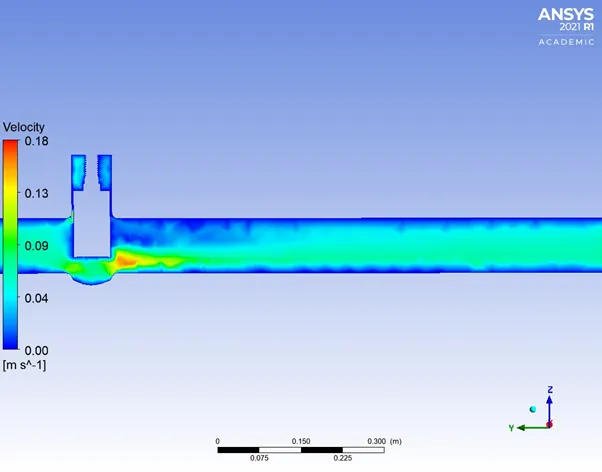
Velocity Contour –
Before valve:
After Valve:
Pressure Contour –
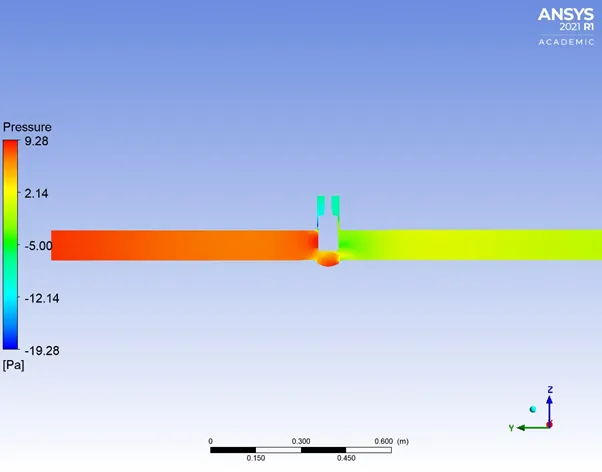
Before valve:
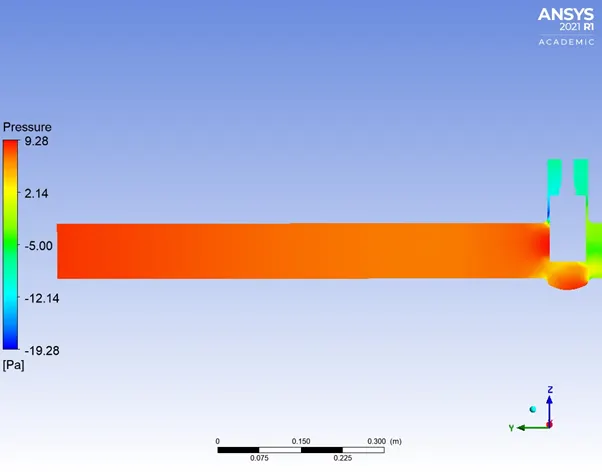
After Valve:
-------------------------------------------------------------------------------------------------------------------------------
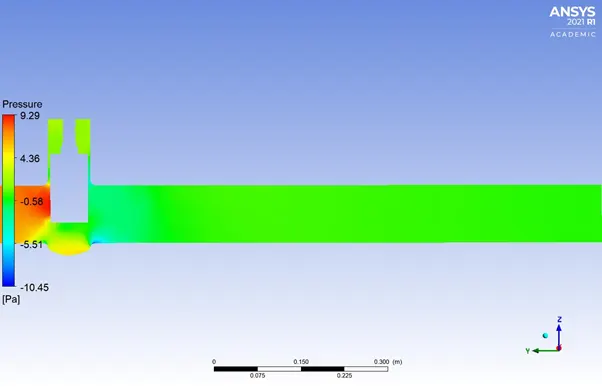
80% Lift – 45 mm opening

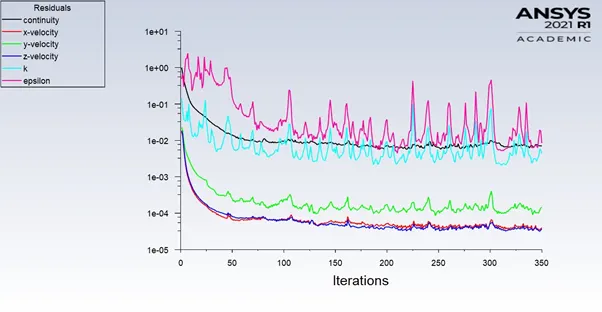
Residual Plot:
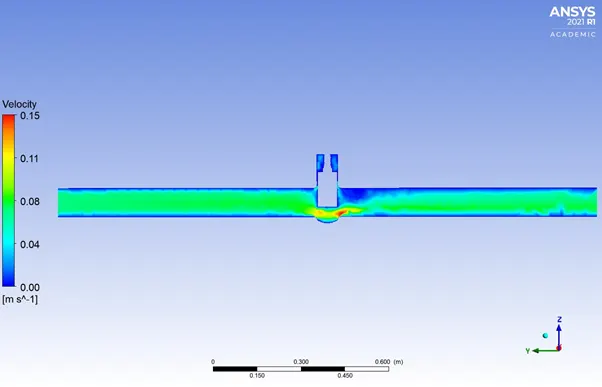
Velocity Contour –
Before valve:
After Valve:
Pressure Contour –
Before valve:
After Valve:
---------------------------------------------------------------------------------------------------------------------------------
Parametric Study –
Flow Coefficient:
Flow Factor:
We know that,
Q (Rate of Flow) = Mass flow rate/ Density of Fluid
Density of water = 1000 kg/m^3
|
Gate disk height (mm) |
Mass flow rate (kg/s) |
Q in (m^3/hr) |
Q in (gallon/min) |
Delta P across the Valve (Pa) |
Delta P in (psi) |
Specific Gravity of fluid |
|
10 |
0.13623 |
0.4911 |
2.16 |
10 |
0.00145038 |
1 |
|
15 |
0.17459 |
0.6326 |
2.78 |
10 |
0.00145038 |
1 |
|
20 |
0.22161 |
0.8025 |
3.51 |
10 |
0.00145038 |
1 |
|
25 |
0.27748 |
1.0044 |
4.40 |
10 |
0.00145038 |
1 |
|
30 |
0.34046 |
1.2256 |
5.40 |
10 |
0.00145038 |
1 |
|
35 |
0.39956 |
1.4384 |
6.33 |
10 |
0.00145038 |
1 |
|
40 |
0.46234 |
1.6644 |
7.32 |
10 |
0.00145038 |
1 |
|
45 |
0.51145 |
1.8412 |
8.10 |
10 |
0.00145038 |
1 |
Data Table –
|
Gate Lift % |
Gate Opening in (mm) |
Mass Flow Rate (kg/s) |
Flow Factor – Kv |
Flow Coefficient – Cv |
|
10 |
10 |
0.13623 |
49.11 |
56.71 |
|
20 |
15 |
0.17459 |
63.26 |
73 |
|
30 |
20 |
0.22161 |
80.26 |
92.16 |
|
40 |
25 |
0.27748 |
100.44 |
115.53 |
|
50 |
30 |
0.34046 |
122.56 |
141.80 |
|
60 |
35 |
0.39956 |
143.84 |
166.21 |
|
70 |
40 |
0.46234 |
166.44 |
192.20 |
|
80 |
45 |
0.51145 |
184.12 |
212.68 |
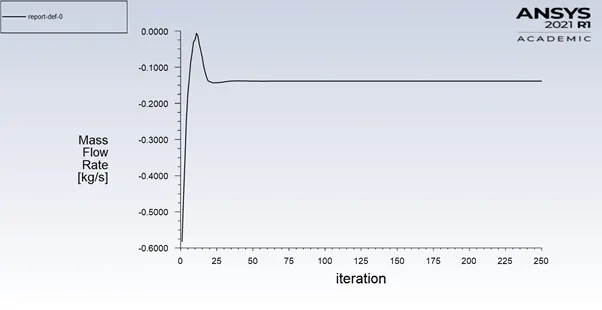
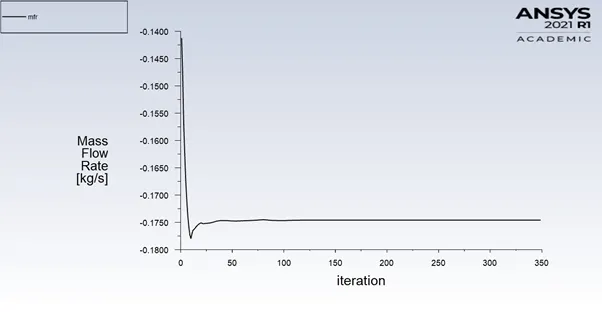
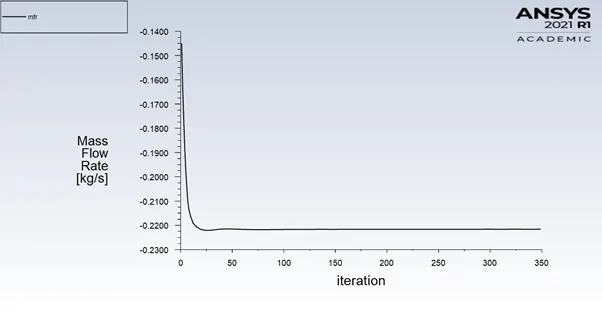
Mass Flow Rate Plots -
10%
20%
30%
40%
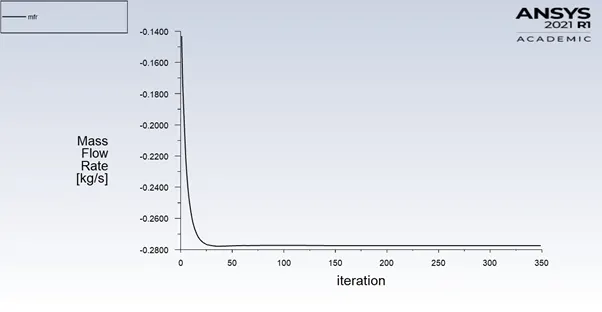
50%
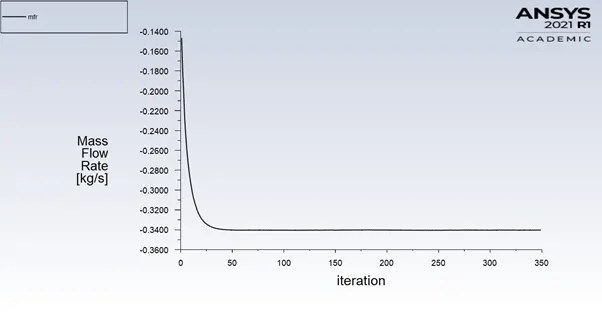
60%
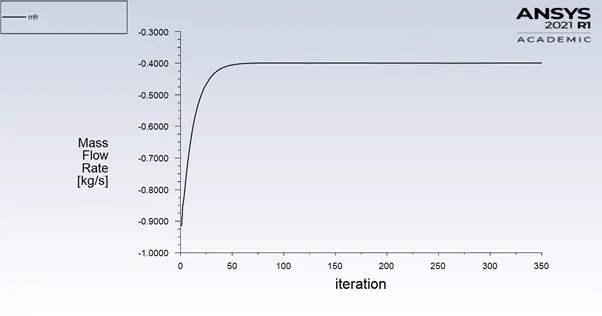
70%
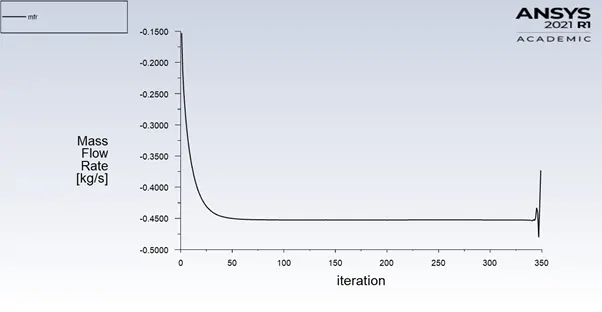
80%
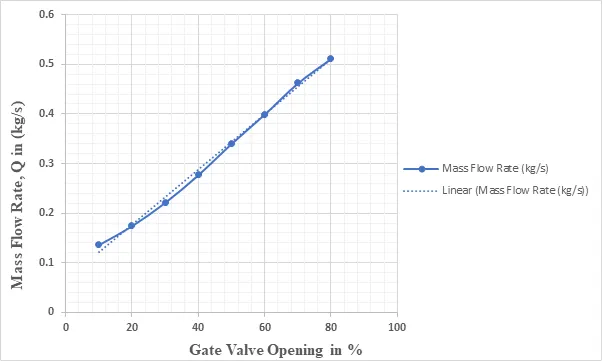
Graph –
Gate Valve Opening in (%) Vs Mass Flow Rate in (kg/s)
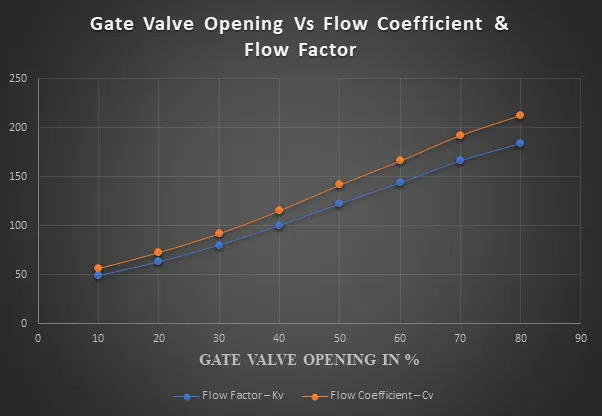
Kv & Cv Vs Gate Lift %
Inference –
- Mass flow rate increases with increase in lift of valve opening.
- As the opening of the gate disc increases-the mass flow rate of fluid also increases.
- At the maximum lift of the gate disk fluid flows freely without any disturbance or restriction.
- Flow coefficient and the flow factor increases with increase in valve openings i.e., as lift increases the flow factor and the flow coefficient raises.
- The flow coefficient is used to determine the valve size that will best allow the valve to pass the required flow rate which provide stable control of process fluid.
- Velocity contour helps in understanding the behaviour of fluid flow behave w.r.t opening of gate valve. Indicates the maximum velocity throughout the flow.
- As Lift increases, Output pressure increases
- Due to high velocity and decrease in pressure drop there is formation of cavitation in the liquid system.
- Below pressure drop, the liquid state to boil and produce vapour bubble creating vapour pressure causing high pressure waves.
- These implosion result in very high noise level.
Conclusion –
The parametric study was performed on the gate valve by varying the lift from 10% to 80%. The following inferences were made during the study:
- As lift of gate disc increasesà fluid flow increases and flow coefficient & Flow factor increases proportionally
Thus. study of the effect of opening the gate valve on the fluid characteristics was simulated successfully.