Parametric study on Gate valve.
Objectives of this study: To
- Derive mass flow rate values at the outlet for each design point.
- Calculate the flow co-efficient and flow factor for each opening and plot a graph of the same.
- Explain the observed results of mass flow rate and flow coefficient.
1. Introduction:
Gate values are mechanical devices that are generally used to restrict the fluid flow rather than controling the fluid flow. Once the gate is opened, there is no restriction for the flow. So in high pressure flows, where gate valves are used, a small bypass or a number of bypass valves are necessary to avoid breakdown of gate valve's stem (threading).
Gate valve's main components are bonnet, body, seat, gate and actuator. The obstruction to the fluid's path is caused by a rectangular or triangular wedge used in the gate valve. The actuator can be rotated on the top to release the wedge. These are commonly used in places where minimal flow restriction is needed. As there are no flow restrictions once the valve is completely open, there is very less or no pressure loss. There are two types of gate valves - rising stem and no-rising stem.
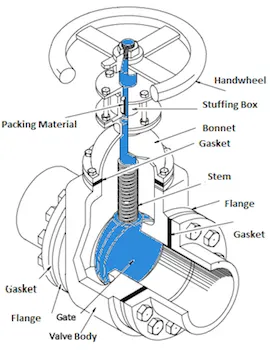 Source - Tamson.com
Gate valves are used in both gaseous as well as liquid systems. Eg: Water distribution pipelines, low temperature and low pressure systems such as fire protection pipings in buildings, etc.
2. Approach:
- Import the solid CAD model to spaceclaim and create the fluid volume.
- Insert the gate opening distance as a parameter.
- Mesh the geometry for default values and obtain a qualitative result. Create a finer mesh afterwards.
- Select realizable K-epsilon turbulence model with scalable wall function - As the reynolds number is over 2000, the flow can be considered turbulent.
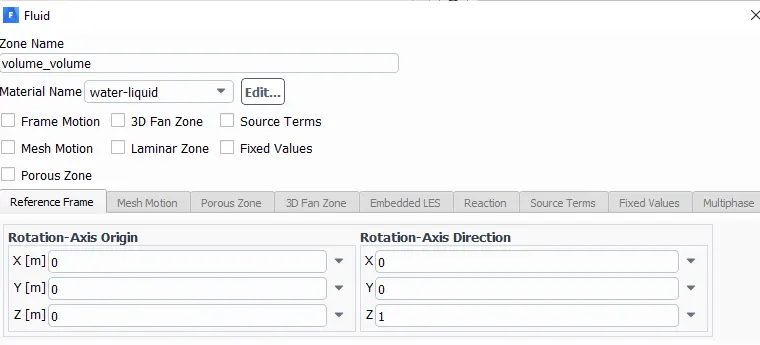
- Add liquid water and make it the volume in cell zone conditions.
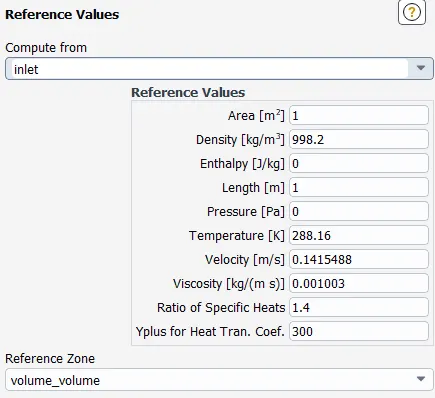
- Create a pressure inlet and input the necessary value.
- Use standard initialization to initialize the problem.
- Create a cut plane to view velocity contour.
- Create a solution animation.
- Define outlet mass flow rate report and plot.
- Calculate the values of flow coefficient and flow factor.
- Use the update all design points to obtain the mass flow rate values for all values of gate opening distance.
- Compare the results through graphs and draw appropriate inferences.
3. Pre-processing:
3.1 Geometry
The geometry is imported to spaceclaim and the fluid volume is created by selecting inlet and outlet. After this all the other parts are suppressed for further process.
The gate is initially given a rise of 10mm and then this is set as a parameter. This simplifies the job of performing individual simulations for every value of gate rise.
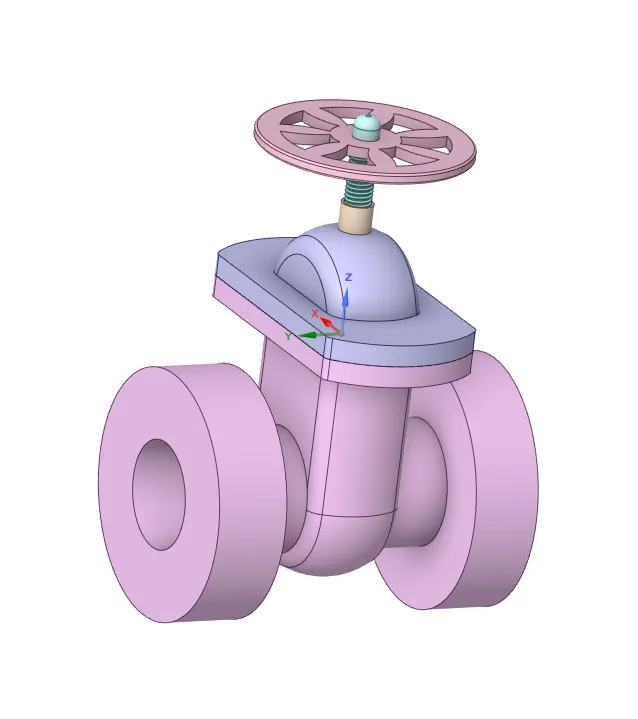
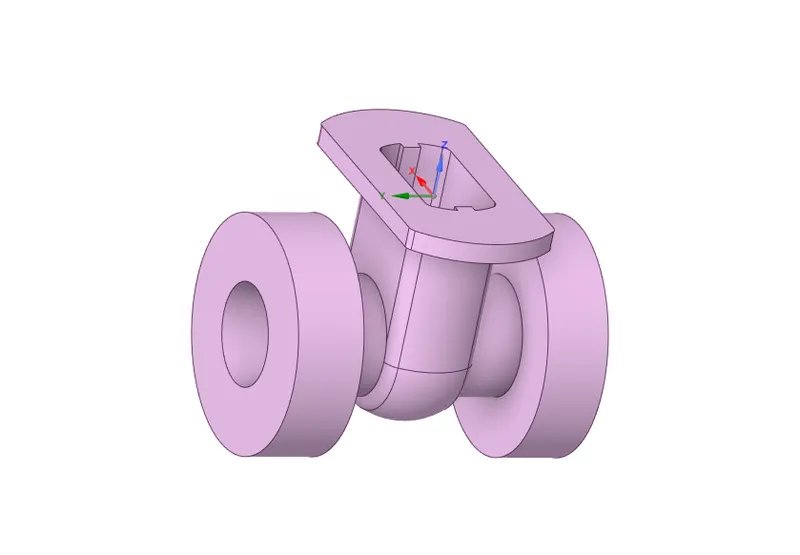
In the images first one indicates the assembly of gate valve and the seond one indicates only the valve body. This body is used to create the fluid volume. For this study, 800 mm length of fluid volume is considered outside as shown in the below image.
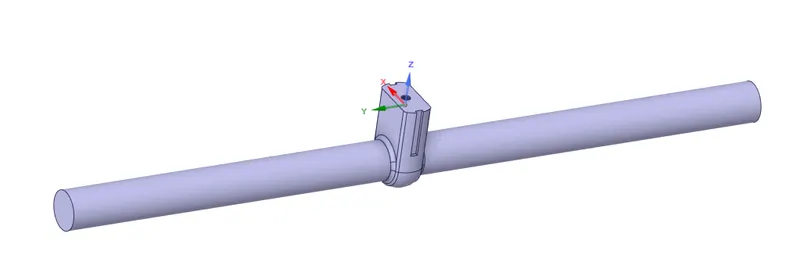
The above and below image represents fluid volume without and with valve body respectively.
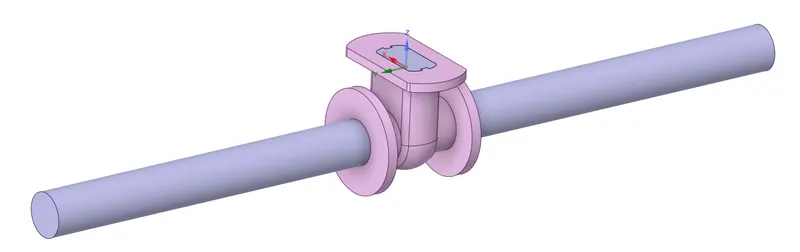
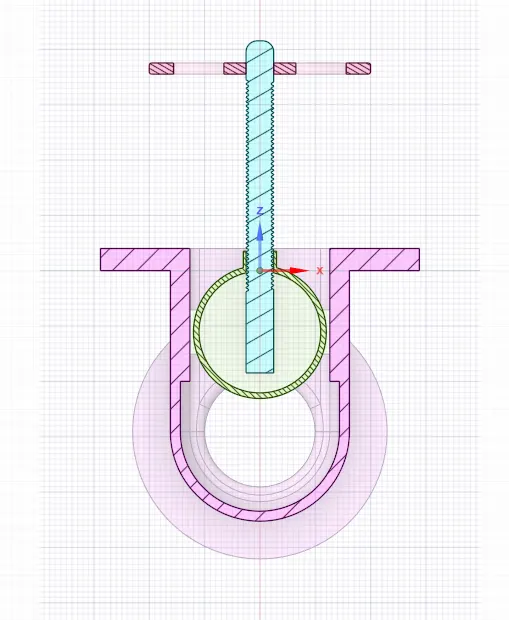
The above image shows the gate rise of 80% without fluid volume.
3.2 Mesh
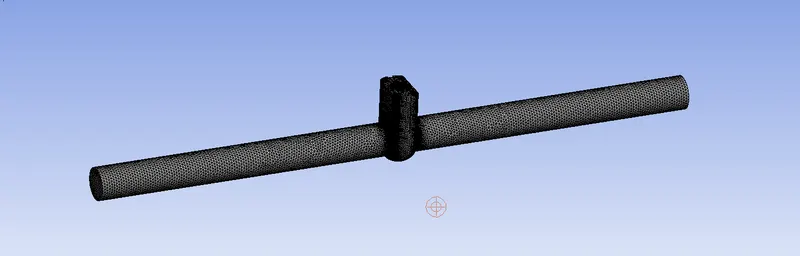
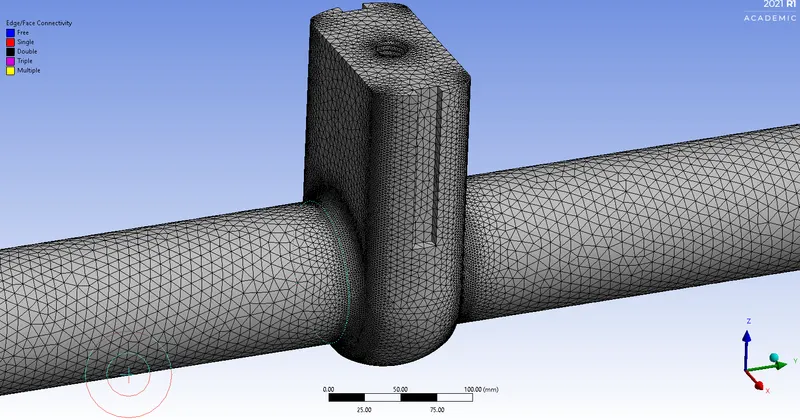
As the study is conducted in student version, the mesh size is limited to less than 0.5 million cells. The meshing parameters considered are as shown in the table below:
| No of nodes | No of elements | Element size | Curvature min size | Curvature normal angle |
| 85643 | 424593 | 30mm | 0.3mm | 10˚ |
4. Solver:
Pressure based steady solver is used for the study. And realizable k-epsilon model with scalable wall functions is used. The reason for choosing this model is because the flow has reynolds number in the turbulent range and for turbulent flow, near wall treatment becomes important. In the gate valve as well, the treatment of viscous sub-layer is important.
And besides all that k-epsilon model has good convergence rate and consumes less memory.
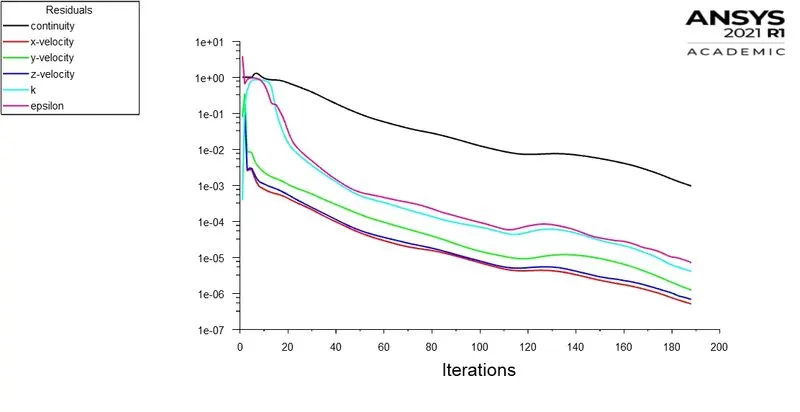
A flux report for outlet mass flow rate is generated and a plane is created to visulize the velocity changes due to different values of gate lift. The animation is saved for every iteration. 250 iterations are considered, but the solution converges near 190 iterations.
5. Results:
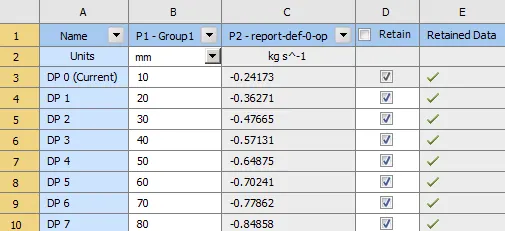
For different gate valve lift values, the output of mass flow rate is as shown in table below:
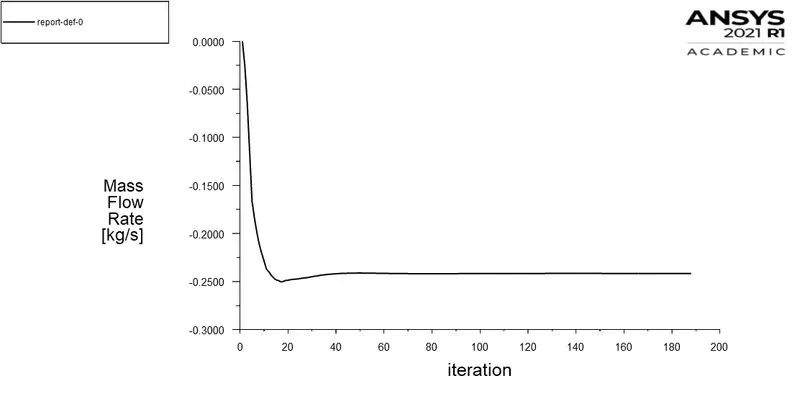
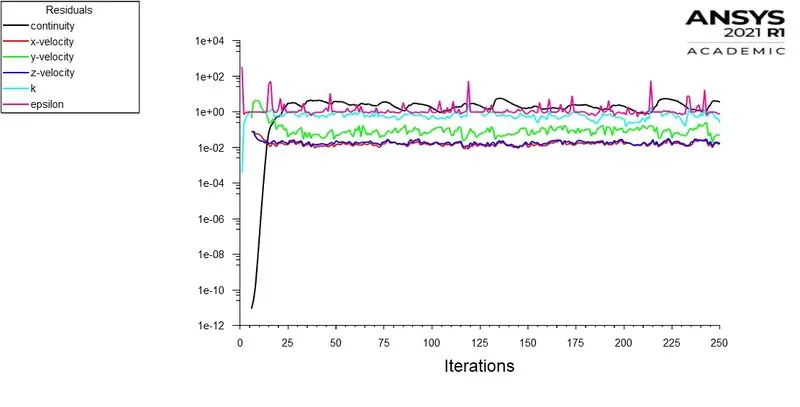
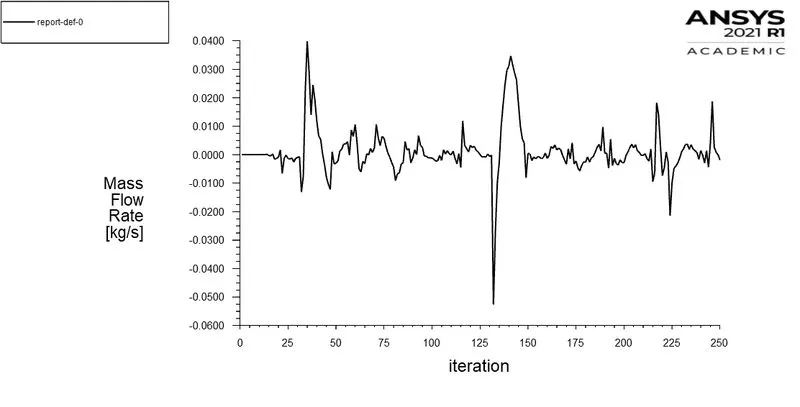
- The below graphs are of residuals and of mass flow rate at the outlet respectively. The solution reaches convergence at around 190 iterations.
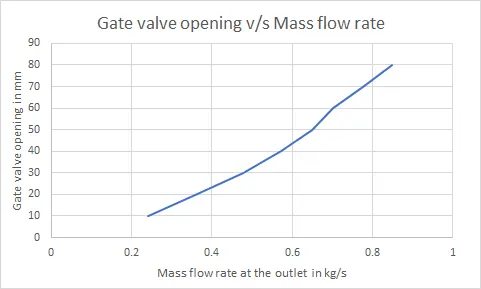
- The mass flow rate at outlet is for the gate rise of 10% is -0.241676 kg/s. Simlilarly till 80% of the gate lift, the values for mass flow rate are displayed in the above table.
- Images for only one value of gate rise are shown. All the other values of gate rise are parameterized and the mass flow rate values are obtained directly. This saves computational time.
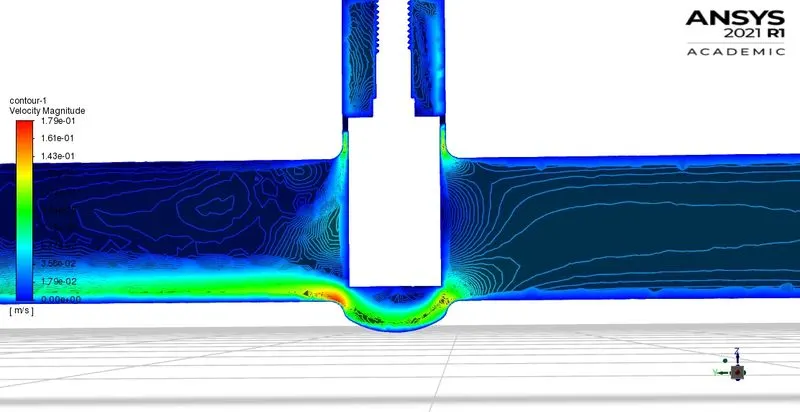
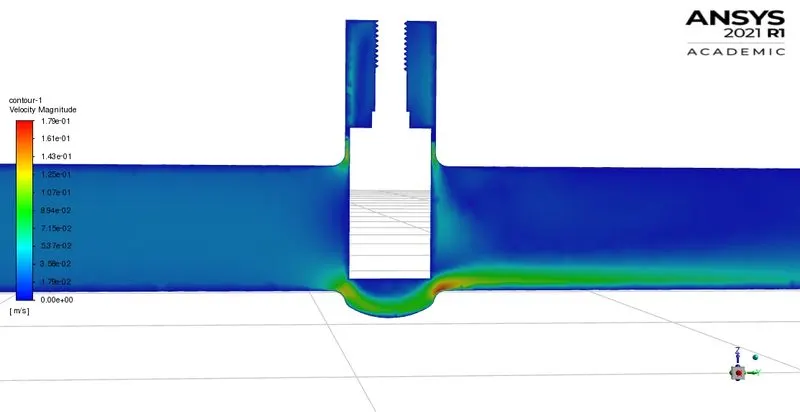
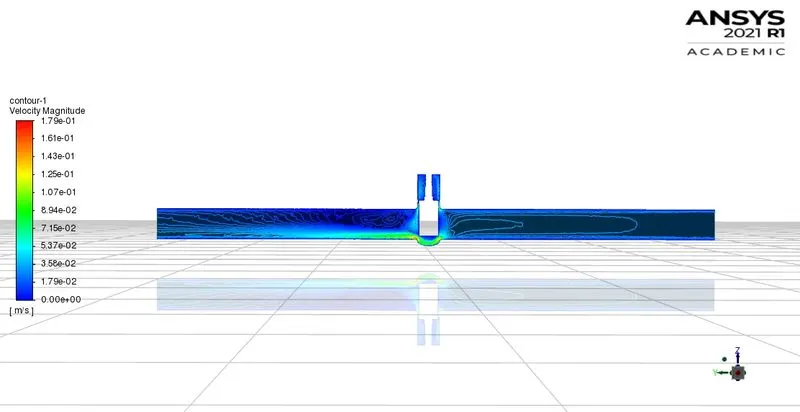
For 10% rise:
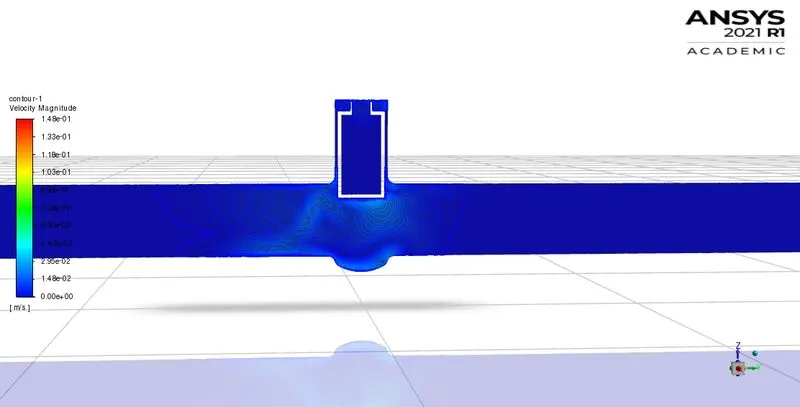
- The first and last graph below indicates the velocity contour with contour lines and second one without contour lines.
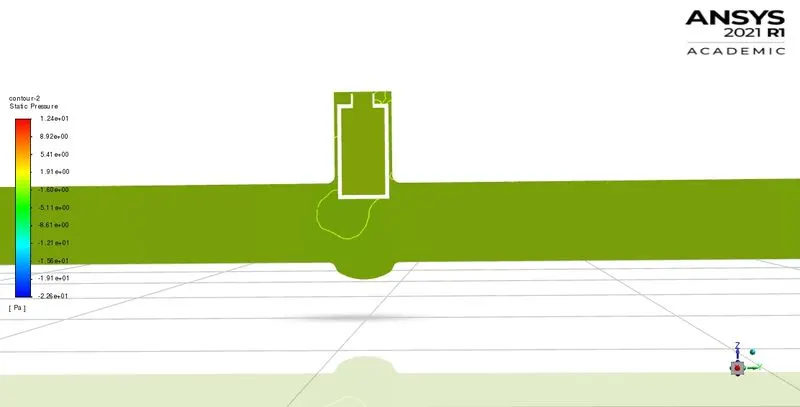
- Below image represents the pressure contour for 10% rise. As the gate is not fully opened, the pressure on the inlet side is more and therefore might influence on the stem thread negatively.
For 80% gate valve rise:
Residuals:
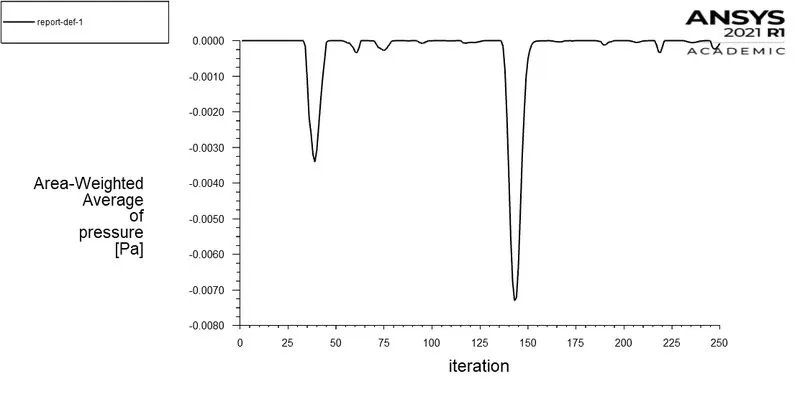
Mass flow rate and pressure at the outlet:
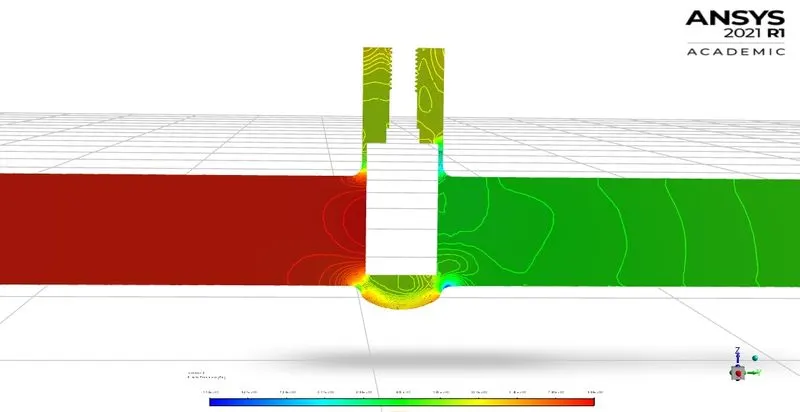
Velocity and pressure contours respectively:
--------------------------------------------------------------------------------------------------------------------------------------------------------------------
- The relation between gate valve lift and mass flow rate is non-linear which is indicated in the graph below.
5.1 Flow co-efficient:
Flow co-efficient is used to express the flow capacity and it is commonly used as a standard in manufacturing industries across the globe.
The value of flow co-efficient indicates the volume of water at `60^0`F that can pass through a valve in one minute with a pressure drop of 1psi. By using the value of flow co-efficient, it is possible to compare different values and evaluate the valve needed for any specific applicaiton. The expression is given by: `C_v = Q*sqrt((SG)/(DeltaP))`
where Q is the mass flow rate in kg/s
SG is the specific gravity of the fluid and `DeltaP`is the pressure drop across the valve.
Once the flow co-efficient is calculated with the required flow rate and possible pressure drop values, the valve should be selected for a gate opening of 10% to 80%. This way there will not be much damage to valve due to increased pressure on the stem thread.
While calculating flow co-efficient, the pressure at outlet is observed to be very less - less than `10^-5`. So, when a conversion factor is multiplied to convert it into psi, the value is nearly zero. Therefore the pressure drop is assumed to be uniform for all the cases of gate rise.
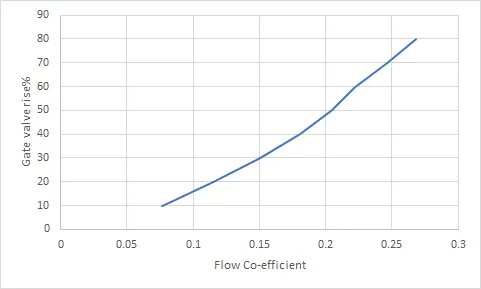
Flow co-efficient is calculated for every value of gate rise as shown below:
For 10% gate rise: Q = -0.241676 kg/s, SG (of water) = 1 and `DeltaP`= 10Pa. Therefore `C_v = 0.241676*sqrt((1/10)) = 0.07642`
Similarly, for 20% gate rise: `C_v = 0.1146`
For 30% gate rise: `C_v = 0.1507`
For 40% gate rise: `C_v = 0.1806`
For 50% gate rise: `C_v = 0.2051`
For 60% gate rise: `C_v = 0.2221`
For 70% gate rise: `C_v = 0.2462`
For 80% gate rise: `C_v = 0.2683`
Gate valve rise v/s Co-efficient value:
5.2 Flow factor:
Valve co-efficient is expressed in imperial units and flow factor is expressed in metric units. Flow factor is defined as the volume of water at temperature `5^0` to `30^0`C flowing through a valve per minute with a pressure drop of 1 bar.
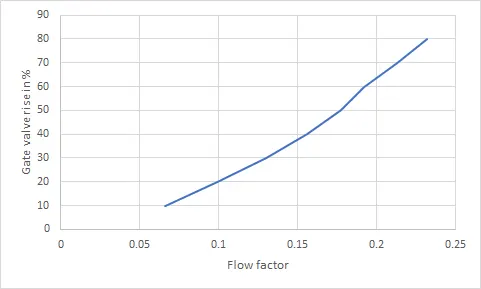
The expression for flow factoor is given by: `K_v = 0.865*C_v`, Where `C_v`is the flow co-efficient. The table constituting all of the parameters is shown below:
| Gate Valve rise in % | Mass flow rate at outlet in kg/s | Flow coefficient | Flow factor |
| 10 | 0.24167586 | 0.07642462 | 0.0661 |
| 20 | 0.36270623 | 0.11469778 | 0.0992 |
| 30 | 0.4766495 | 0.15072981 | 0.1304 |
| 40 | 0.57130928 | 0.18066386 | 0.1563 |
| 50 | 0.64874799 | 0.20515213 | 0.1775 |
| 60 | 0.70240581 | 0.22212022 | 0.1921 |
| 70 | 0.77862485 | 0.2462228 | 0.213 |
| 80 | 0.84857891 | 0.26834421 | 0.2321 |
Only the simulation images of 10% gate rise and 80% gate rise are shown here. Remaining all are calculated as parameters.
Gate valve rise v/s Flow factor value:
6. Conclusions
- The negative sign in the mass flow rate is due to the exiting nature of fluid and as the gate valve rises to higher percentages, mass flow rate increases. However, this relation is not linear.
- Similarly flow co-efficient and flow factor increase with the mass flow rate.
- For any specific application, flow factor needs to be calculated first so as to select the proper gate valve.
- Increasing the gate height increases the chances of damage to the stem thread and hence decreases the gate valve life which should be avoided.
- For the considered pressure value, Reynolds number is in the turbulent range and hence realizable k-epsilon model is used.
- It takes less time to complete simulation if a parameter is created for gate valve height. For the same reason only 10% and 80% gate rise results are shown in this study.
- Once the gate valve is opened near to 100%, the pressure is almost uniform throughout the valve. So this does not affect the performance of the valve unless the operating pressure is too high.
- If the operating pressure is too high, then may be one or more bypasss is needed for pressure meetering.
Sources: