Week 9 - Parametric study on Gate valve.
Aim:
- To perform a parametric study on Gate valve.
Objective:
- Obtain the mass flow rates at the outlet for each design point.
- Calculate the flow coefficient and flow factor for each opening and plot the graph.
- Discuss the results of the mass flow rate and flow coefficient.
Gate valve:
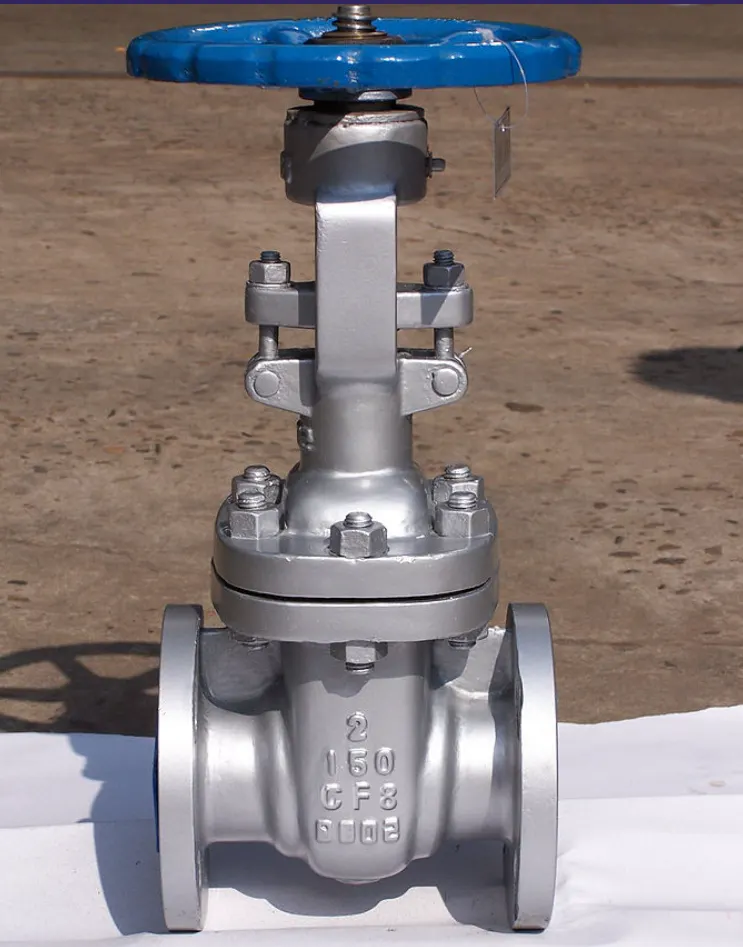
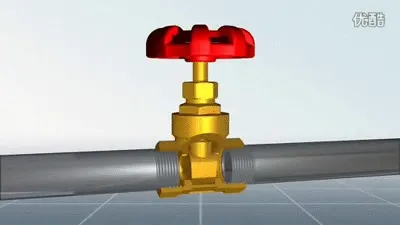
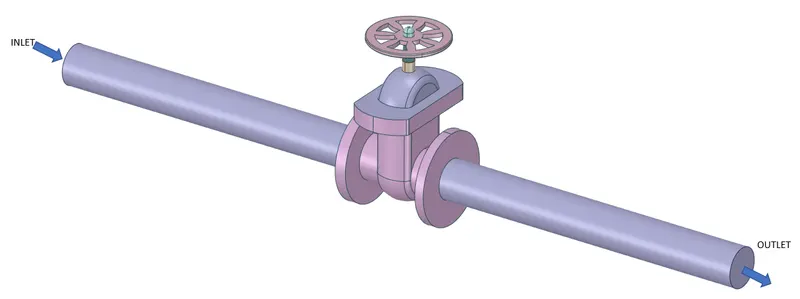
A gate valve controls the media's flow by lifting the gate (open) and lowering the gate (closed). A gate valve's distinct feature is the straight-through unobstructed passageway, which induces minimal pressure loss over the valve. The unobstructed bore of a gate valve also allows for a pig's passage in cleaning pipe procedures, unlike butterfly valves. Gate valves are available in many options, including various sizes, materials, temperature and pressure ratings, and gate and bonnet designs. A gate valve's main components are body, seat, gate, stem, bonnet, and actuator. The primary operation mechanism is straightforward. Turning the handwheel rotates the stem, which moves the gate up or down via the threads. They require more than one 360° turn to fully open/close the valve. Lifting the gate from the path of the flow, the valve opens. Lowering the gate to its closed position seals the bore resulting in a full closure of the valve.
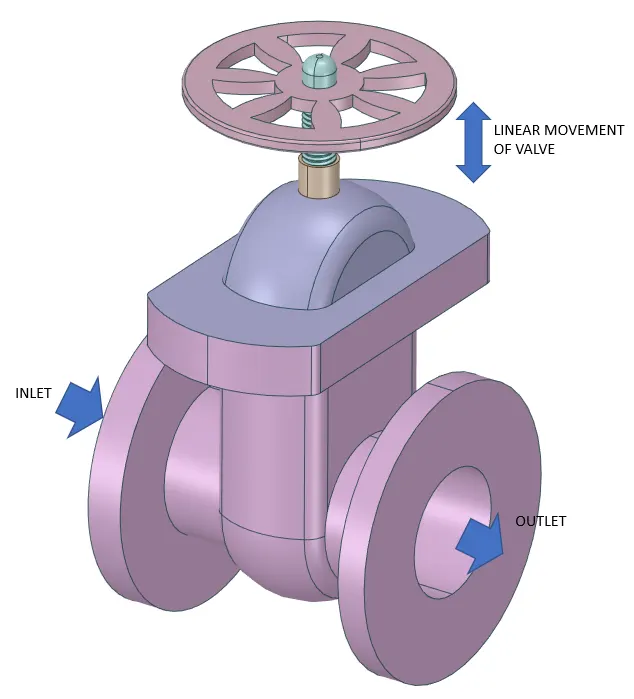
Working Principle:
FLUID VOLUME EXTRACTION
The fluid volume changes as the gate valve lift changes. For this, the verticle movement of the valve is parameterized.
After importing Geometry, hide the “Bottom” Part, so we can clearly see the “Gate Disc”.
- Then Select the “Gate Disc” component and move it in an upward direction by “10 mm” lift.
- To analyze the flow and its effects, we must allow the flow, and for that, we have given the 10 mm lift to the Gate Disc.
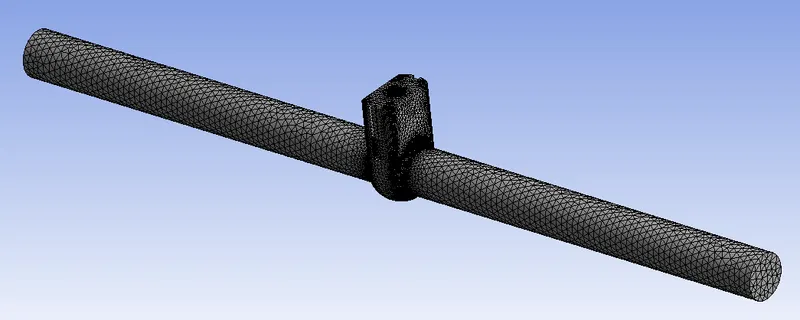
MESHING
Details:
- Element Size: 5 mm
- Number of Elements: 597178
- After Meshing, update it for further process and go for the Fluent Setup.

SETUP:-
- Here we have taken Pressure for inlet = 10 Pa.
- In the Viscous model, we have taken the K-Epsilon model.
- The reason behind choosing the K-Epsilon Viscous model is characteristic of the flow, which is turbulent.
- For Reynolds No. about 2000 and more, flow is turbulent. So we have taken the K-Epsilon Viscous model.
- But here, we have given Pressure Inlet, instead of Velocity Inlet. So knowing the velocity of the flow for correct Reynolds No. is required.
- So, to know the velocity of the flow, we have to go for initializing the solution.
- So, go to Solution, and select Standard Initialization, and Initialize from Inlet.
- After initialization, we can get the correct velocity and calculate the Reynolds No. and from that, we can decide on the appropriate viscous model.
Geometry
- Solver - Pressure Based
- Time - Steady State
Model:-
- Viscous - K -Epsilon (Realizable - Scaleable Wall Function)
Material:-
- Fluid - Water
Boundary Condition:-
- Inlet - Pressure Inlet ( Gauge Pressure - 10 Pa)
Method:-
- Scheme - Coupled
- Initialization - Standard from Inlet
- Number of Iteration - 300
PARAMETRIC STUDY
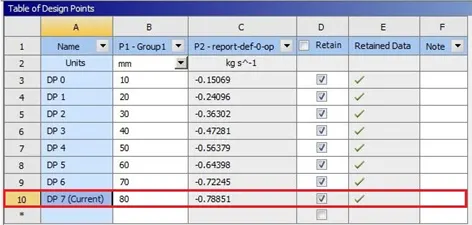
In the above image, the Parameterization of the valve to increase the flow area is given. The parameters are set for the study of different design points of the lift of the gate valve. On completion of the simulation, select “Parameter Set” and give input for different Design Points. Then Update all Design points and check all the results of different Design points.
Cases:
According to the opening of the valve, given as lift of “Gate Disc” in mm, all 8 cases are named as given below:
- Case 1 = 10
- Case 2 = 20
- Case 3 = 30
- Case 4 = 40
- Case 5 = 50
- Case 6 = 60
- Case 7 = 70
- Case 8 = 80
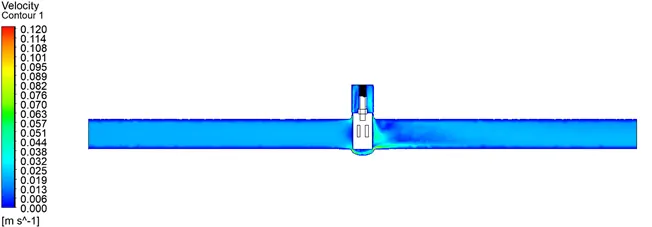
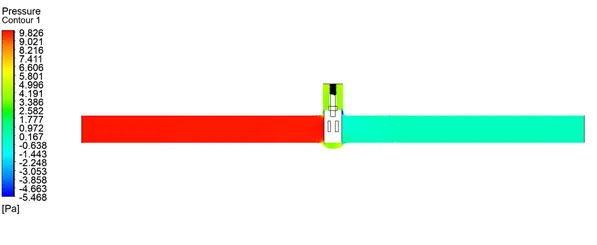
Case 1
Gate valve lifted by 10 mm
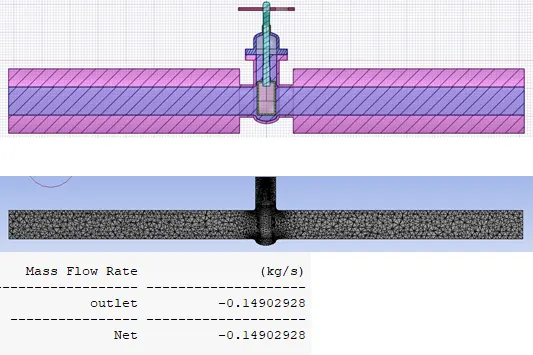
Residual and Mass Flow rate Plot
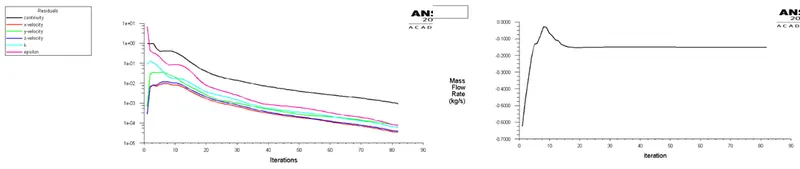
Case 2
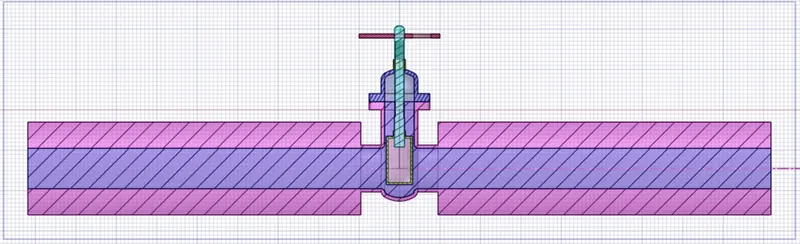
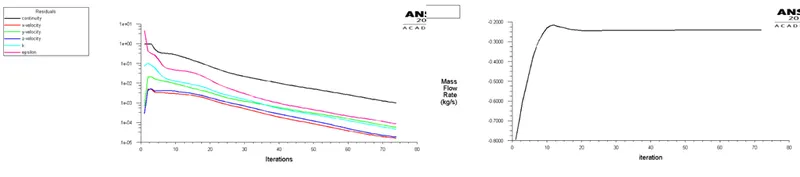
Gate valve lifted by 20 mm
Geometry
Meshing

Residual and Mass Flow rate Plot
Results: Case 2
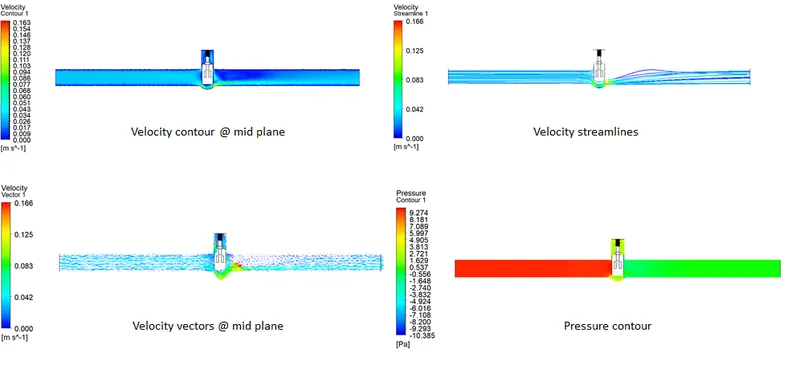
Results: Case 3
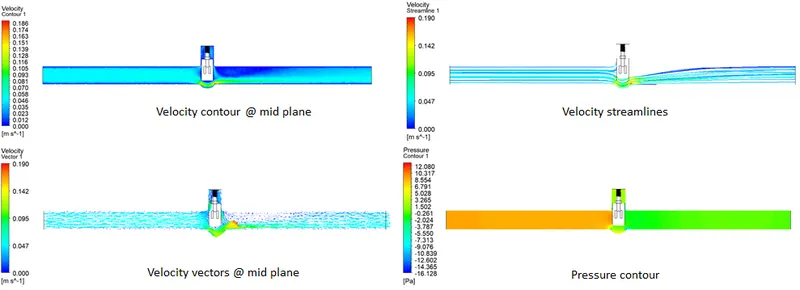 Results: Case 4
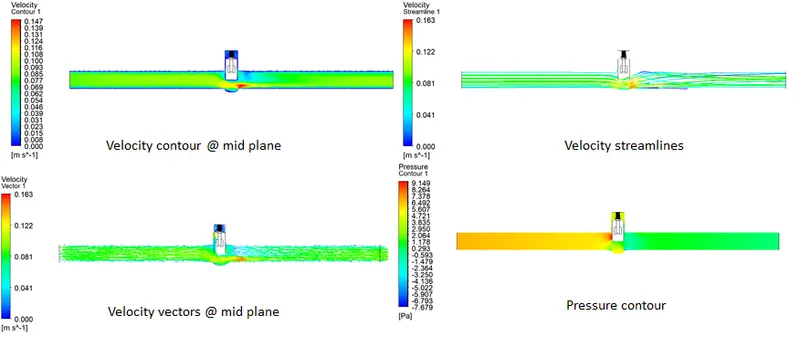
Results: Case 5
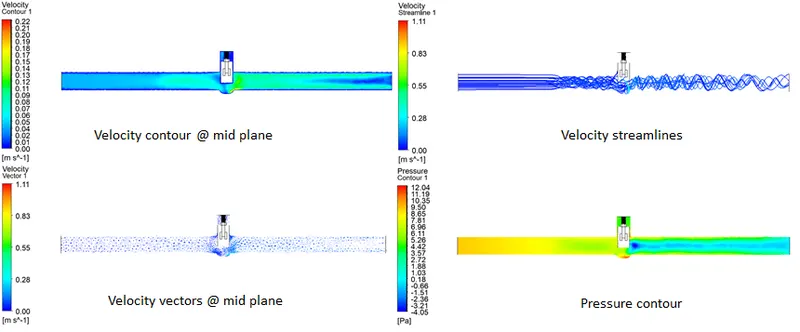
Results: Case 6
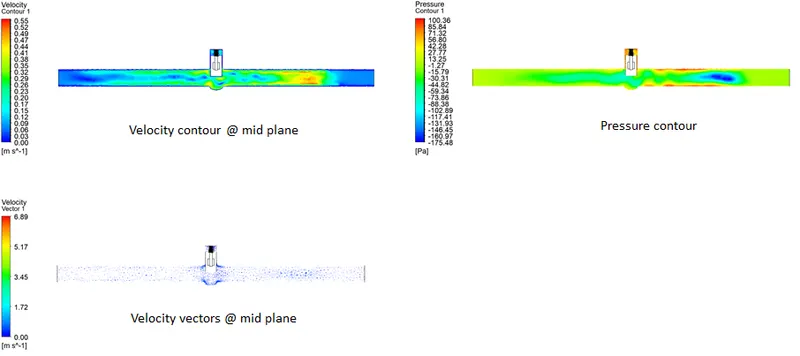
Results: Case 7
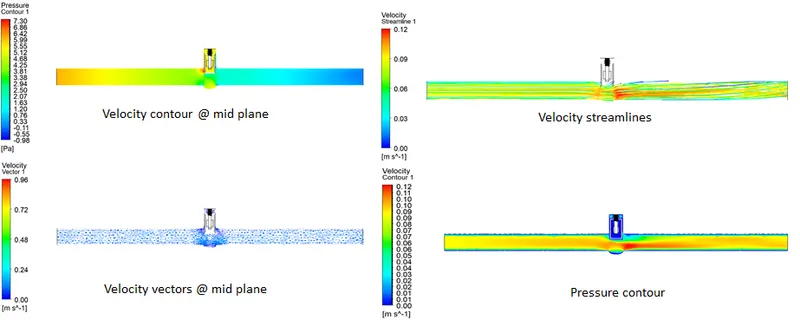
Results: Case 8
Flow factor Kv =0.865* Cv
Flow coefficient Cv= Kv/0.865
Results Statistics
|
Case |
Mass flow rate (kg/s) |
Lift (mm) |
Flow coef. |
Flow factor |
|
Case 1 |
0.157 |
10 |
0.047 |
0.041 |
|
Case 2 |
0.241 |
20 |
0.076 |
0.065 |
|
Case 3 |
0.363 |
30 |
0.114 |
0.101 |
|
Case 4 |
0.472 |
40 |
0.149 |
0.129 |
|
Case 5 |
0.563 |
50 |
0.178 |
0.154 |
|
Case 6 |
0.643 |
60 |
0.203 |
0.176 |
|
Case 7 |
0.722 |
70 |
0.228 |
0.197 |
|
Case 8 |
0.785 |
80 |
0.249 |
0.215 |
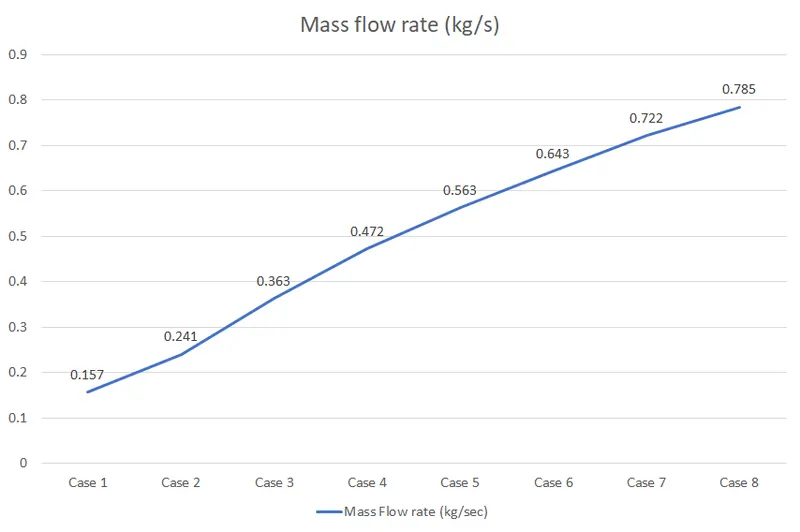
From the above Tabular Data and Graphs, we can observe that
- As the opening of the Gate Valve or Lift of the Gate Disc increases, the Mass Flow Rate increases.
- With Increases in Mass Flow Rate, there is an increment in Flow Coefficient.
Mass flow rate graph for various cases
Conclusion:
1. Mass flow rate gradually increases as the lift of gate disc is increased.