Week 9 - Parametric study on Gate valve.
GATE VALVE SIMULATION
1. OBJECIVE
To obtain the mass flow rates, flow coefficient and flow factor for each design point for the given gate valve model.
2. 3D MODEL
The given 3D model of gate valve is modified to have higher inlet and outlet dimensions to obtain a steady fluid volume.
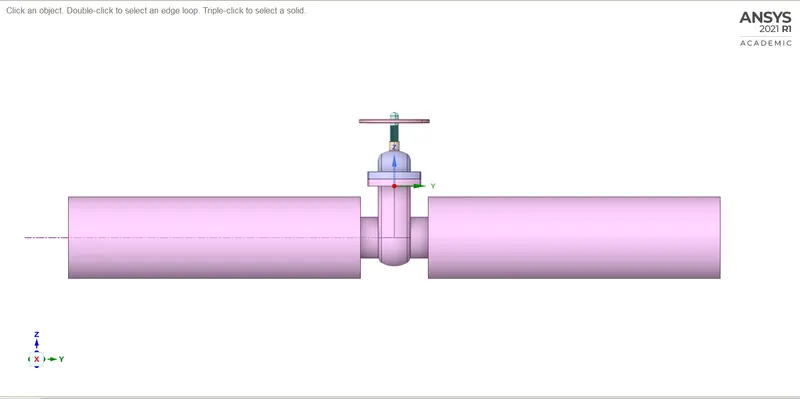
Fig.2.1. Solid Volume
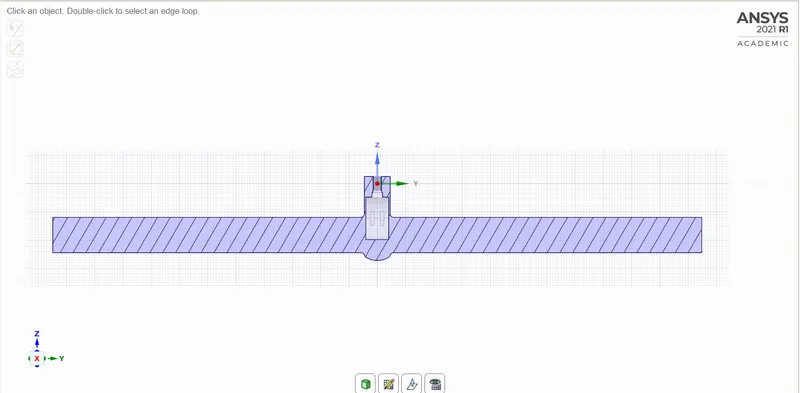
Fig.2.2. Fluid Volume - Sectional View
3. MESH DETAILS
Table 3.1: Mesh Details
|
METRICS |
VALUE |
|
ELEMENT SIZE |
7.5e-3 m |
|
NODES |
56691 |
|
ELEMENTS |
276548 |
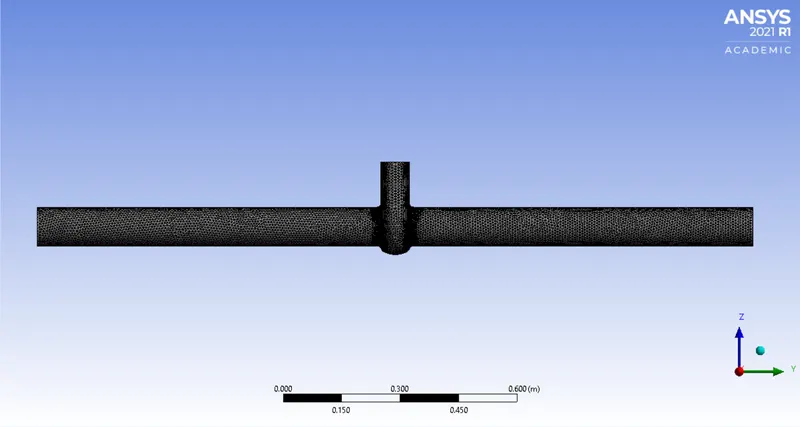
Fig.3.1. Fluid Volume Mesh
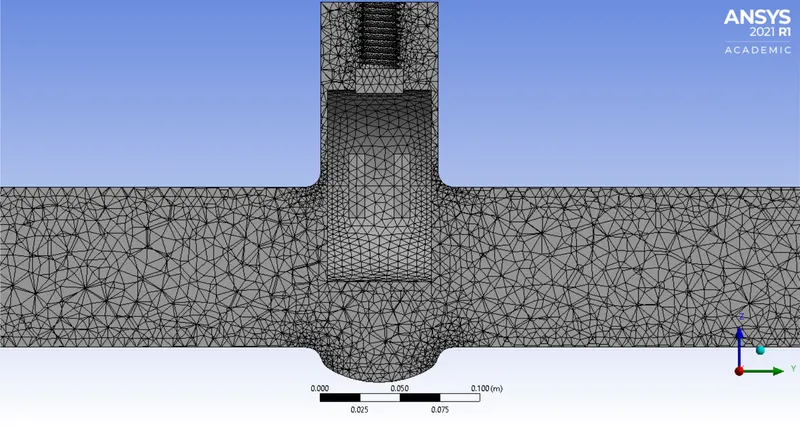
Fig.3.2. Fluid Volume Mesh - Sectional View
4. MATERIAL PROPERTIES
Table 4.1: Material Properties
|
METRICS |
VALUE |
|
MATERIAL |
WATER |
|
DENSITY |
998.8 kg/m3 |
|
VISCOSITY |
0.001003 kg/m-s |
5. BOUNDARY CONDITIONS
Table 6.1: Boundary Conditions
|
METRICS |
VALUE |
|
VISCOUS MODEL |
K-EPSILON REALIZABLE |
|
WALL FUNCTIONS |
SCALABLE |
|
INLET GAUGE PRESSURE |
10 Pa |
|
ITERATIONS |
500 |
6. FORMULAE
Flow Factor (Kv) = Q [(Sg/ΔP)^0.5]
Where, Q = Mass flow rate at outlet
Sg = 1
ΔP = Pressure difference across the gate valve
Flow Coefficient (Cv) = 0.865Kv
7. RESULTS
7.1. RESIDUALS
As the gate disk is lifted from 10mm to 50mm, the residuals tend to converge while the disk is raised from 50mm to 70mm, the residuals tend to fluctuate.
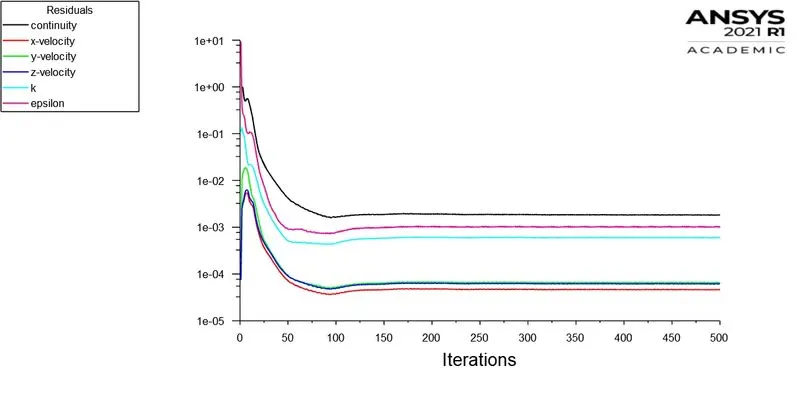
Fig.7.1.1. Residual for 10 mm Lift
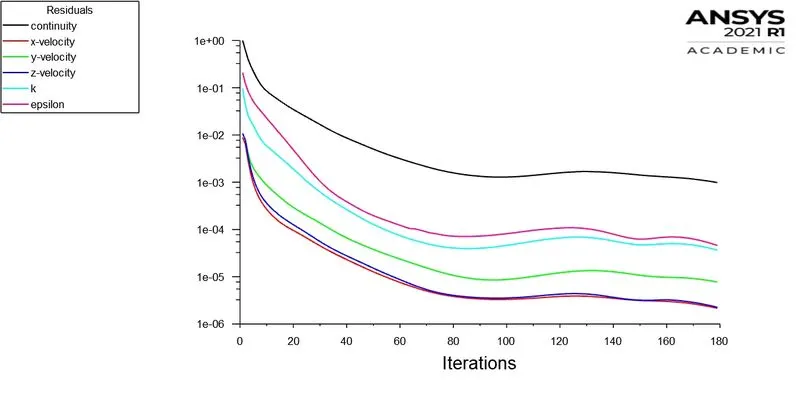
Fig.7.1.2. Residual for 30 mm Lift
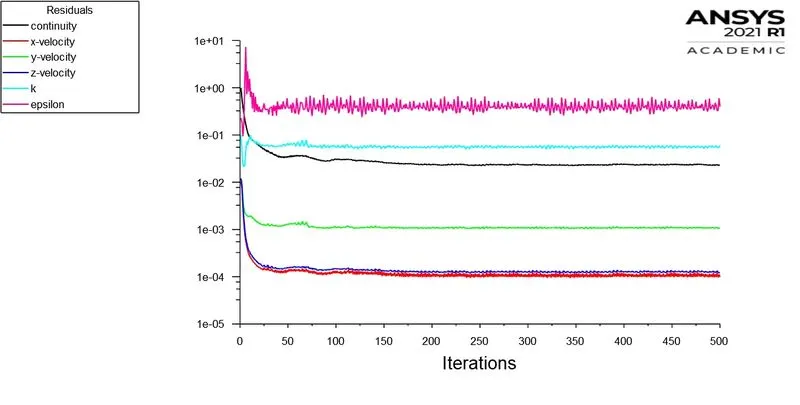
Fig.7.1.3. Residual for 50 mm Lift
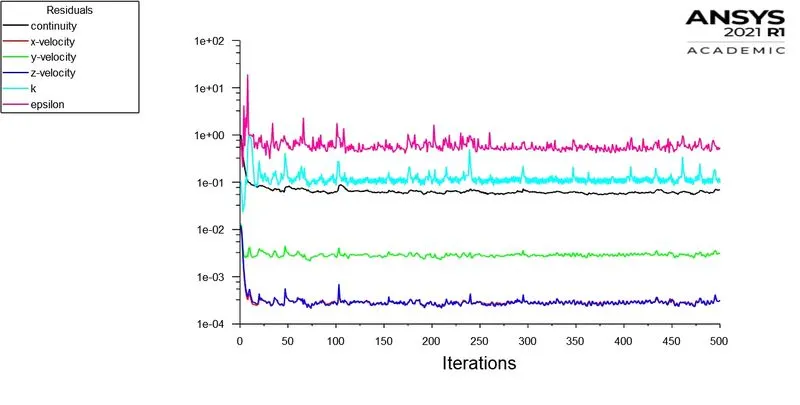
Fig.7.1.4. Residual for 70 mm Lift
7.2. MASS FLOW RATE
The mass flow rate at output tends to drastically decrease and converge for all the plots except at 10mm lift where it attained a converged value after a sharp increase and decrease.
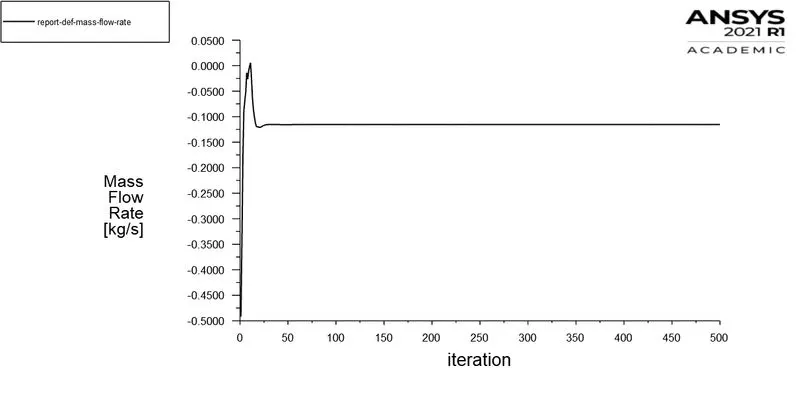
Fig.7.2.1. Mass Flow Rate for 10 mm Lift
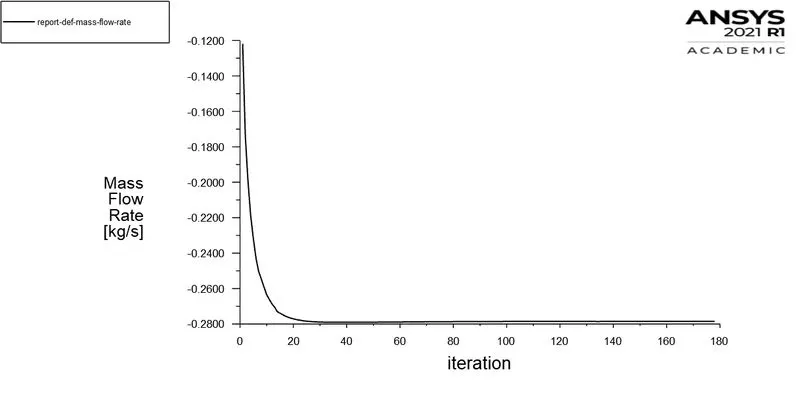
Fig.7.2.2. Mass Flow Rate for 30 mm Lift
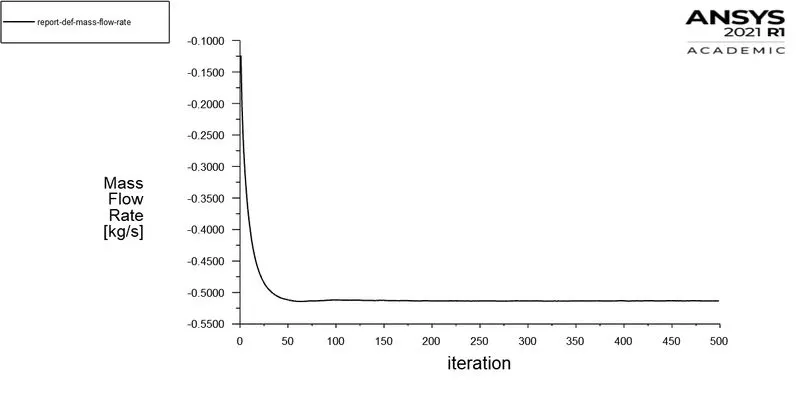
Fig.7.2.3. Mass Flow Rate for 50 mm Lift
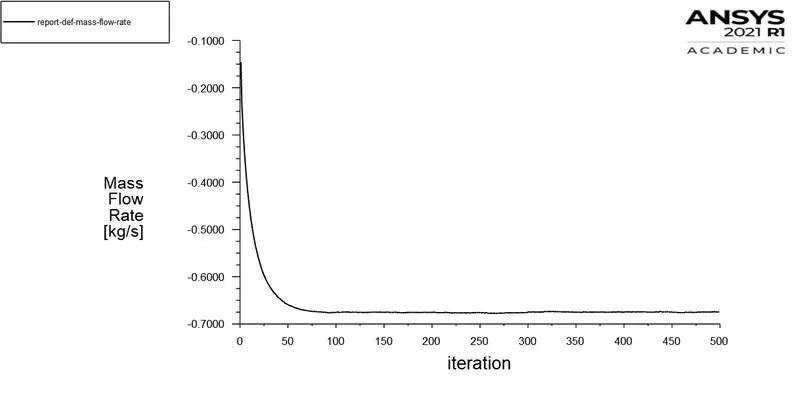
Fig.7.2.4. Mass Flow Rate for 70 mm Lift
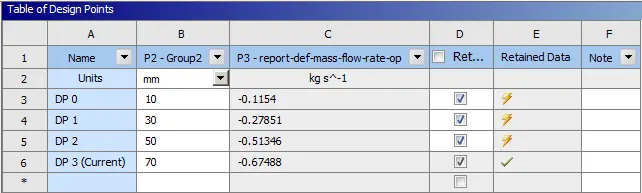
Fig.7.2.5. Table of Design Points
Table 7.2.1: Mass Flow Rate Report
|
LIFT (mm) |
MASS FLOW RATE (kg/m3) |
|
10 |
-0.1154 |
|
30 |
-0.27851 |
|
50 |
-0.51346 |
|
70 |
-0.67488 |
7.3. PRESSURE CONTOURS
As the gate disk is lifted, a region of low pressure tends to form immediately behind the gate disk indicating a high velocity region. Pressure report at two points 0, -0.15m, -0.15m and 0, -0.15m, 0.15m were tabulated for the calculation of flow coefficient and flow factor.
Table 7.3.1: Pressure Report
|
LIFT (mm) |
INLET PRESSURE |
OUTLET PRESSURE |
PRESSURE DIFFERENCE |
|
10 |
9.86128 Pa |
-0.0389025 Pa |
9.9001825 Pa |
|
30 |
9.19712 Pa |
-1.02941 Pa |
10.22653 Pa |
|
50 |
7.30807 Pa |
-0.779663 Pa |
8.087733 Pa |
|
70 |
5.41624 Pa |
0.275819 Pa |
5.140421 Pa |
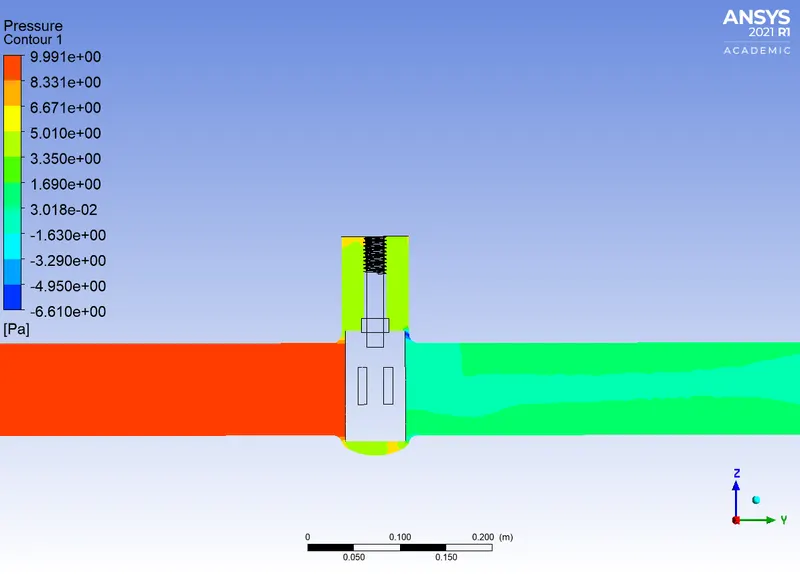
Fig.7.3.1. Pressure Contour for 10 mm Lift
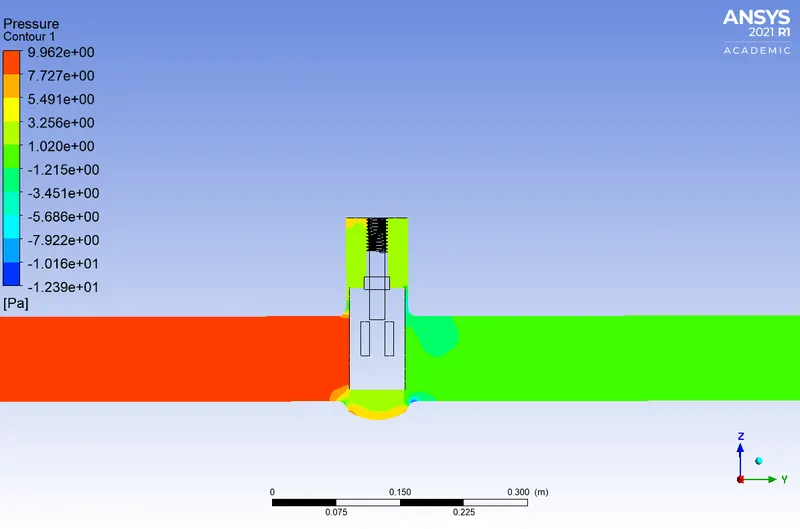
Fig.7.3.2. Pressure Contour for 30 mm Lift
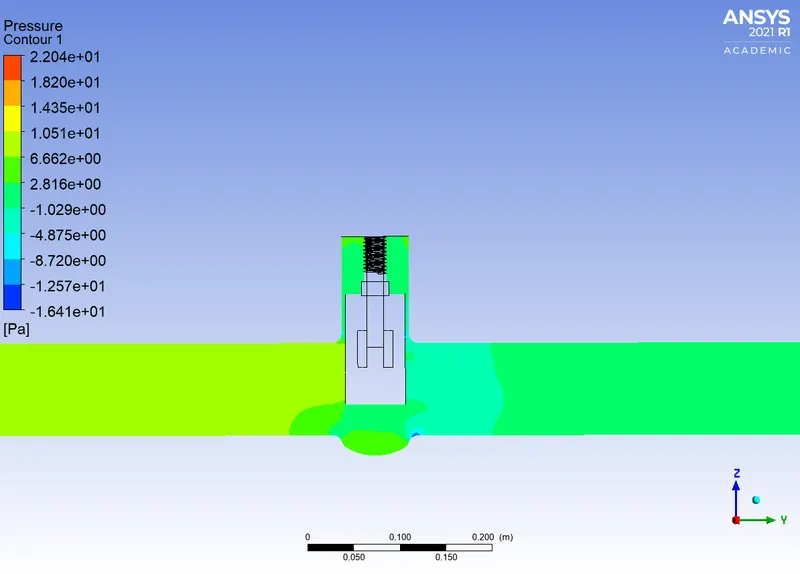
Fig.7.3.3. Pressure Contour for 50 mm Lift
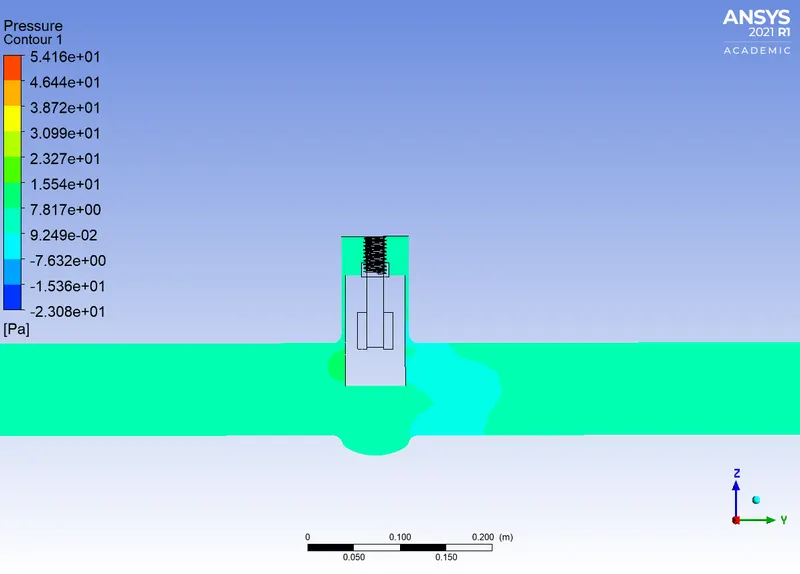
Fig.7.3.4. Pressure Contour for 70 mm Lift
7.4. VELOCITY CONTOURS
As the gate disk is lifted, a high velocity region is displayed at the bottom of the fluid volume while a wake region is observed behind the gate disk resulting in a laminar flow through the gate valve.
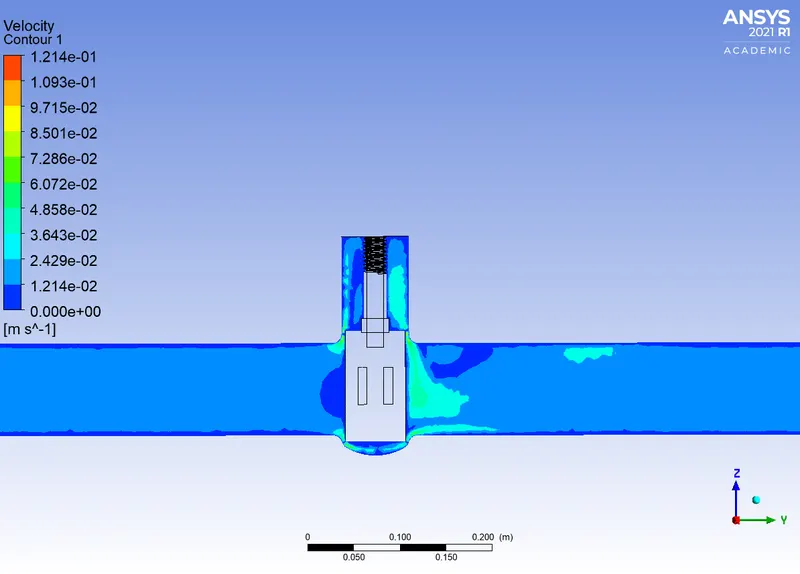
Fig.7.4.1. Velocity Contour for 10 mm Lift
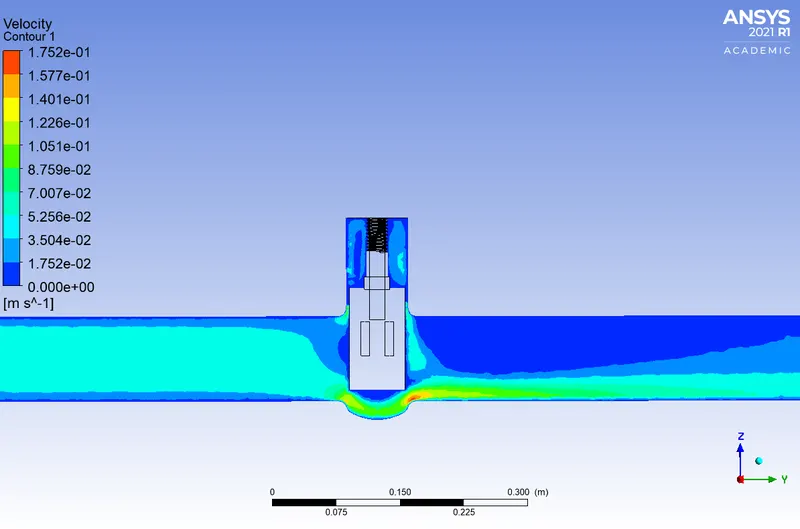
Fig.7.4.2. Velocity Contour for 30 mm Lift
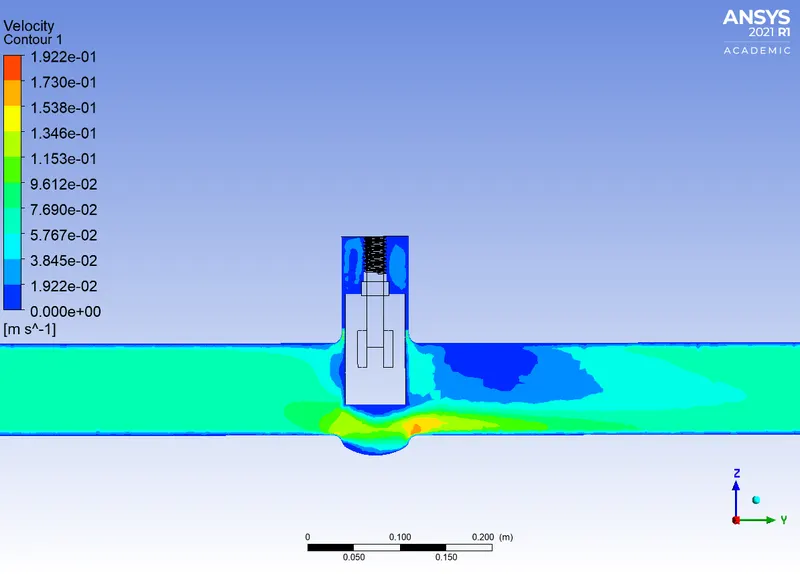
Fig.7.4.3. Velocity Contour for 50 mm Lift
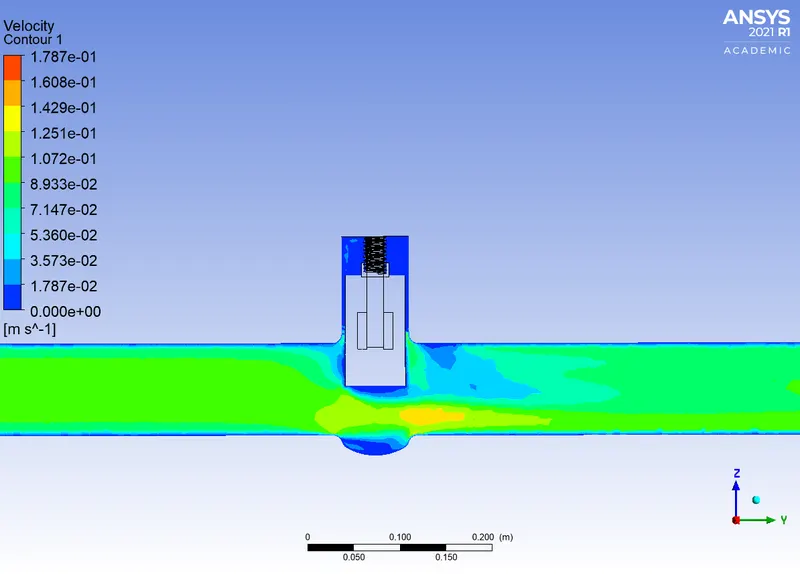
Fig.7.4.4. Velocity Contour for 70 mm Lift
7.5. FLOW FACTOR
As the flow factor depends upon the mass flow rate and pressure difference, it increases along with the lift of gate disk.
Table 7.5.1: Flow Factor vs Lift
|
LIFT (mm) |
FLOW FACTOR (Kv) |
|
10 |
0.03667619 |
|
30 |
0.087091675 |
|
50 |
0.180548221 |
|
70 |
0.297664617 |
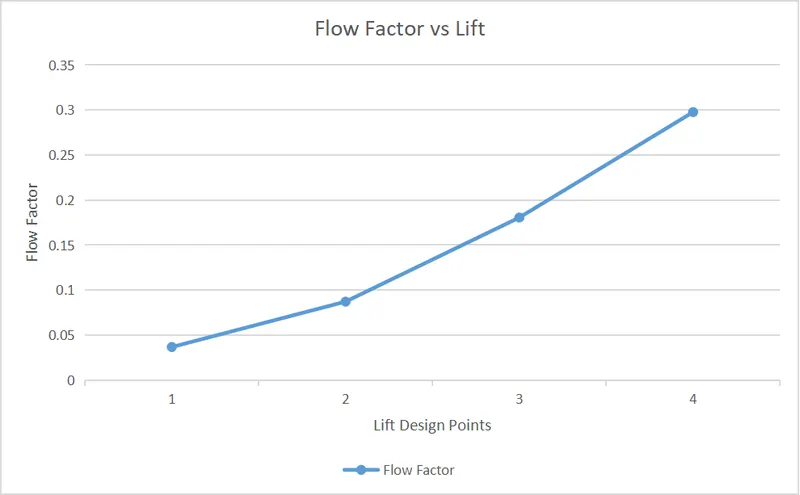
Fig.7.5.1. Flow Factor vs Lift Graph
7.6. FLOW COEFFICIENT
As the flow coefficient depends upon the flow factor, it increases along with the flow factor, having a reduced value of 0.865.
Table 7.6.1: Flow Coefficient vs Lift
|
LIFT (mm) |
FLOW COEFFICIENT (Cv) |
|
10 |
0.031724904 |
|
30 |
0.075334299 |
|
50 |
0.156174211 |
|
70 |
0.257479894 |
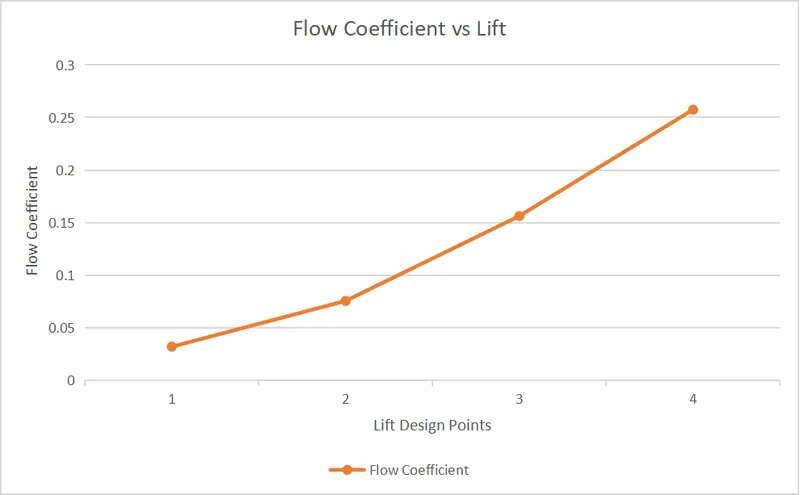
Fig.7.6.2. Factor Coefficient vs Lift Graph
8. CONCLUSION
The mass flow rate, flow factor and flow coefficient increase when the gate disk is lifted from 10mm to 70mm.
A low pressure region (wake) is developed indicating a sudden block for the fluid flow, leading to a steady flow through the gate valve.
A low velocity region is observed at the bottom of the fluid volume acting as a boundary layer to allow steady flow.
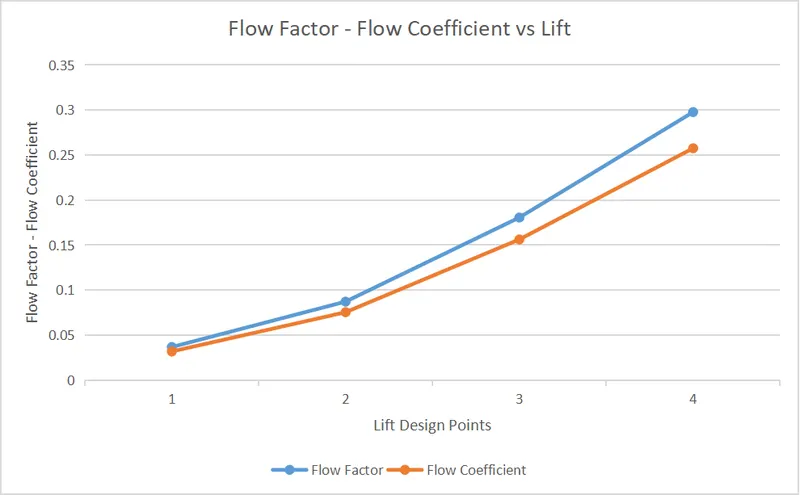
Fig.8.1. Flow Factor-Flow Coefficient vs Lift Graph